22institutetext: Department of Physics, University of Nevada, Las Vegas, NV89154, USA
22email: ajaniuk@physics.unlv.edu, bcz@camk.edu.pl
Modeling the UBVRI time delays in Mrk 335
Abstract
Context.
Aims. We develop a model of time delays between the continuum bands in the Narrow Line Seyfert 1 galaxy Mrk 335 to explain the observed delays measured in this source.
Methods. We consider two geometries: an accretion disk with fully ionized warm absorber of considerable optical depth, located close to the symmetry axis, and an accretion disk with a hot corona. Both media lead to significant disk irradiation but the disk/corona geometry gives lower values of the time delays.
Results. Only the disk/corona models give results consistent with measurements of Sergeev et al., and a low value of the disk inclination is favored. The presence of an optically thick, fully ionized outflow is ruled out at the 2- level.
Key Words.:
accretion disks – X-rays:binaries – galaxies:active1 Introduction
Active galactic nuclei (AGN) are powered by accretion onto a central massive black hole, and the accretion is believed to proceed predominantly through the accretion disk. However, the shapes of the broad band spectra of most AGN are much broader than predicted by the classical disk model of Shakura & Sunyaev (1973). The deviation is not as strong in the case of bright quasars (e.g. Zheng et al. 1997, Laor et al. 1997, Koratkar & Blaes 1999, Czerny et al. 2004, Shang et al. 2005), but in the case of Seyfert 1 galaxies the role of the X-ray emission is essential and the presence of the accretion disk is far less obvious when looking at the optical data. The spectral slopes are much redder than the standard slope of of the Shakura & Sunyaev (1973) disk in the representation (e.g. Edelson & Malkan 1986; Kong et al. 2004). The analysis of the X-ray spectral features may support the view that the disk is disrupted in the inner part of the flow (a relatively narrow iron K is line preferred, e.g. Yaqoob et al. 2001, Reeves et al. 2004, although a weak broad component cannot be ruled out with high significance, e.g. Yaqoob & Padmanabhan 2004, Yaqoob et al. 2005).
Narrow Line Seyfert 1 galaxies (NLS1) are an intermediate type of objects: their spectra are dominated by disk emission, as in bright quasars (see e.g. PG1211+143, Czerny & Elvis 1987; RE J1034+396, Puchnarewicz et al. 2001; Mrk 335, Pounds et al. 1987), and the disk is likely to extend down to the marginally stable orbit (as inferred from the iron line shape in MCG -6-30-15, Tanaka et al. 1995, Fabian et al. 2002; 1H0707-495, Fabian et al. 2004; PG1211+143, Janiuk et al. 2001, IRAS 13349+2438, Longinotti et al. 2003) but the deviations from the standard disk are quite strong as well. NLS1 galaxies usually have profound soft X-ray excesses and/or steep (soft) X-ray spectra (e.g. Brandt et al. 1997, Leighly 1999, Romano et al. 2004, Boller 2004), and their X-ray spectra frequently show warm absorber features (e.g. in MCG-6-30-15, Turner et al. 2004; NGC 4051, Collinge et al. 2001, Ton S 180, Różańska et al. 2004; PG 1211+143, Pounds et al. 2003). It is therefore interesting to explore which additional component, apart from an accretion disk, might be responsible for the overall spectral shape.
We select one of the most studied NLS1 galaxies, Mrk 335 (), for the modeling. This is a typical NLS1 object, with a narrow line (1640 km s-1, Wang et al. 1996), and variable Big Blue Bump with a large soft X-ray excess (Edelson & Malkan 1986, Pounds et al. 1987, Turner & Pounds 1988, Turner et al. 1993, Nandra & Pounds 1994, Leighly 1999), possibly a relativistically smeared iron K line (Gondoin et al. 2002, Crummy et al. 2006), and direct evidence of a weak partially ionized warm absorber (Turner et al. 1993, Reynolds 1997, Bianchi et al. 2001). Since the optical/UV slope is roughly a power law (, with , Constantin & Shields 2003) and does not constrain the model parameters very strongly, we concentrate here on modeling the observed time delays between the UBVRI bands measured for this object. The source was monitored for several years at the Crimean observatory and the time delays between the UBVRI bands were measured (Doroshenko et al. 2005, Sergeev et al. 2005). We describe the model in Sect. 2. In Sect. 3 we describe its application to Mrk 335, and in Sect. 4 we discuss the consistency of the results with independent estimates of the central black hole mass and the optical depth of the warm absorber.
2 Model
The UV/optical/IR continuum of Mrk 335 varies significantly (Sun et al. 1994, Kassebaum et al. 1997, Peterson et al. 1998, Tao et al. 2004, Klimek et al. 2004). The measured delays of the continuum between the U band and BVRI bands increase with the wavelength difference (Sergeev et al. 2005, Doroshenko et al. 2005). Such variations in AGN spectra are most likely caused by the irradiation of the outer parts of the accretion disk responsible for the optical/UV emission by the EUV and X-ray radiation generated in the innermost part of the disk, as discussed by Collin-Souffrin (1991) (see also Courvoisier & Clavel 1991, Krolik et al. 1991, Collier et al. 1998 and Oknyanskij et al. 2003). The direct irradiation of the outer parts of the disk by the inner disk is unlikely (Loska et al. 2004). The reason is that AGN disks are geometrically very thin, much thinner than GBH disks. In Seyfert 1 galaxies the irradiation is possible due to the extended optically thin X-ray emitting inner region, which increases the geometrical factor (Rokaki et al. 1993, Chiang 2002). However, in NLS1 the standard, optically thick disk extends to the marginally stable orbit, rather than being disrupted in its inner part, and therefore the presence of an optically thin inner flow is rather unlikely.
Therefore, we suggest here that additional material may efficiently redirect the nuclear emission towards the outer disk. We consider in detail two geometries: a warm absorber type medium, predominantly occupying the region around the symmetry axis, and the disk wind/corona, located closer to the disk plane.
2.1 Disk with a warm absorber
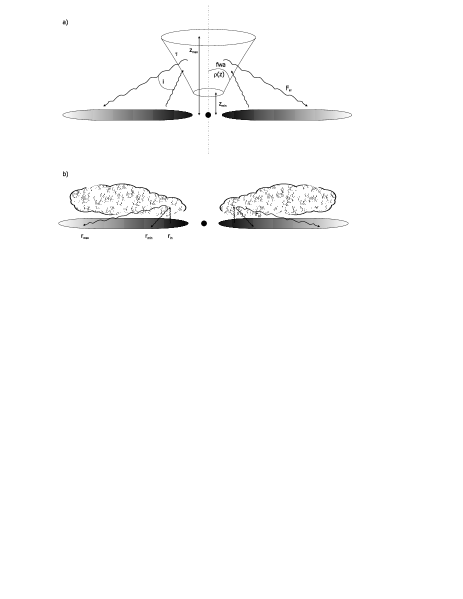
We apply here the simple model of disk irradiation described in Czerny et al. (2003). We neglect the true absorption effect due to the warm absorber since (i) we are mostly interested in the fully ionized fraction of this material (ii) the absorption is limited to the 0.5 - 2 keV energy band, and the scattering effect (working in the whole energy band) is more effective than absorption and reemission in redirecting outgoing photons towards the disk. We assume that most of the scattering medium is located near the symmetry axis in the form of a cone (see Fig. 1). The warm absorber parameters are: the fraction of the sky covered by the cone, (equivalently, the opening angle of the cone), the smallest and the largest distance, and , of the scattering material measured along the symmetry axis, the parameter that measures the density distribution of the warm absorber ( ), and the total optical depth of the medium for scattering, .
The local irradiation flux is given by
| (1) |
where
| (2) |
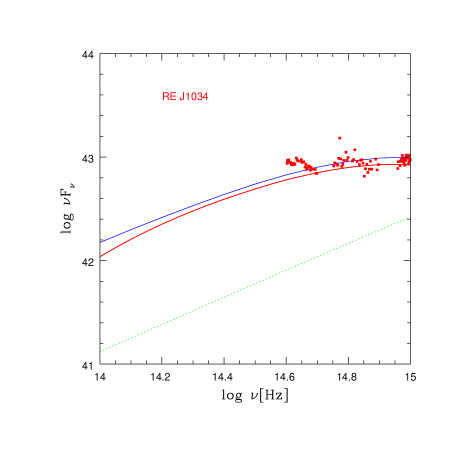
with being the total luminosity of the source. This approach is much less time consuming than the more accurate modeling done by Loska et al. (2004). However, our model is still capable of producing reliable results. In the most extreme case of irradiation considered for the source RE J1034+396, the simplified numerical scheme underestimates the flux in the optical range by 25 % (see Fig. 2) but the overall shape is preserved; in moderate illumination cases, with higher , the error does not exceed a few percent.
The disk internal emission is described in the Newtonian approximation, and parameterized by the black hole mass, , and the dimensionless accretion rate, , defined with the efficiency factor of 1/12 included (appropriate for Newtonian boundary condition, Shakura & Sunyaev 1973), i.e.
| (3) |
The illuminated disk is assumed to radiate locally as a black body. This simplifying assumption allowed us to save computer time, and is fully justified. However more detailed models of the disk emission do show a departure of the local spectrum from a black body, but this is only if the opacities of heavy elements are neglected. As shown e.g. in Hubeny et al. (2001) and Madej & Różańska (2000), taking these opacity effects into account minimizes the difference with respect to a blackbody spectrum (apart from the soft X-ray part).
The emitted disk spectrum passes through the warm absorber, so the observed spectrum is reduced by the factor with respect to the intrinsic spectrum. In this way we neglect the possible clumpiness of the warm absorber, which in principle may decouple the specific line of sight from the average scattering probability.
The time delays are calculated assuming that, for a given radius, all irradiating flux comes from a single representative distance on the symmetry axis. This distance is calculated as the effective distance, in the following way
| (4) |
The delay of the emission from a given radius with respect to the emission from the innermost part of the disk is calculated as
| (5) |
2.2 Disk with a flaring corona
The accretion disk is also likely to develop an extended corona or a wind-type outflow. In this case the additional hot material is located predominantly close to the disk surface but high enough to intercept some of the nuclear flux much more effectively than the disk surface itself. There may be some dissipation taking place directly in the wind-corona. Both effects will increase the local disk temperature. Since there are no well justified models of this situation, we model such a disk assuming that a fraction of the disk, between and , is irradiated by additional flux. This irradiating flux is simply parameterized as a power law
| (6) |
where the normalization coefficient A is introduced through the parameter describing the ratio of the total energy in this component to the total energy due to accretion
| (7) |
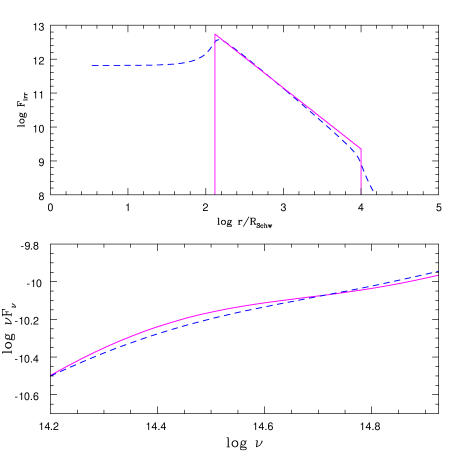
Again, we tested the analytical approach against the 3-D numerical computations of the scattering in a corona which has a density profile in the radial direction but is uniform in the direction (in spherical coordinates) and has a constant opening angle. The results are illustrated in Fig. 3. Our analytical model is approximately correct although the exact results predict some irradiation effect in the innermost part of the disk (below , roughly constant with radius) as well as above (decreasing roughly as ). The irradiation is significantly different from a point-like source since in our model we have an extended region with incident flux decreasing as an arbitrary power of radius (physically determined by the density distribution in the corona) while in the case of a point-like irradiation the incident flux is always constant below a certain radius and decreases as above it.
In computations of time delays we neglect the extension of the coronal medium in the vertical direction, so the emission from a given radius is delayed with respect to the central regions by
| (8) |
2.3 Time delays in UBVRI bands
In order to determine the time delay at a given wavelength with respect to the emission from the innermost part of the disk we have to connect a given radius with a representative wavelength. In the simplest approximation, this can be done taking into account that a local black body emission with the temperature peaks at in a vs. diagram. However, if the spectrum is not of a single black body type, the dominant contribution may not be well determined by such a criterion (for example, for a power law spectrum a factor before depends on the spectral slope; see Siemiginowska & Czerny 1989). Since the shapes of the model spectra are more complex than a single power law, we use a numerical approach. In order to connect a given radius with a representative wavelength, we calculate a model with a narrow gap in the disk around a certain radius, then we compare the spectrum to the model without a gap. We find the wavelength where the ratio of the gap model spectrum to the full model spectrum was the lowest. By repeating such a procedure we identify a set of radii with a corresponding sequence of wavelengths.
2.4 Data
The Galactic hydrogen column in the direction of Mrk 335 is cm-2 (Veron-Cetty et al. 2001). The reddening can therefore be estimated by taking the standard relation for the interstellar medium in the Galaxy (Bohlin et al. 1978) which gives and the data were corrected accordingly. The continuum fluxes used for model fitting are given in Table 1.
| flux [mJy] | |
|---|---|
| U | 14.23 |
| B | 13.99 |
| V | 15.51 |
| R | 18.09 |
| I | 19.49 |
| J1 | 21.00 |
| J2 | 22.10 |
The data points are taken from NED (McAlary et al. 1983, Spinoglio et al. 1995).
The source was systematically monitored in Crimea for 10 years (Doroshenko et al. 2005, Sergeev et al. 2005). The measured delays between the various optical bands are given in Table 2.
| Band | Doroshenko et al. | Doroshenko et al. | Sergeev et al. | Sergeev et al. |
|---|---|---|---|---|
| peak | centroid | peak | centroid | |
| U | - | - | ||
| B | - | - | ||
| V | ||||
| Rc | ||||
| I/Ic |
The delays measured with respect to the U band in Doroshenko et al. (2005) and with respect to the B band in Sergeev et al. (2005). Either the standard or Cousins filter system was used (Rc,Ic). Quoted measurement uncertainties are 1 errors.
The measured delays generally depend on the method (peak or centroid), and the errors in measurements with respect to the U band are much larger than those measured with respect to the B band. The I vs. B delay of Sergeev et al. (2005) gives an upper 1 limit of 2.5 - 2.6 day, independent of the method.
The delays measured by Doroshenko et al. (2005) are systematically larger. All models are consistent with 1 upper limits of more than 17 days of delay between the U and I band. However, we consider this delay measurements as much less certain than the delays given by Sergeev et al. (2005) since the measurement of U flux is much less certain than the measurement of B, when a relatively small telescope located in a poor astronomical site is used.
3 Results
3.1 Bare disk model
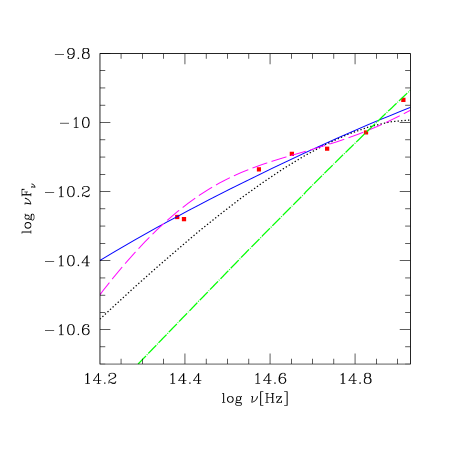
The presence of time delays in Mrk 335 between the optical bands, increasing with the wavelength separation, clearly suggests the role of reprocessing in the formation of the optical spectra. However, as a reference we consider a simple fit to the spectrum by a non-irradiated standard disk.
The spectrum is relatively blue at longer wavelengths (), but it is still not as steep as expected from the standard disk, and it flattens at shorter wavelengths to . Such a curved spectrum can be fitted by a standard disk if the black hole mass is high, so the maximum disk temperature is within the optical/UV band. An example of the data fit without the presence of the warm absorber is shown in Fig. 4 (dotted line). The model does not fit the near-IR data points but this can be explained by starlight contamination. However, such a model cannot account for the total luminosity of the source (the model bolometric luminosity is only erg s-1 while the source bolometric luminosity was estimated to be much higher, erg s-1; Pounds et al. 1987, or erg s-1; Edelson & Malkan 1986). The required mass is much higher than the value obtained from the reverberation (, Peterson et al. 2004).
On the other hand, if we fix the accretion rate at some larger value, as expected for NLS1 galaxies, and we adjust the black hole mass to the required emission level, the resulting black hole mass is not so large (e.g. for adopted ) but the predicted spectrum is much too blue to represent the data points (see the steepest line in Fig. 4).
Therefore, the bare disk model is unlikely to represent well the Mrk 335 data. Most of the older models based on the fit to optical/UV data alone would now face the same problem, as the masses inferred by such models are high (e.g. Sun & Malkan 1989, for a top view, and it is larger for higher inclination angles; Zheng et al. 1995, ).
3.2 Irradiated disk model
Both geometries, irradiation due to the scattering by a fully ionized warm absorber and due to scattering by the disk corona, can account for the overall shape of the spectrum. We did not try to differentiate between the models on the basis of the quality of the fit because the observational points can have some systematic errors due to slight internal reddening, starlight contamination and the contribution of the small blue bump (i.e. Fe II and Balmer continuum) to the continuum. Also the theoretical predictions are not precise; various treatments of the radiative transfer in the disk surface can lead to differences between the models of the order of 20% in the U band if the normalization in the I band is fixed (see e.g. Ross et al. 1992, Hubeny et al. 2001). Since for each mass, accretion rate and inclination angle we fit other model parameters, we obtain a satisfactory data representation for a broad range of these basic parameters. The results for the time delays for acceptable values of mass and accretion rates are given in Table 3 and Table 4 for the two models: the warm absorber and disk/corona system, respectively.
In both cases the acceptable solutions create an extended elongated region in parameter space since an increase in the black hole mass can be compensated by the decrease in the accretion rate in order to normalise the spectrum consistently with the data (see for example the discussion by Tripp et al. 1994 of the bare disk data fitting). The location of this region depends on the inclination angle: larger disk inclinations allow for larger masses for a given accretion rate. The width of this elongated region is provided by the additional model parameters, and it is much larger in the disk/warm absorber scenario than in the disk/corona scenario. For example, if we fix the black mass at and the inclination angle at , the acceptable fits in the disk/warm absorber geometry are obtained for (, , , , ), for (, , , , ), and for (, , , , ). In the disk/corona geometry, the acceptable fits are for (, , , ) and for (, , , ).
We give in Table 3 and Table 4 the theoretical delays between the B and I band. The delays are systematically larger for the disk/warm absorber geometry than for the disk/corona geometry since the light travel time through the warm absorber and back to the disk contributes to the delays.
| log M: | 6.5 | 6.75 | 7.0 | 7.25 | 7.5 | 7.75 | 8.0 |
|---|---|---|---|---|---|---|---|
| cos i = 1.0 | |||||||
| log | |||||||
| 0.2 | x | x | x | x | 3.0 | 4.3 | x |
| 0.4 | x | x | x | 3.5 | 3.6 | 7.7 | x |
| 0.6 | x | x | 3.7 | 6.1 | 5.6 | x | x |
| 0.8 | x | x | 3.2 | 3.3 | 6.2 | 8.3 | x |
| 1.0 | x | 2.9 | 3.0 | 4.5 | x | x | x |
| cos i = 0.75 | |||||||
| log | |||||||
| 0.2 | x | x | x | x | 6.0 | 4.4 | 9.3 |
| 0.4 | x | x | x | 5.2 | 9.7 | 8.0 | 11.0 |
| 0.6 | x | x | 5.1 | 4.6 | 8.7 | x | x |
| 0.8 | x | x | 6.1 | 9.3 | 7.8 | x | x |
| 1.0 | x | x | 7.0 | 6.3 | 9.5 | x | x |
| cos i = 0.50 | |||||||
| log | |||||||
| 0.2 | x | x | x | x | x | 8.2 | 12.0 |
| 0.4 | x | x | x | x | 7.3 | 9.0 | 13.0 |
| 0.6 | x | x | x | 6.6 | 10.0 | 12.0 | 14.0 |
| 0.8 | x | x | 7.6 | 6.9 | 13.0 | 14.0 | 17.0 |
| 1.0 | x | x | 5.9 | 6.7 | 17.0 | x | x |
Accretion rate is given in dimensionless units, assuming standard efficiency of accretion onto a non-rotating black hole. Other model parameters were found as the best fit to the optical/IR data of Mrk 335. Signs ’x’ mark the values of black hole masses and accretion rates for which no acceptable model can be fitted to the data.
| log M: | 6.5 | 6.75 | 7.0 | 7.25 | 7.5 | 7.75 | 8.0 |
|---|---|---|---|---|---|---|---|
| cos i = 1.0 | |||||||
| log | |||||||
| 0.2 | x | x | x | x | 1.7 | x | x |
| 0.4 | x | x | x | 2.1 | x | x | x |
| 0.6 | x | x | x | 1.9 | x | x | x |
| 0.8 | x | x | 1.9 | x | x | x | x |
| 1.0 | x | x | 2.0 | x | x | x | x |
| cos i = 0.75 | |||||||
| log | |||||||
| 0.2 | x | x | x | x | x | x | x |
| 0.4 | x | x | x | x | 3.3 | x | x |
| 0.6 | x | x | x | 3.7 | x | x | x |
| 0.8 | x | x | x | 3.7 | x | x | x |
| 1.0 | x | x | 3.7 | 3.7 | x | x | x |
| cos i = 0.50 | |||||||
| log | |||||||
| 0.2 | x | x | x | x | x | 4.0 | x |
| 0.4 | x | x | x | x | x | x | x |
| 0.6 | x | x | x | x | 5.3 | x | x |
| 0.8 | x | x | x | 5.8 | x | x | x |
| 1.0 | x | x | 4.5 | 5.3 | x | x | x |
Accretion rate is given in dimensionless units, assuming standard efficiency of accretion onto a non-rotating black hole. Other model parameters were found as the best fit to the optical/IR data of Mkr 335. Signs ’x’ mark the values of black hole masses and accretion rates for which no acceptable model can be fitted to the data.
We compare these delays to the observations summarized in Table 2. Only predictions of the disk/corona geometry at low inclination () are consistent with the upper 1 limit of Sergeev et al (2005) These models cover a broad range of accretion rates (from 0.2 to 1 in dimensionless units) and black hole masses range from to .
An example of the wavelength-dependent time delays for one of the disk/corona models is shown in Fig. 5. We see a good agreement between the model and the data. The delays increase with the wavelength separation in a similar way in the model and in the data.
None of the disk/warm absorber models is acceptable within a 1 error.
If a larger 3 error is allowed, the upper limit for the I vs. B delay increases to 7.1 days (centroid measurement) and to 7.0 day (peak measurement). All disk/corona models, as well as several low inclination examples of the disk/warm absorber geometry, satisfy this requirement.
Although the numerical method allows us to determine the time delays precisely from the point of view of the adopted algorithm, the actual errors of such determinations are significant. Using the method outlined above, we tested the radial extension of the region responsible for emission at a given wavelength. For a specific model, the radial extension of the zone responsible for 50% of the flux in B band was from to , and the zone responsible for 50% of the flux in I band lay between and . It is therefore not surprising that the errors of the measured time delays are also large.

We also checked whether the dependence of the variability level on the wavelength is well reproduced by any of the models. We considered two luminosity states in a single representative model: one with the accretion rate (and luminosity) enhanced in the innermost 10 and one with a suppressed innermost accretion rate. The enhancement/suppression factor was adjusted to the ratio of the minimum to maximum flux in B band given by Doroshenko et al. (2005). We used their photometric measurements for that purpose. The basic model parameters were as in Fig. 4.
We give the results in Table 5 for the disk/corona model, but the results for the disk/warm absorber geometry are almost the same. In the data, the variability amplitude decreases towards IR but in the model it actually increases. This is due to the fact that we assumed a constant intrinsic disk emission at larger radii and variable irradiation, and that the role of irradiation increases towards the IR in order to reproduce the observed spectra that are much redder than the intrinsic disk spectrum. We can assume that a certain amount of starlight contributes to the spectrum in the VRI band. However, the amount of starlight required to suppress the variability is very large (see column 4 in Table 5). If the spectrum is corrected for such an amount of starlight the intrinsic spectrum becomes bluer than in the standard disk, leaving no space for the effect of irradiation and time delays. We cannot perform self-consistent computations for the full model, with starlight iterations (i.e adopting a certain starlight distribution, finding new best solution for the spectrum, checking the variability properties, correcting the starlight again etc), since this is too time consuming. However, we estimated the probability of finding a consistent solution satisfying both the requirement of a red spectral slope and variability amplitude decreasing strongly with increasing wavelength. We used for that purpose an analytical power law description for all three spectral component independently, assuming an arbitrary power law index for the starlight contribution, an index of 1/3 for the disk, an index of -1 for the spectral component due to irradiation, and we searched the parameter space of the starlight index and the two normalization factors, determining starlight to disk and irradiation to disk ratios. In all solutions with variability larger in B band than in I band, the difference in the variability level was by 1 - 2 %, the IR slope in the final spectrum was unacceptably steep (with power law index above 2.7), and the overall variability level in B band was too low () for models with the IR index smaller than 3.0.
The variability at longer wavelengths may be smeared, and the amplitude effectively lowered due to the larger reprocessing area. More advanced time-resolved modeling is necessary to verify this possibility.
| starlight | |||
|---|---|---|---|
| measured | disk/corona model | required | |
| B | 1.550 | 1.550 | 0 |
| V | 1.384 | 1.667 | 36 |
| R | 1.358 | 1.703 | 42 |
| I | 1.343 | 1.819 | 55 |
The measurements are from Doroshenko et al. (2005), photometric data, the parameters of the disk/corona model are as in Fig. 4, the fourth column gives the amount of starlight required to dilute the variability to match the observations.
4 Discussion
We considered two geometries that can provide the required efficient irradiation of the outer parts of an accretion disk responsible for the optical emission: a disk/warm absorber geometry and a disk/corona geometry. In the first case the scattering material is located relatively far from the disk, around the symmetry axis, while in the second geometry the scattering material is located closer to the disk surface.
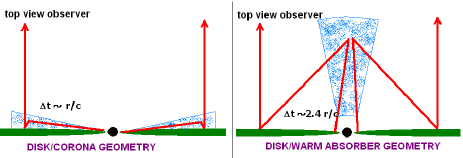
We compared the predictions of these two geometries to the measurements of the time delays between the various continuum bands. The expected time delays are generally shorte by a factor of 2-3 in the case of the disk/corona geometry than in the disk/warm absorber geometry. This is due to the fact that for a disk radius of interest, , the effectively scattering coronal region is located roughly at the disk radius distance from the center while the most effectively scattering warm absorber region is located at the distance along the symmetry axis and the overall distance traveled by photons is roughly before the radiation reaches the disk surface, as illustrated in Fig. 6.
The rather short time delays measured by Sergeev et al. (2005) strongly favored disk/corona geometry and low inclination of the source. High inclination of this source (), suggested by Crummy et al. (2006) on the basis of the reflection model of the soft X-ray excess, is ruled out at the 2- level. Both models in their simple versions cannot account for a decrease of the variability with wavelength since the irradiation, needed to reproduce the observed spectra redder than a bare disk spectrum, also increases with the wavelength. However, our simple approach to the wavelength-dependent variability amplitude did not take into account the increase of the reprocessing region with the wavelength which may result in additional suppression of the variability in R and I bands. The possibility of a starlight contribution alone did not seem to provide the solution.
The disk/corona set of models favored by the delay measurement of Sergeev et al. (2005) have black hole masses in the range from to . Such values are in agreement with the best mass measurement based on reverberation (, Peterson et al. 2004). The acceptable accretion rates cover a broad range (see Table 4). However, if we adopt the Peterson et al. value of the mass, the required accretion rate is within the range of 0.55 - 0.75 (in dimensionless units). This is consistent with the typical values derived for NLS1 objects (e.g. Kuraszkiewicz et al. 2000). The other parameters of the model, required by fitting the continuum, are also reasonable. The parameter in all acceptable models was 1.8, and the fraction of the bolometric luminosity undergoing reprocessing should be between 0.12 (for an accretion rate of 0.55) and 0.07 (for an accretion rate 0.75), for the Peterson et al. mass. On the other hand, if indeed a small inclination angle is favored for this source, the estimate of the mass from reverberation may be strongly biased (see the discussion by Collin et al. 2006).
The corona model is roughly consistent with the expectations of the Inverse Compton heated disk/coronae and disk/wind scenarios developed in a number of papers (Begelman, McKee & Shields 1983, Ostriker et al. 1991, Murray et al. 1994; see Woods et al. 1996 for hydrodynamical simulations). The inner disk develops a static corona with negligible thermal outflow while the outer region, where the Inverse Compton temperature is larger than the local virial temperature, develops a strong wind. The transition region is estimated to be at a fraction of the Inverse Compton radius (maximum strength of the corona at 0.2 in the simulations of Woods et al.). The disk optical/UV spectra obtained in the present paper are similar to those determined from more exact coronal solutions (e.g. Kurpiewski et al. 1997). Assuming an Inverse Compton temperature corresponding to Mrk 335 of K, we obtain the predicted outer radius of the corona of , of the same order as required by our fits to the data.
The disk/warm absorber geometry is not consistent with the delay measurements of Sergeev et al. (2005). This indicates that there is no massive outflow of the fully ionized material along our line of sight to Mrk 335, although such an outflow of considerable optical depth was suggested to take place in another NLS1 galaxy (PG1211+143, King & Pounds 2003). Our results are consistent with the values obtained for the partially ionized warm absorber column in Mrk 335 (small value of the column density cm-2, equivalent to , Bianchi et al. 2001; a similar value of cm-2 was obtained by Longinotti et al. 2006), since such a warm absorber would not backscatter a significant amount of radiation. Unfortunately, for PG1211+143, no delay measurements exist, so we cannot perform consistency tests for that source.
Acknowledgements.
We thank Arkadiusz Olech and Valya Doroshenko for very helpful discussions, Zbyszek Loska for his 3-D computations of the scattering of photons by the corona, and Suzy Collin for many helpful remarks which helped to improve the original version of the manuscript significantly. Part of this work was supported by grant 1P03D00829 of the Polish State Committee for Scientific Research. This research has made use of the NASA/IPAC Extragalactic Database (NED) which is operated by the Jet Propulsion Laboratory, California Institute of Technology, under contract with the National Aeronautics and Space Administration.References
- (1) Begelman, M.C., McKee, C.F., Shields, G.A., 1983, 271, 70
- (2) Bianchi, S., et al., 2001, A&A, 376, 77
- (3) Bohlin, R.C., Savage, B.D., Drake, J.F., 1978, ApJ, 224, 132
- (4) Boller, T, 2004, PThPS, 155, 223
- (5) Brandt, W.N., Mathur, S., Elvis, M., 1997, MNRAS, 285, L25
- (6) Chiang, J., 2002, ApJ, 572, 79
- (7) Collin-Souffrin, S., 1991, A&A, 249, 344
- (8) Collin, S., Kawaguchi, T., Peterson, B.M., Vestergaard, M., 2006, A&A, 456, 75
- (9) Collinge, M. J., Brandt, W. N., Kaspi, S., et al. 2001, ApJ, 557, 2
- (10) Collier, S. J., et al. 1998, ApJ, 500, 162
- (11) Constantin, A., Shields, J.C., 2003, PASP, 115, 592
- (12) Courvoisier, T.J., Clavel, J., 1991, A&A, 248, 389
- (13) Crummy, J., Fabian, A.C., Gallo, L., Ross, R.R., 2006, MNRAS, 365, 1067
- (14) Czerny, B., Elvis, M., 1987, ApJ, 321, 305
- (15) Czerny, B., Li, J., Loska, Z., Szczerba, R., 2004, MNRAS, 348, L54
- (16) Czerny, B., Nikolajuk, M., Różańska, A., Dumont, A.-M., Loska, Z, Życki, P.T., 2003, A&A, 412, 317
- (17) Doroshenko, V.T., Sergeev, S.G., Merkulova, N.I., Sergeeva, E.A., Golubinsky, Yu.V., 2005, A&A, 437, 87
- (18) Edelson, R.A., Malkan, M.A., 1986, ApJ, 308, 59
- (19) Fabian, A.C. et al., 2002, MNRAS, 331, L35
- (20) Fabian, A.C. et al., 2004, MNRAS, 353, 1071
- (21) Gondoin, P., Orr, A., Lumb, D., Santos-Lleo, M., 2002, A&A, 388, 74
- (22) Hubeny, I., Blaes, O., Krolik, J.H., Agol, E., 2001, ApJ, 559, 680
- (23) Janiuk, A., Czerny, B., Madejski, G.M., 2001, ApJ, 557, 408
- (24) Kassebaum, T.M., Peterson, B.M., Wanders, I., Pogge, R.W., Bertram, R., Wagner, R.M., 1997, ApJ, 475, 106
- (25) King, A.R., Pounds, K.A., 2003, MNRAS, 345, 657
- (26) Klimek, E.S., Gaskell, C.M., Hedrick, C.H., 2004, ApJ, 609, 69
- (27) Kong, M.-Z., Wu, X.-B., Han, J.-L., Mao, Y.-F., 2004, ChJAA, 4, 518
- (28) Koratkar, A., Blaes, O., 1999, PASP, 111, 1
- (29) Krolik, J.H., et al., 1991, ApJ, 371, 541
- (30) Kuraszkiewicz, J., Wilkes, B., Czerny, B., Mathur, S., 2000, ApJ, 542, 692
- (31) Kurpiewski A., Kuraszkiewicz, J., Czerny, B., 1997, MNRAS, 285, 725
- (32) Laor, A., Fiore, F., Elvis, M., Wilkes, B.J., McDowell, J.C., 1997, ApJ, 477, 93
- (33) Leighly, K.M. 1999, ApJS, 125, 317
- (34) Longinotti, A.L., Cappi, M., Nandra, K., Dadina, M., Pellegrini, S., 2003, A&A, 410, 471
- (35) Longinotti, A.L., Sim, S., Nandra, K., Cappi, M., 2006, astro-ph/0609414
- (36) Loska, Z., Czerny, B., Szczerba, R., 2004, MNRAS, 355, 1080
- (37) Madej, J., Różańska, A., 2000, A&A, 363, 1055
- (38) McAlary, C.W., McLaren, R.A., McGonegal, R.J., Maza, J., 1983, ApJS, 52, 341
- (39) Murray S.D., Castor, J.I., Klein, L.I., McKee, C.F., 1994, ApJ, 435, 631
- (40) Nandra, K., Pounds, K.A. 1994, MNRAS, 268, 405
- (41) Oknyanskij, V. L., Horne, K., Lyuty, V. M., Sadakane, K., Honda, S., & Tanabe, S. 2003, in ASP Conf. Ser. 290, Active Galactic Nuclei: From Central Engine to Host Galaxy, ed. S. Collin, F. Combes, & I. Shlosman (San Francisco: ASP), 119
- (42) Ostriker, E.C., McKee, C.F., Klein, R.I., 1991, ApJ, 377, 593
- (43) Peterson, B.M. et al., 1998, ApJ, 501, 82
- (44) Peterson, B.M. et al., 2004, ApJ, 613, 682
- (45) Pounds, K.A., Stanger, V.J., Turner, T.J., King, A.R., Czerny, B., 1987, MNRAS, 224, 443
- (46) Pounds, K. A., Reeves, J. N., King, A. R., Page, K. L., O’Brien, P. T., Turner, M. J. L. 2003, MNRAS, 345, 705
- (47) Puchnarewicz, E.M., et al., 2001, ApJ, 550, 644
- (48) Reeves, J. N., Nandra, K., George, I. M., Pounds, K. A., Turner, T. J., Yaqoob, T. 2004, ApJ, 602, 648
- (49) Reynolds, C.S., 1997, MNRAS, 286, 513
- (50) Rokaki, E., Collin-Souffrin, S., Magnan, C., 1993, A&A, 272, 8
- (51) Romano, P. et al., 2004, ApJ, 602, 635
- (52) Różańska, A., Czerny, B., Dumont, A.-M., Collin, S., Siemiginowska, A. 2004, ApJ, 600, 96
- (53) Ross, R. R., Fabian, A. C., Mineshige, S.,1992, MNRAS, 258, 189
- (54) Sergeev, S.G., Doroshenko, V.T., Golubinsky, Yu.V. et al., 2005, ApJ, 622, 129
- (55) Siemiginowska, A., Czerny B., 1989, MNRAS, 239, 289
- (56) Shakura, N.I., Sunyaev, R.A., 1973, A&A, 24, 337
- (57) Shang, Z. et al., 2005, ApJ, 619, 41
- (58) Spinoglio, L., Malkan, M.A., Carrasco, L., Recillas-Cruz, E., 1995, ApJ, 453, 616
- (59) Sun, W.-H. et al., 1994, IAU Symposium no. 159, 408
- (60) Sun, W.-H., Malkan, M.A., 1989, ApJ, 346, 68
- (61) Tao, J., Qian, B., Fan, J., 2004, PASP, 116, 634
- (62) Tanaka Y. et al., 1995, Nature, 375, 659
- (63) Tripp, T. M., Bechtold, J., Green, R. F., 1994, ApJ, 433, 533
- (64) Turner, A. K., Fabian, A. C., Lee, J. C., Vaughan, S. 2004, MNRAS, 353, 319
- (65) Turner, T.J., Pounds, K.A., 1988, MNRAS, 232, 463
- (66) Turner, T.J., George, I.M., Mushotzky, R.F. 1993, ApJ, 412, 72
- (67) Veron-Cetty, M.-P., Veron, P., Goncalves, A.C., 2001, A&A, 372, 730
- (68) Wang, T., Brinkmann, W., Bergeron, J., 1996, A&A, 309, 81
- (69) Woods, D.T., Klein, R.I., Castor, J.I., McKee, C. F., Bell, J.B. 1996, ApJ, 461, 767
- (70) Yaqoob, T., Reeves, J.N., Markowitz, A., Serlemitsos, P.J., Padmanabhan, U., 2005, ApJ, 627, 156
- (71) Yaqoob, T. et al., 2001, ApJ, 546, 759
- (72) Yaqoob, T., Padmanabhan, U., 2004, ApJ, 604, 63
- (73) Zheng, W., Kriss, G.A., Telfer, R.C., Grimes, J.P., Davidsen, A.F., 1997, ApJ, 475, 469
- (74) Zheng, W. et al., 1995, ApJ, 444, 632