On the hydrodynamics of the matter reinserted within superstellar clusters
Abstract
We present semi-analytical and numerical models, accounting for the impact of radiative cooling on the hydrodynamics of the matter reinserted as strong stellar winds and supernovae within the volume occupied by young, massive and compact superstellar clusters. First of all we corroborate the location of the threshold line in the mechanical energy input rate vs the cluster size plane, found by Silich et al. (2004). Such a line separates clusters able to drive a quasi-adiabatic or a strongly radiative wind from clusters in which catastrophic cooling occurs within the star cluster volume. Then we show that the latter, clusters above the threshold line, undergo a bimodal behavior in which the central densest zones cool rapidly and accumulate the injected matter to eventually feed further generations of star formation, while the outer zones are still able to drive a stationary wind. The results are presented into a series of universal dimensionless diagrams from which one can infer: the size of the two zones, the fraction of the deposited mass that goes into each of them and the luminosity of the resultant winds, for clusters of all sizes and energy input rates, regardless the assumed adiabatic terminal speed ().
1 Introduction
Upon the formation of a massive and compact superstellar cluster (SSC) the continuous amount of energy deposited by the massive sources, through winds and supernova explosions (SN), causes a large overpressure. This results from an efficient thermalization of the deposited kinetic energy through their random collisions. In the adiabatic solution of Chevalier Clegg (1985; see also the recent numerical calculations of Canto et al. 2000; Raga et al. 2001 and of Rockefeller et al. 2004, 2005) the overpressure leads to an almost uniform temperature and density distribution within the star cluster volume causing however a slight pressure gradient that allows the gas velocity to grow from zero km s-1 at the center to the sound speed () at the cluster edge (). The hot gas then freely streams to conform a stationary wind in which the mass input rate equals the amount of matter leaving the cluster (), and the density (), temperature () and pressure () rapidly approach their asymptotic trends (, and ) while the velocity approaches its terminal speed ; where is the energy deposition rate.
More recently it has been shown that the winds produced by massive and compact clusters rather than behaving adiabatically they become strongly radiative (see Silich et al. 2003, 2004). Radiative cooling hardly affects the density and velocity distributions however it causes the temperature to plummet to K at short distances from the star cluster boundary. This diminishes drastically the sizes of the associated X-ray envelopes predicted by the adiabatic solution. We have also shown that in the vs plane there is a threshold line above which radiative cooling becomes catastrophic within the star cluster volume and this inhibits the development of a stationary wind (see Silich et al. 2004). For these cases two solutions were proposed (see Tenorio-Tagle et al. 2005a, b). Both of them depart from the fact that as matter cannot leave the cluster it would have to accumulate within the SSC volume. One of the solutions assumes that photoionization keeps the temperature K and in the absence of gravity accumulation would follow until and a dense isothermal wind can develop. The speed achieved in these winds is several times the sound velocity (), however smaller than the escape speed for compact and massive clusters (). Thus the true physical stationary solution for clusters above the threshold line appears when matter accumulation is balanced by gravitational instabilities which lead to further stellar generations and thus to positive feedback within the star cluster volume, when matter reinserted by massive stars is driven into star formation.
The location of the threshold line has also been shown to be a strong function of the metalicity of the matter reinserted by winds and supernovae (Tenorio-Tagle et al 2005b) as this strongly enhances the cooling rate. It depends also on the heating efficiency (see Silich et al. 2006), or the amount of energy that after full thermalization of the ejecta is not immediately radiated away, as in the case of close neighboring sources, and thus it can be evenly spread within the star cluster volume, causing the central overpressure (Stevens Hartwell 2003, Melioli & de Gouveia Dal Pino 2004).
Here in section 2 we confirm, through an independent code, the location of the threshold line and then show that this is in fact not the whole story. Clusters above the threshold line are here shown to undergo a bimodal behavior in which radiative cooling leads to mass accumulation and further star formation in their central densest regions while the outer zones are still able to drive a stationary wind. Section 2 also evaluates the strength of the resultant winds for clusters above the threshold line as well as the expected rate of star formation within their cool interiors. Section 3 shows some of our numerical simulations. These fully confirm the results obtained through our semi-analytical code. Section 4 summarizes our results and gives our conclusions.
2 The semi-analytic approach
The hydrodynamic equations for the flow between the stagnation point () and the edge of the cluster (see Silich et al. 2004) are:
| (1) | |||
| (2) | |||
| (3) |
where are the velocity, the density and the thermal pressure of the thermalized matter, and are the mass and the energy deposition rates per unit volume, respectively, and is the cooling rate. We use the equilibrium cooling function, , for optically thin plasma whose temperature is and metallicity is obtained by Plewa (1995). In all calculations the metallicity of the plasma was assumed to be solar.
An important difference arises when one considers massive star clusters, those with a large mechanical energy input rate, which drain immediately a large fraction of the deposited energy through catastrophic cooling. This happens first within their central, densest regions and results in an immediate loss of pressure and of the outward pressure gradient. Solutions for such cases require that the stagnation point (; the point where the expansion velocity, km s-1) is shifted from the central position to a distance, , from the star cluster center. In such cases, the solution of equations (1 - 3) differs from that for low mass clusters. Indeed, in the catastrophic cooling regime with , the constant in the integral form of the mass conservation equation,
| (4) |
is not equal to zero. In this, more general case, it depends on the location of the stagnation point, , as at the stagnation point the expansion velocity is zero, . The mass conservation equation (1) is then reduced to
| (5) |
Using this equation one can replace terms and in equations (2) and (3). Taking the derivative in equation (3) and then replacing from equation (2), we obtain
| (6) | |||
| (7) |
where is the speed of sound. Note, that equations (5 - 7) become identical with equations (7 - 9) from Silich et al. (2004), if . Note also that the relation between the gas number density and the temperature at the stagnation point remains the same for all cases (see Silich et al. 2004):
| (8) |
where is the sound speed at . Equation (8) indicates that strong radiative cooling reduces the temperature at the stagnation point below the adiabatic value, , which can be derived from the same equation if one assumes that the cooling rate, .
2.1 The threshold line
For low mass clusters, the stagnation point (which presents the largest pressure within the resultant distribution) ought to be at the center and values of temperature and density of the plasma at such location may be derived through equation (8) by iterating over until the sonic point () is accommodated at the star cluster surface, , as described in Silich et al. (2004). One can then calculate the pressure at the stagnation point (the central pressure in these cases):
| (9) |
and then integrate numerically equations (5) - (7) outwards from .
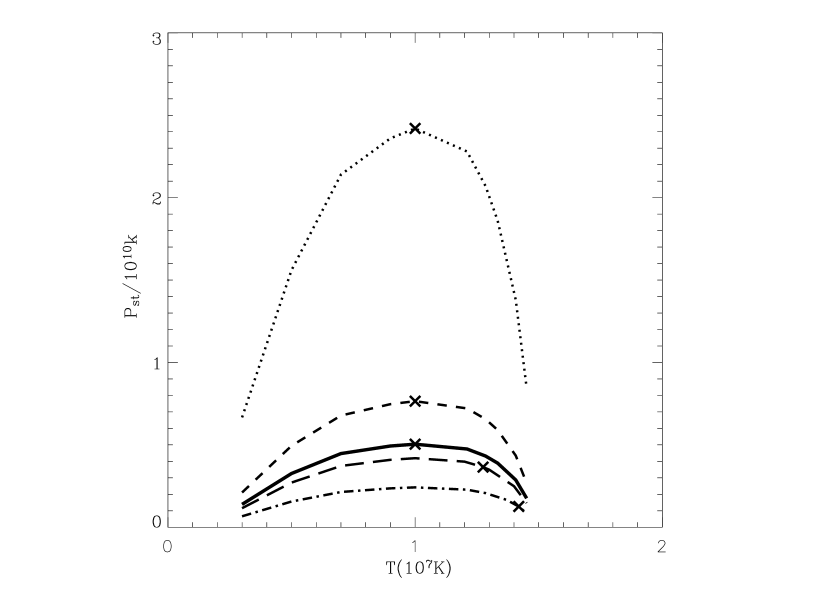
As shown in Figure 1 for a 10 pc cluster with an energy input rate equal to 1041 erg s-1 and an assumed = 1000 km s-1 (lowest curve), the pressure value at that sets the sonic point at the cluster surface, is smaller than the maximum pressure that results from all other different values of . Note however, that becomes larger for larger clusters, approaching continuously the maximum allowed pressure (see equation 9 and Figure 1). Such a behavior occurs until the power of the star cluster, , reaches the threshold value (see Figure 2). For such a cluster the pressure at the stagnation point acquires the maximum possible value from those allowed by the parameters of the cluster, (see Figure 1, solid line). This selects the temperature (see Figure 1) and the density (equation 8) at the stagnation point and equations 5 - 7 may then be solved numerically. For even larger energies, the selected has always its largest possible value and remains equal to the value acquired at the threshold line. However above the threshold line this is not sufficient to warrant the location of the sonic point at the star cluster surface and the only possibility to establish a stationary outflow arises from displacing the stagnation point from the star cluster center.
2.2 Solutions above the threshold line
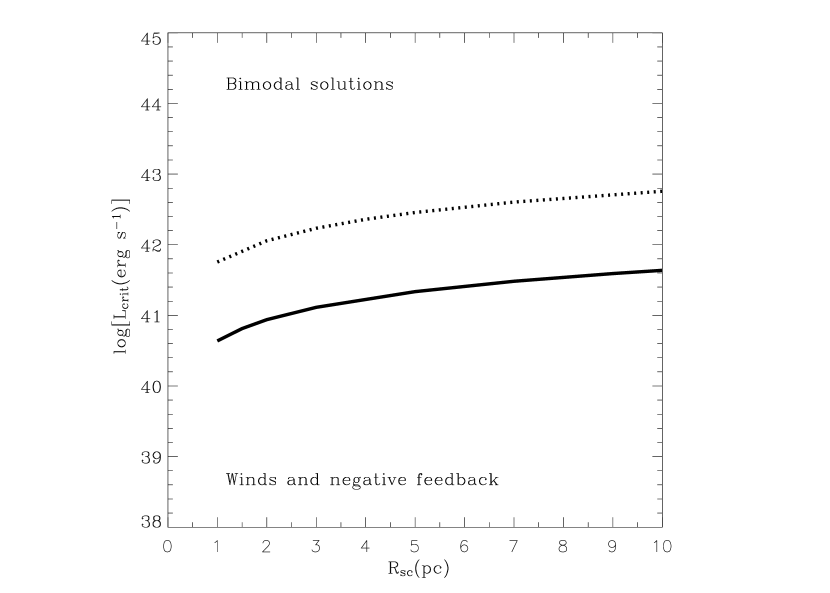
Figure 2 displays the location of the threshold limit as a function of energy and the cluster size for two different values of (1000 and 1500 km s-1). Thus for clusters at and above the threshold line the pressure as a function of the temperature at the stagnation point is to have the maximum value, , which occurs always at the same temperature for a given ratio of (see Figure 1). One can then find the parameters of the injected plasma at the stagnation point by searching through a range of temperatures (), smaller than the central temperature derived from the adiabatic solution, until the pressure at the stagnation point has its maximum possible value. Having , , and one can solve equations 5 - 7 numerically for different positions of the stagnation point. The proper value of the stagnation point radius is then selected by the condition that the sonic point lies at the star cluster surface. As shown in Figure 1, for clusters above the threshold line, this procedure selects among a broad spectrum of formal solutions, all of them valid integral curves, the unique single valued solution. This places, for a given set of star cluster parameters, at the closest possible distance to the center of the cluster.
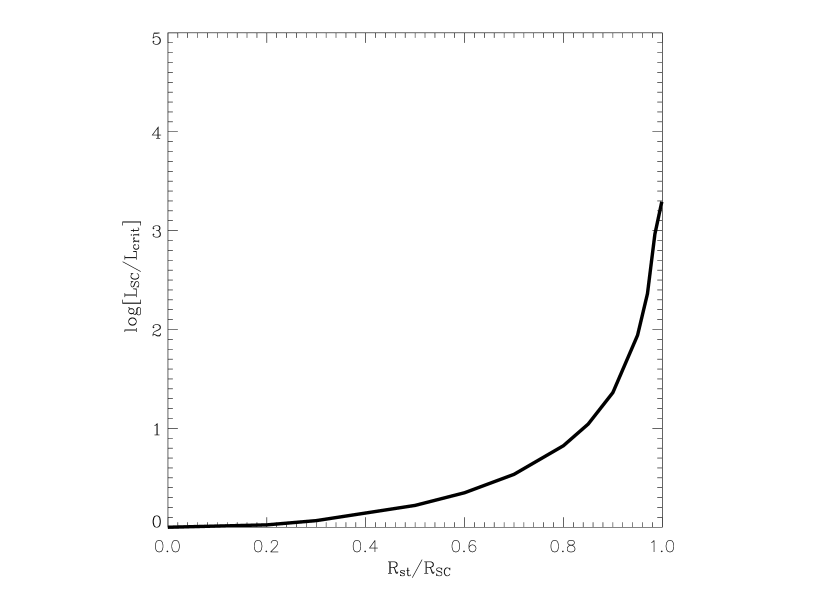
Figure 3 shows how the fractional radius () changes when the selected normalized cluster luminosity, , is larger than 1. Note that this relationship is universal for clusters of all sizes and masses if one selects the value of that corresponds to the assumed value of . The location of asymptotically approaches for increasing values, implying that the outer cluster regions are to eject the deposited matter in the form of a high velocity stationary wind even if the mechanical luminosity of the star cluster exceeds the critical value, . This implies that the isothermal wind solution discussed in Tenorio-Tagle et al. (2005a), under the assumption of matter accumulation within the whole cluster volume, is in reality inhibited by the outward expansion of the matter deposited between and the cluster surface.
2.3 The bimodal hydrodynamic behavior of clusters above the threshold line.
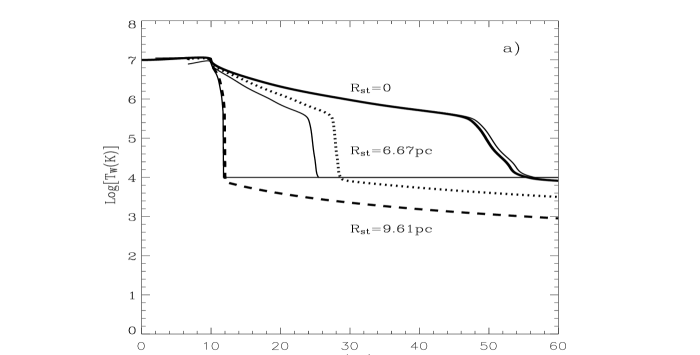
Figure 4 shows the impact of cooling on the resultant winds. The resultant density profiles are hardly affected by cooling and thus rapidly approach an distribution (see Figure 4). However, the further above the threshold line that a cluster may be, the larger the impact of cooling also on the resultant wind. The temperature profile strongly deviates from the adiabatic model predictions () already for clusters with an approaching the threshold line. For such clusters the temperature falls down and rapidly reaches K at some distance from the star cluster surface (Figure 4). The process is enhanced for clusters above the threshold line, causing the temperature to plummet down to K even closer to the cluster surface (see for example dotted and dashed lines in Figure 4).
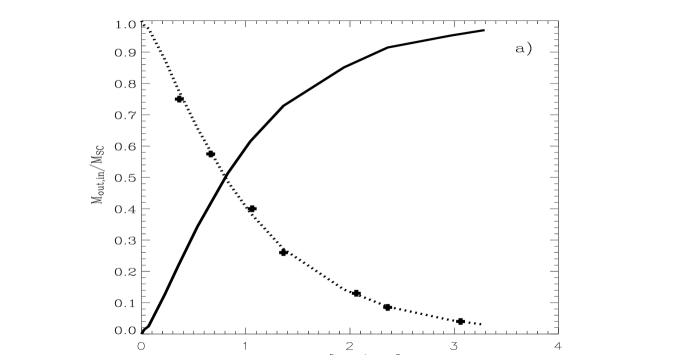
Above the threshold line the fraction of the injected matter, , that clusters return to the ISM of the host galaxy, decreases monotonically with the rate of mechanical energy (see dotted line in the upper panel of Figure 5). The rest of the injected matter, , remains bound within the stagnation radius (solid line in the upper panel of Figure 5) and thus is due to enhance its density, promoting an even faster cooling, as it accumulates. The accumulation process is so rapid that soon becomes also stationary, as becomes equal to the star formation rate (see Tenorio-Tagle et al. 2005b). Both fractions ( and ) become universal functions for all clusters if normalized to the corresponding threshold mechanical luminosity, , (see Figure 2).
At the same time, the flux of energy at the star cluster surface, , normalized in a similar way, sharply decays for clusters with increasing mechanical luminosity (Figure 5b). This implies that above the threshold line, the cluster wind carries away only a fraction of the mechanical energy deposited by supernovae and stellar winds and this is smaller than that expected from starburst synthesis models (e.g. Leitherer et al. 1999).
Such powerful clusters, with a stagnation point approaching (see section 2.2), have thus a cool interior and produce also a cool outflow, undetectable in the X-ray regime. This exposed to the UV radiation from the central cluster may be detected as a low intensity broad component in the emission spectra associated with massive, compact star clusters.


3 The numerical approach
All numerical calculations here presented are based on the finite difference hydrodynamic code ZEUS for which the cooling routine has been reimplemented to make it suitable for the modeling of extremely fast cooling regions in the wind or within the SSC volume. Further, we solve the implicit form of the energy equation using the Brent algorithm, which is faster and more stable than the original Newton-Raphson method. Finally, we include the cooling rate on the computation of the time-step. The amount of energy which can be radiated away from a given cell during one time-step must be smaller than 10% of its internal energy. The time-step is decreased to meet this cooling rate condition. However, since this could lead to extremely small time-steps, what would substantially degrade the overall code performance, we do not allow the global time-step to decrease below 0.1 times the ”hydrodynamic” time-step determined by the Courant-Friedrich-Levi criterion. In case a certian cell requires an even smaller time-step due to the cooling rate condition, we subdivide the time-step even more. Using such small enough time-sub-steps, we numerically integrate the energy equation with the source terms only in the affected cell(s). This ”time refinement” is applied only locally, so the CPU time is not wasted in cells where the high time resolution is not required.
The numerical models are in a good agreement with our semi-analytical code (see Silich et al. 2004). Figure 4 shows some examples from our many test calculations with different cluster parameters, compared with the semi-analytical results (bold face lines in Figure 4). The numerical models converge to the semi-analytical solution in runs with an increasing resolution. A higher resolution is more important in the central region, and therefore we use a scaled grid (i.e. radial size of grid cells proportional to ). Simulations on a scaled grid give results comparable to runs on an equidistant grid with twice as many cells.
The resolution convergence was tested for 200, 400, 800, and 1200 radial grid cells for erg s-1. The results show a good agreement in the whole computational domain. The largest differences appear at the radius where the temperature drops. For 200/400, 400/800, 800/1200 this region is radially shifted by 2, 0.4 and 0.1 pc. In all other simulations we use the highest resolution, 1200 grid cells.
3.1 Boundary and initial conditions
Within the star cluster volume, mass and energy per unit volume ( and ) are continously and homogeneously replenished ( and ) using the following procedure at each time-step: 1) the density and the total energy in a given cell are saved to and , 2) new mass is inserted , the velocity is corrected so that the momentum is conserved , 3) internal energy is corrected to conserve the total energy ; 4) the new energy is inserted in a form of internal energy . The computational domain extents in a range , where . An open boundary condition was applied at both ends of the computational grid, and . The initial conditions for clusters below the threshold line were derived from semi-analytical solutions. For clusters above the threshold line, a semi-analytical solution with the same and and a just below was used. This is then followed by a continuous replenishment of the appropriate and that correspond to the selected .
Here, as examples, we present three calculations for the mechanical energy input rate equals to erg s-1, erg s-1 and erg s-1. The other parameters were pc, km s-1, pc and pc. The resolution was 1200 grid cells in the radial direction.
3.2 1-D numerical simulations
Our numerical scheme is able to reproduce with great accuracy the run of density, velocity and temperature obtained with the semi-analytical method for clusters below the threshold line (see Figure 4). For clusters above the threshold line the numerical simulations become even more powerful as with such a method one is also able to calculate the flow everywhere within the cluster volume (see Figure 6) and not only in the region exterior to the stagnation point (as with the semi-analytical method, see section 2). Here, as examples, we present three calculations for which = 10 pc and the mechanical energy input rate equals erg s-1, erg s-1 and erg s-1. Figure 4 displays the large-scale flow and Figure 6 (pressure and velocity plots) provide details within the star cluster volume.
The lowest energy case (close to the threshold line) clearly shows the stagnation point at the cluster center, there where the pressure is largest, and the sonic point at the cluster surface (see Figure 6 upper left panel). For clusters above the threshold line (see upper right and lower panels in Figure 6), the central regions of the cluster volume cool rapidly down to K. This causes the highly non-stationary behavior of the flow there, with a number of the radiative shocks and cooling fronts passing through the inward moving material (see Figure 6). This results in multiple local density enhancements. Some of these may acquire positive velocities and move pass the stagnation point and perturb the quasi-stationary region between and . These perturbations are also visible in the outer parts of the wind (see Figure 4, panel b). Nevertheless, the free wind region, , remains quasi-stationary and its inner structure is found to be in good agreement with that predicted in the semi-analytical calculations (see Figure 4).
Thus the numerical calculations, in agreement with the semi-analytical results, basically confirm the bimodal behavior for clusters above the threshold line. For such clusters, the outer region with presents a positive increasing velocity, while in the cold interior, with , the velocity may present a complicated time dependent profile associated to the passage of rapid cooling fronts over the stagnant matter. The mass inserted into the outer region leaves the cluster as a stationary wind, while the mass inserted into the cold inner zone partly accumulates there, partly flows into the center through the inner boundary, or partly enters the region outside the and perturbs the wind at (see Figures 4 and 6). For the largest mechanical energy input rate, multiple high density and low temperature shells form within the volume defined by the stagnation point, . These result from a rapid mass inflow from both their sides, which makes them grow in mass as likely seeds for further star formation.
4 Conclusions
We have presented here semi-analytical and numerical simulation of the hydrodynamics undertaken by the matter reinserted via winds and supernovae by the sources evolving within the volume occupied by a superstellar cluster. All of these calculations are based on the assumptions made originally in the adiabatic solution of Chevalier & Clegg (1985) regarding an even spacing between sources, a full conversion of the kinetic energy injected within the star cluster volume into thermal energy and a smooth distribution of the injected material. These assumptions lead to a gas with a sound speed at the cluster edge much larger than the escape speed, even in the case of very massive and compact clusters, and thus gravitational effects have been ignored by all workers in the field.
Our results, that cover the full parameter space in the mechanical energy deposition rate (or mass of the SSC) vs the cluster size ( vs ) plane, account for radiative cooling. We have confirmed with 1D numerical simulations the location of the threshold line on the vs plane (see Silich et al. 2004). Solutions far below the threshold line lead to quasi-adiabatic stationary winds, while more massive clusters, approaching the threshold line, produce stationary strongly radiative winds for which their temperature departs from the adiabatic solution and drops to 104 K close to the star cluster surface. In all of these cases the stagnation point remains at the cluster center and the sonic point is at the cluster edge. The iteration over temperature then defines the appropriate initial conditions and allows to integrate the basic equations numerically.
The main focus of this paper however has been on the solution for clusters above the threshold line and our results superseed some of our previous findings. In particular, the possibility of an isothermal wind, or supernebula, calculated in Tenorio-Tagle et al. (2005a) under the assumption of mass accumulation everywhere within the star cluster volume, has here been shown to be not possible. SSCs above the threshold line lead instead to an intrinsic bimodal behavior: Their densest inner regions do cool immediately, depleting the pressure and outward pressure gradient required to drive an outflow, while their outer zones manage, in all cases, to compensate radiative cooling with the energy input rate and thus remain hot and able to establish a stationary wind. In all of these cases the fraction of the cluster volume that cools down and enters a phase of matter accumulation and further star formation, as well as the fraction that drives a stationary wind, is decided by the location adopted by the stagnation point.
The value of is the minimum radius above which the stationary solution exists. Within cooling forms low pressure regions into which the inserted mass flows. The flow can be either oscillatory (medium energy case) or colliding (high energy case) forming dense shells out of mass arriving from both sides (see figure 6). In the semi-analytic approach the location of the stagnation radius within the cluster volume is uniquely defined by the appropriate corresponding to the assumed , and the star cluster mechanical luminosity, . This, at the same time, uniquely defines the amount of matter and the energy flux injected as a stationary wind as well as the amount that accumulates within the cluster inner regions and which eventually is driven into further star formation. Our diagrams (Figures 3 and 5) are thus applicable to clusters of all sizes and all possible energy input rates as long as the mechanical energy is scaled with the appropriate , corresponding to the assumed .
A further implication of clusters above the threshold line is that their mechanical energy and mass input rates into their surroundings are considerably smaller than the values predicted from synthesis models of coeval clusters. Cooling and recombination within the stagnation radius of such clusters would also reduce considerably their UV photon output.
Further calculations in two dimensions accounting for radiative cooling and also for the self-gravity of the cluster, are now underway and would be the subject of a future communication. In these calculations, thermal instabilities lead to the formation of dense clumps often surrounded by a less dense hot wind. Preliminary results indicate that some of these clumps are accelerated and even ejected from the cluster. However, more calculations are required in order to estimate the net amount of outflowing matter. A detailed comparison of our models with multi-wavelength observations will also be the subject of a forthcoming communication.
References
- (1) Cantó, J., Raga, A.C. & Rodríguez, L.F. 2000, ApJ, 536, 896
- (2) Chevalier, R. A. & Clegg, A. W., 1985, Nature, 317, 44
- (3) Leitherer, C., Schaerer, D., Goldader, J.D. et al. 1999, ApJS, 123, 3
- (4) Melioli, C. & de Gouveia Dal Pino E.M. 2004, A&A, 424, 817
- (5) Plewa, T. 1995, MNRAS, 275, 143
- (6) Raga, A.C., Velázquez, P.F., Cantó, J., Masciadri, E. & Rodriguez, L.F. 2001, ApJ, 559, L33
- (7) Rockefeller, G., Fryer, C.L., Melia, F. & Warren, M.S. 2004 ApJ, 604, 662
- (8) Rockefeller, G., Fryer, C.L., Melia, F. & Wang, D. 2005, ApJ, 623, 171
- (9) Stevens, I.R. & Hartwell, J.M. 2003, MNRAS, 339, 280
- (10) Silich, S., Tenorio-Tagle G. & Muñoz-Tuñón, C. 2003, ApJ, 590, 796
- (11) Silich, S., Tenorio-Tagle, G., Rodríguez-González, A. 2004, ApJ, 610, 226
- (12) Silich S., Tenorio-Tagle, G., Muñoz-Tuñón, C. & Palouš, J., 2006, IAU Symposium 237 “Triggered Star Formation in a Turbulent ISM” (in press)
- (13) Tenorio-Tagle, G., Silich, S., Rodríguez-González A. & Muñoz-Tuñón, C., 2005a, ApJ, 620, 217
- (14) Tenorio-Tagle, G., Silich, S., Rodríguez-González A. & Muñoz-Tuñón, C., 2005b, ApJ, 628, L13