Lyman Break Galaxies in the VLT/FORS2 spectroscopic campaign in the GOODS-S field
Abstract
We present initial results from our ongoing campaign of spectroscopic identifications of Lyman–break galaxies (LBGs) at , 5 and 6 with FORS2 at the ESO VLT.
1INAF - Trieste Astronomical Observatory, via G.B. Tiepolo 11, 40131, Trieste, ITALY
2National Optical Astronomy Obs., P.O. Box 26732, Tucson, AZ 85726
3Space Telescope Science Institute, 3700 San Martin Drive, Baltimore, MD 21218
4ESO Garching, Karl-Scwarzschild-Strasse 2, D-85748 Garching bei München, Germany
1. Introduction
The Lyman–break selection technique (Guhathakurta et al. 1991; Steidel et al. 1996; Giavalisco 2002; Giavalisco et al. 2004) remains one of the most efficient way to build large and well controlled samples of star–forming galaxies at , suitable for a variety of statistical studies, such as luminosity function, clustering and the source of cosmic reionization. Recent panchromatic deep surveys such as the Great Observatories Origins Deep Survey (GOODS, Giavalisco et al. 2004) have made possible to extend the identification of LBGs at redshifts as high as (Dickinson et al. 2004; Bunker et al. 2004; Bouwens et al. 2006). The relative simplicity of modeling the inherent selection effects of the Lyman–break technique as a function of the galaxy properties (e.g. the dispersion of their UV SED) has also made possible to measure the evolution of key properties such as morphology, luminosity function, star–formation rate, stellar mass and AGN activity of LBGs over a broad redshift range (for an overview of the GOODS project see Renzini et al. 2002; Giavalisco & Dickinson 2003; Giavalisco et al. 2004a, and http://www.stsci.edu/science/goods/).
Here we report on preliminary results of an ongoing campaign of spectroscopic identifications of Lyman–break galaxies up to carried out in the GOODS-S field with the FORS2 spectrograph at the ESO-VLT. We have secured so far 103 identifications the redshift range 3.5-6.3 (Vanzella et al. 2005; 2006a; 2006b in prep.), currently the largest spectroscopic sample of LBGs in these redshifts. In the following the ACS F435W, F606W, F775W, and F850LP filters are denoted as , , and , and magnitudes are in AB system.
2. Photometric selection of LBGs in the GOODS-S field
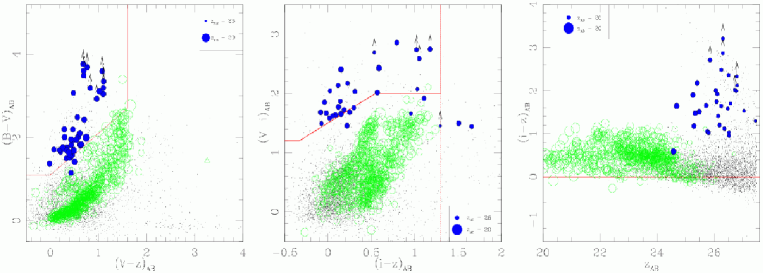
We selected the targets of our spectroscopic observations from the samples of , and –band “dropouts”, at mean redshifts , and , respectively, obtained applying the color equations by Giavalisco et al. (2004b) to the v1.0 release of the GOOODS ACS catalogs. We have also included targets in close proximity of the boundary of the selection window to test the effect of photometric scatter and measure the efficiency of the selection criteria and the contamination by lower–redshift interlopers. Figure 1 shows the color-color diagrams and the LBGs with spectroscopic identifications.
We found the success rate of the redshift identifications to be for all three categories of LBGs, and the efficiency of the selection for source with redshift is 97.6, 86.2 and 79.3 for the , and drops, respectively. In total 11 interlopers have been found, 10 of them have been confirmed to be stars and one is a galaxy at redshift 1.3 with [OII] in emission and evident Balmer break (originally selected as a -drop). The current spectroscopic completeness of our , and –band dropout samples is , 14, 30 down to =26.5.
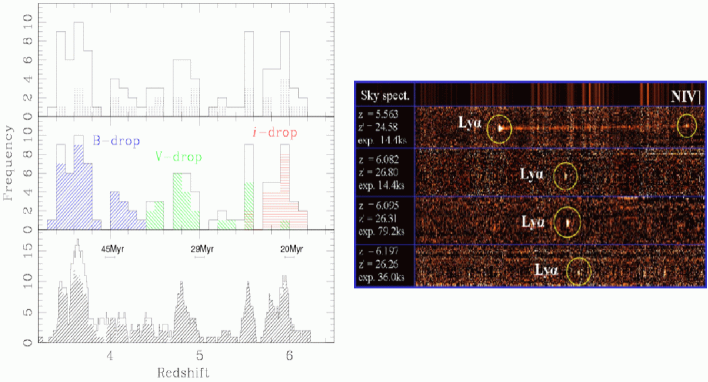
Figure 2 (left) shows the redshift distribution of the current samples LBGs. There is some overlap around redshift 4.5 between the and –band dropout samples and at 5.5 between the and –band ones. The observed average and standard deviation of the , and –band sample redshift distributions, as well as their shape, are in general good agreement with the predicted ones computed according to the method outlined by Giavalisco et al. (2004b). The Figure 2 (left, lower panel) shows the redshift distribution calculated in finer redshift bins, , with the overdensity at noted by Malhotra et al. (2005) clearly visible.
3. Spectroscopic properties of LBGs in the GOODS-S field
The quality of the spectra in our three samples varies, depending on the luminosity and redshift of the sources; however, trends are easily recognized, which show a close similarity of properties with LBGs observed at (Shapley et al. 2003). The typical rest–frame UV features observed are the HI Ly line, seen either in emission, absorption, or a combination of both; low-ionization resonance interstellar metal lines such as SiII 1260, OI1302 + SiII 1304, C II 1334, SiII 1526. FeII 1608, and AlII 1670, which are associated with the neutral interstellar medium, and high-ionization metal lines such as Si IV 1393,1402 and C IV 1548,1550 associated with ionized interstellar gas an P-Cygni stellar wind features.
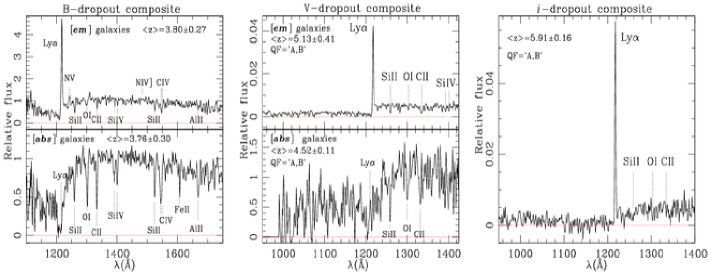
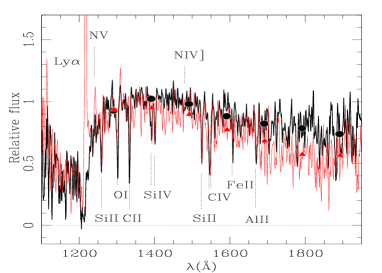
Figure 3 shows composite spectra of the three samples of LBGs. For and –band dropouts spectra with the Ly line in emission (“emitters”) and absorption (“absorbers”) were stacked separately. The sample of spectroscopically identified –band dropouts, and hence the composite spectrum, only includes “emitters”, since the current sensitivity precludes spectroscopic identifications from absorption features in such faint candidates. Figure 4 (left) compares the stacked spectra of –band dropout absorbers and emitters, showing that the former have a systematically redder UV continuum and stronger interstellar absorption lines than the latter, a fact also observed in lower–redshift samples at (Shapley et al. 2003).
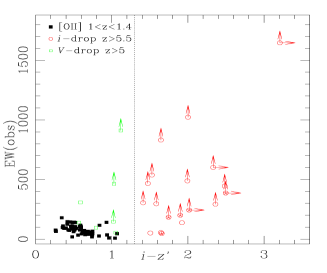
Most (but not all) –band dropouts identifications are based on one emission line only (see right panel of Figure 2 as an example), which we intepret as Ly, because of the line’s asymmetric profile, which we observe every time the S/N ratio is sufficient. This is clearly visible in the stacked spectrum in Figure 3, together with the sharp discontinuity of the continuum at the wavelength of the feature, showing that the stacked spectrum is indeed dominated by galaxies at . To further investigate the possibility that low–redshift interlopers, such as galaxies with [OII] emission at 1.1–1.4, might contaminate the sample, we have compared the observed equivalent width and (-) color of the –band dropout spectroscopic samples with that of [OII] galaxies independently confirmed at . Figure 4 (right) shows that the real [OII] galaxies are too blue and the equivalent width of the [OII] emission line is too small compared to the same quantities of the –band dropouts, for a significant contamination to be present.
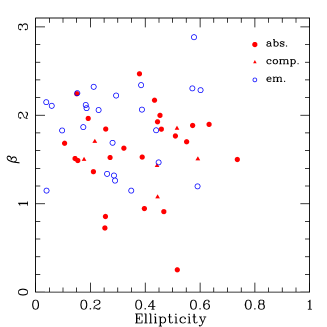
The right panel of Figure 5 plots the UV spectral index () measured in the rest–frame 1500–1800 Å from the - color versus the ellipticity of the rest–frame UV morphology for both “emitters” (blue) and “absorbers” (red) of the –band dropout sample. No correlation is observed between these quantitites for either spectral “types” (suggesting that optically thick disks are not predominant in the sample), but we find that the median of the emitters, , is larger than that of the absorbers, , in agreement with the comparison of the stacked spectra. This is probably evidence that “emitters” are on average younger and/or less dust–obscured than “absorbers”.
We also observe a velocity offset between the Ly and the interstellar absorption lines, in the sense that the Ly is more redshifted than the ISM by a velocity difference () 300 and 400 km/sec for the and –band dropouts, respectively. This is in quantitative agreement with what reported at lower redshifts (e.g. Shapley et al. 2003), suggesting a similarity in the energetics of large–scale gas outflows.
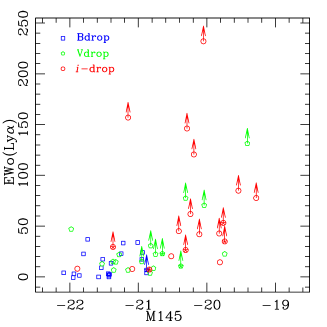
Figure 5 (left) shows the rest–frame equivalent width the Ly emission line of the three dropout samples as a function of the continuum luminosity density at Å. Value range from a few Å up to Å, although for faint sources at z5 we only measure lower limits. The fact that large equivalent widths are observed only among the fainter and more distant galaxies is an obvious selection effect; however, there clearly is a deficiency of strong Ly emission lines among the brightest and closest ones. A similar trend has also been observed by Ando et al. (2006) in a mixed sample of LBGs and Ly emitters as redshift . This may be evidence of different formation history and/or of ISM properties in bright and faint galaxies.
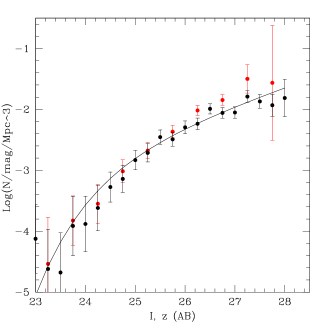
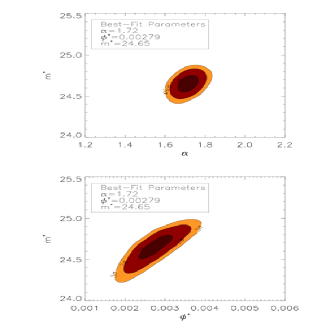
In Figure 6 we also show the luminosity function of –band dropouts from the two GOODS fields (black dots) and COSMOS (red dots) together with the GOODS best–fit Schechter function and the uncertainties of its parameters from a series of upcoming papers (Vanzella et al.; Giavalisco et al.; Lee et al. in prep.). The corresponding rest–frame Å absolute magnitude is . A similar measure from the –band dropout samples yields Mpc-3, and . Finally, from samples of –band dropouts extracted from GOODS and the UDF, Bouwens et al. (2006) report Mpc-3, and , suggesting that the evolution of the UV luminosity function of LBGs over the redshift range is characterized by a relatively constant value of the faint end slope and volume density , together with a gradual dimming of the characteristic luminosity by mag.
Acknowledgments.
E.V. acknowledge financial contribution from contract ASI–INAF I/023/05/0.
References
- Ando et al. (2006) Ando, M., Ohta, K., Iwata, I., 2006, ApJ, 645, 9
- (2) Bouwens, R.,J., Illingworth, G.,D., Blakeslee, et al., ApJ, in press (astro-ph/0509641)
- Dickinson et al. (2004) Dickinson, M., Stern, D., Giavalisco, M., Ferguson, H. C., et al., 2004, ApJ, 600, 99
- Giavalisco (2002) Giavalisco, M., 2002, ARA&A, 40, 579
- Giavalisco et al. (2004a) Giavalisco, M., Ferguson, H. C., Koekemoer, A. M., et al., 2004, ApJ, 600, L93
- Giavalisco et al. (2004b) Giavalisco, M., Dickinson, M., Ferguson, H. C., 2004, ApJ, 600, 103
- Guhathakurta et al. (1990) Guhathakurta, P., Tyson, J. A., Majewski, S. R., 1990, ApJ, 357, L9
- Malhotra et al. (2005) Malhotra, S., Rhoads, J.E., Pirkal, N., et al.2005, ApJ, 626, 666
- Renzini et al. (2002) Renzini et al. 2002, in the proceedings of the ESO/USM Workshop ”The Mass of Galaxies at Low and High Redshift” (Venice, Italy, October 2001), eds. R. Bender and A. Renzini
- Shapley et al. (2003) Shapley, A.E., Steidel, C.C., Pettini, M., Adelberger, K.L., 2003, ApJ, 588, 65
- Steidel et al. (1996) Steidel, C.C., Giavalisco, M., Pettini, M., Dickinson, M., 1996, ApJ, 462, 17
- Vanzella et al. (2005) Vanzella, E., Cristiani, S., Dickinson, M., et al., 2005, A&A, 434, 53
- Vanzella et al. (2006) Vanzella, E., Cristiani, S., Dickinson, M., et al., 2006, A&A, 454, 423