Swift Gamma-Ray Burst Afterglows and the Forward-Shock Model
Abstract
The X-ray light-curves of the GRB afterglows monitored by Swift display one to four phases of power-law decay. In chronological order they are: the burst tail, the ”hump”, the standard decay, and the post jet-break decay. We compare the decay indices and spectral slopes measured during each phase with the expectations for the forward-shock model to identify the processes which may be at work and to constrain some of their properties. The large-angle emission produced during the burst, but arriving at observer later, is consistent with the GRB tail decay for less than half of bursts. Several afterglows exhibit a slow, unbroken power-law decay from burst end until 1 day, showing that the forward-shock emission is, sometimes, present from the earliest afterglow observations. In fact, the forward-shock synchrotron emission from a very narrow jet (half-angle less than ) is consistent with the decay of 75 percent of GRB tails. The forward-shock inverse-Compton emission from a narrow jet that does not expand sideways also accommodates the decay of 80 percent of GRB tails. The X-ray light-curve hump can be attributed to an increasing kinetic energy per solid angle of the forward-shock region visible to the observer. This increase could be due to the emergence of the emission from an outflow seen from a location outside its opening. However, the correlations among the hump timing, flux, and decay index expected in this model are not confirmed by observations. Thus, the increase in the forward-shock kinetic energy is more likely caused by some incoming ejecta arriving at the shock during the afterglow phase. The jet interpretation for the burst tails and the energy injection scenario for the hump lead to a double-jet outflow structure consisting of a narrow GRB jet which precedes a wider afterglow outflow of lower kinetic energy per solid angle but higher total energy.
keywords:
gamma-rays: bursts - radiation mechanisms: non-thermal - shock waves1 Introduction
The X-ray, optical and radio emission following a Gamma-Ray Burst (GRB) is thought to arise in the interaction between the GRB ejecta and the circumburst medium, which leads to a forward shock energizing the ambient medium (the ”external shock model” - e.g. Paczyński & Rhoads 1993, Mészáros & Rees 1997). This shock accelerates electrons (through first order Fermi mechanism or electric fields associated with the Weibel instability) to relativistic energies and generates magnetic fields (e.g. Medvedev & Loeb 1999). The afterglow emission is synchrotron; inverse Compton scatterings may affect the electron radiative cooling and contribute to the early X-ray afterglow emission. The progressive, power-law deceleration deceleration of the forward shock leads to a continuous softening of the afterglow synchrotron spectrum. As this spectrum is a combination of power-laws, (with the spectral slope depending on the location of the observing frequency relative to the afterglow characteristic break frequencies), it follows that the afterglow light-curve decays as a power-law, (with the decay index depending on and the evolution of the spectral characteristics).
In its simplest form, the standard forward-shock model assumes a GRB outflow with a constant energy, a uniform kinetic energy per solid angle, and constant microphysical parameters. The possibility of energy injection into the forward shock was proposed by Paczyński (1998) and Rees & Mészáros (1998). Its effect may have been observed for the first time in the rise of the optical emission of GRB afterglow 970508 at 1 d (Panaitescu, Mészáros & Rees 1998). The effect of ejecta collimation was treated by Rhoads (1999) and may have been seen for the first time in the optical light-curve of GRB afterglow 990123 (Kulkarni et al 1999). Since then, about a dozen of other optical afterglows displayed a break at around 1 day (e.g. Zeh, Klose & Kann 2006), which have been interpreted as evidence for tightly collimated outflows. A non-uniform angular distribution of ejecta kinetic energy per solid angle was proposed by Mészáros, Rees & Wijers (1998) and identified by Rossi, Lazzati & Rees (2002) as a possible origin for optical light-curve breaks.
The continuous monitoring during the first day by the Swift satellite has shown that GRB X-ray afterglows exhibit up to four decay phases (Figure 2). 10 percent of Swift afterglows exhibit a single power-law decay (), from end of burst to about 1 day. A quarter of afterglows show a steeper decay () after the burst (the ”GRB tail”), followed by a break to a slower power-law fall-off () until after 1 day. About two-thirds of afterglows exhibit an even slower decay () after the GRB tail, followed by a steeper fall-off (), creating a ”hump” in the X-ray light-curve at 1–10 ks. The X-ray light-curve of several afterglows displays a second break at day, followed by a steeper decay ().
In this work, we compare the decay indices and spectral slopes of 78 X-ray afterglows with the expectations of the forward-shock model and discuss some of the mechanisms which may be at work during the four possible afterglow phases. The existence of long-lived, power-law decaying light-curves is a natural prediction of the forward-shock model (e.g. Mészáros & Rees 1997) arising from the power-law deceleration of a relativistic blast-wave and the power-law distribution with energy of particles accelerated at shocks. The forward-shock emission depends on the outflow dynamics (determined by the blast-wave energy & collimation and medium density) and radiation emission parameters (two microphysical parameters quantifying the electron and magnetic field energies and the index of the power-law distribution of post-shock electrons with energy). It follows that the decay of the forward-shock emission depends on the evolution of the kinetic energy per solid angle of the visible part of the outflow, the ambient medium stratification, and the possible evolution of microphysical parameters.
The X-ray afterglows used here were monitored by Swift from January 2005 to the end of July 2006. Their X-ray decay indices and spectral slopes are taken from O’Brien et al (2006) and Willingale et al (2007).

2 GRB Tails
Figure 4 compares the decay indices and spectral slopes during the GRB tail with the expectations from different models. The correlation of and is statistically significant ( for 63 bursts, corresponding to a less than 0.1 percent probability of a chance correlation) and represents a natural consequence of any model in which, during the GRB tail, the spectral break frequencies of the synchrotron spectrum decrease.


One way to discriminate the possible models for this phase is the collimation of the GRB outflow. If the outflow opening is larger than , the inverse of its Lorentz factor, then the spherical forward-shock (SPH) models shown in Figure 4 can explain only the slower decaying GRB tails. For the rest, their steeper decay requires that the GRB emission mechanism switches off at the end of the burst. The steepest decay that can be obtained by a switch-off has an index (Fenimore & Sumner 1997) because any faster cessation will be overshined by the emission from the fluid moving at an angle (relative to the center–observer direction) larger than . The above decay index of this large-angle emission (LAE model – Kumar & Panaitescu 2000) is due to the photon arrival time increasing as , while the relativistic Doppler boost decreases as . The latter also induces a dependence of on , as photons of a fixed observer frequency correspond to an increasingly larger comoving frequency.
The LAE model is consistent at the level with 25 percent of the GRB tail decays shown in the left panel of Figure 4 and consistent with 40 percent of afterglows at the level, where consistency at the level between a model index and an observed is defined by being within of zero [ and are the measurement errors]. It fails to accommodate the slower-decaying tails and a few faster ones. Slower decays indicate that the burst emission does not cease sufficiently fast to reveal the large-angle emission.
Faster decays indicates that the large-angle emission does not exist, i.e. the outflow opening, , is narrower than the relativistic beaming cone, , and the GRB tail decay reflects the intrinsic dimming of the burst emission. Taking into account that the Lorentz factor of a decelerating blast-wave of isotropic-equivalent kinetic energy ergs, interacting with a WR stellar wind, is , the underlying condition implies very narrow jets, with .
The GRB tail emission could arise from internal shocks occurring in a variable outflow (Rees & Mészáros 1994) if those shocks continue to occur after the prompt emission phase. This possibility is supported by that existence of flares during many GRB tails, whose short timescale is inconsistent with a forward-shock origin (e.g. Zhang et al 2006). However, it seems very unlikely that internal shocks could account for the smooth, GRB tails lasting from 100 s to 10-100 ks, as seen for GRBs 050717, 050826, 051006, 051021B, 051117B, and 060403 (the most spectacular case is GRB 061007 – Schady et al 2007 – whose afterglow power-law decay extends over 4 decades in time, from 100 s to s).
Alternatively, the fast decay of the GRB tails could be the emission from a decelerating forward shock, with internal shock yielding only the flaring emission. As shown in the right panel of Figure 4, the synchrotron emission from a spherical outflow decays too slow to accommodate the GRB tails. Provided that the shock microphysical parameters are sufficiently small, the forward-shock inverse-Compton emission may peak at keV. Its decay is faster and, as shown in the left panel of Figure 6, is consistent within with 60 percent of GRB tails (80 percent within ). Attributing the burst emission to inverse-Compton scatterings also has the advantage that it can explain the low-energy spectra harder than the synchrotron optically-thin, emission (Panaitescu & Mészáros 2000, Stern & Poutanen 2004).
Faster decays for the forward-shock emission can be obtained if the GRB outflow is a narrow jet whose boundary is visible to the observer. We find that decay of the synchrotron emission from such a narrow jet undergoing lateral spreading is consistent with 55 percent of the bursts at the level and with 75 percent at (right panel of Figure 4). The right panel of Figure 6 shows that the decay of the forward-shock, inverse-Compton emission from a narrow, spreading jet is consistent within with 30 percent of GRB tails (60 percent within ). A better description of the GRB tail decay is obtained if the jet does not spread laterally (conical jet), the consistency percentages being 45 and 80, respectively. These models fails to explain only the slowest GRB tails, which should be attributed to the forward-shock emission from outflows wider than .
3 Slow-Decays and Humps

We assume that the microphysical parameters pertaining to the emission from the forward-shock are constant. Then the X-ray hump or slow-decay phase require an increasing kinetic energy per solid angle over the visible surface. This is illustrated in Figure 8, which shows that, for an adiabatic forward-shock, the slowest decay (obtained for a spherical outflow) is too fast to explain this phase.
There are two reasons for a non-constant kinetic energy per solid angle in that part of the blast-wave which is visible to the observer: the radial and angular distribution of energy in the GRB ejecta. In the former case, an increase of will result before all the GRB ejecta undergo deceleration due to their interaction with the circumburst medium. In the later case, the average over the region visible to the observer () changes with time as the outflow is decelerated and the observer receives emission from an ever wider part of the outflow.
3.1 Ejecta Deceleration and Energy Injection in the Forward Shock

3.1.1 Ejecta with single Lorentz factor
One possible way in which energy is injected into the forward shock is that where, after internal collisions, the relativistic ejecta move at nearly the same Lorentz factor . The transfer of kinetic energy from the cold ejecta to the circumstellar medium lasts until the reverse shock crosses the ejecta shell.
If the comoving-frame ejecta density () is larger than (where the circumburst medium density) then, during this phase, the Lorentz factor of the shocked medium is constant () and the forward-shock light-curve decay is determined only by the increasing number of radiating electrons (, with the shock radius) and the decreasing magnetic field strength () for a wind-like circumburst medium. Relating to the observer time through , the spectral characteristics of the received synchrotron emission – peak flux , peak frequency , and cooling frequency , where is the typical energy of the shock-accelerated electrons and is the energy of the electrons whose radiative cooling time equals the dynamical timescale – have the following evolutions before decelerations: , , for a homogeneous medium and , , for a wind medium (). Taking into account that, for a power-law distribution with energy above of the accelerated electrons (), the synchrotron flux at frequency is with for and with for , the X-ray light-curve decay index before deceleration is:
| (1) |
for a homogeneous medium ( means a rising light-curve) and
| (2) |
for a wind.
If then (equation 5 of Panaitescu & Kumar 2004). Assuming that the ejecta do not spread radially, . This means that for a wind-like medium () the ratio is constant and so is , i.e. equation (2) holds in this case as well. For a homogeneous medium, leads to , i.e. there shocked medium is decelerated even before the reverse shock crosses the ejecta and most energy is transferred to the forward sock. After repeating the above derivation, we find that for either location of cooling frequency, i.e. the same relation as for a wind-like medium in the case.
The pre-deceleration, rising X-ray light-curve resulting for a homogeneous medium (equation 1) can explain the brightening of the short-GRB afterglow 050724 at 10 ks (Figure 10), however long-lived brightenings are very rare. Most of the humps and all slow-decays exhibit a falling-off emission thus, if they are attributed to pre-deceleration forward shock and a single- ejecta, a wind-like circumburst medium is required. As illustrated in Figure 8, the decay of the pre-deceleration forward-shock emission resulting for a wind-like medium is consistent within with 55 percent of the humps and slow-decays indices measured by Swift and with 80 percent of them within .
If the ejecta shell is geometrically thick () then the deceleration timescale (defined as the time when the reverse shock crosses the shell) for a wind-like medium is, in the observer frame, (Panaitescu & Kumar 2004). Hence, in this pre-deceleration model for the X-ray light-curve hump, the source of relativistic ejecta would have to operate for a duration comparable to the time when the hump ends, i.e. for 1–10 ks. If the engine operates for a shorter time, then the ejecta shell is thin and constrains the ejecta Lorentz factor . For a wind-like medium, the deceleration timescale is s (equation 21 in Panaitescu & Kumar 2004, with twice larger to account for the arrival time of photons emitted by the fluid moving at angle relative to the center–observer direction), using the notation, with in cgs units. Here is the ejecta isotropic-equivalent kinetic energy and is a measure of the wind density: ( for the wind blown by a star with a mass-loss rate of and a terminal wind velocity of ). Hence, the ejecta Lorentz factor is
| (3) |
In the case of a thick shell, the Lorentz factor of equation (3) would represent a lower limit for .
Assuming that the ejecta energy is comparable to the 10 keV–1 MeV burst output (which can be calculated from the burst fluence and redshift) and that (as for a WR star), we obtain the distribution of (for which ) shown in Figure 12. The average for 25 bursts with an X-ray hump and known redshift is . We note that an error by a factor 3 in the ejecta kinetic energy or wind parameter implies an error of a third in , which is half of the dispersion of among various bursts. Thus the uncertainty of and is unlikely to change significantly the distribution shown in Figure 12.

3.1.2 Ejecta with a spread in Lorentz factor
Another variant of energy injection in the forward shock is that where, after internal interactions in the outflow, the ejecta do not move at a single Lorentz factor. Internal shocks order the ejecta Lorentz factors increasing outward, energy injection occurring after the leading edge of the outflow begins to decelerate and the inner shells start to catch up with it. The kinematics of this process is such that the arrival at the forward shock of all ejecta carrying significant energy can last much longer than the central engine lifetime. The right panel of Figure 10 illustrates how an episode of substantial energy injection into a decelerating forward shock can explain the brightening of GRB afterglow 050724.

This model for the X-ray light-curve hump is similar to that where all ejecta move at a single Lorentz factor in that, for both, the hump lasts until all ejecta undergo deceleration, but it differs in that the forward shock is decelerated during the hump, albeit its deceleration is mitigated by the energy injection. One can constrain the distribution of ejecta kinetic energy with Lorentz factor from the observed decay index and spectral slope of the X-ray hump. Assuming, for simplicity, that the cumulative ejecta energy is a power-law in the ejecta Lorentz factor, ( for a decelerating forward shock) and taking into account that, for a short-lived engine, the forward-shock Lorentz factor is proportional to that of the incoming ejecta ( for a homogeneous medium and for a wind), the condition of adiabatic dynamics for the forward shock () leads to the following dynamics: for a homogeneous medium and for a wind. Repeating the calculation of the evolutions of synchrotron spectral characteristics, one can then derive the decay index of the afterglow power-law light-curve as a function of spectral slope and injection-law parameter , from where it can be shown that the value which accommodates the observed decay index of the X-ray hump with its spectral slope is
| (4) |
for a homogeneous circumburst medium and
| (5) |
for a wind, depending on the location of the X-ray domain () relative to the cooling frequency (). Equations (1) and (2) for single- ejecta correspond to (i.e. denominators of equations 4 and 5 go to zero).
The distribution of the injection-law parameter for 45 X-ray afterglows with humps and for a homogeneous medium is shown in Figure 14. A and uncertainty of the decay index and spectral slope lead to a error, thus the dispersion of indices shown in Figure 14 is partly intrinsic and partly due to measurement uncertainties. For a wind medium, about 1/3 of X-ray humps require , i.e. an accelerating forward shock, in which case equation for observer time may not be valid and may differ from that given in equation 5. For those afterglows where (decelerating forward shock), the parameter has an even wider dispersion than for a homogeneous medium.
If the X-ray hump is due to energy injection into a decelerating forward shock, then the ensuing, faster decay of the X-ray light-curve should be attributed to a transition to a weaker energy injection (smaller ). This defines a Lorentz factor of the ejecta below which the kinetic energy should be dynamically negligible. From the kinematics of the ejecta–forward-shock catching-up and the dynamics of the latter, we find that, for a homogeneous medium,
| (6) |
where is the kinetic energy of ejecta with and is the medium particle density in . Identifying with the 10 keV–1 MeV burst output and taking , we obtain the distribution of shown in Figure 14. Given the weak dependence of on , it is unlikely that is universal and that its dispersion over 1 decade is due to variations in the circumburst density among bursts.
The beginning of the X-ray hump is hidden under the GRB tail, hence it is not well-constrained. Still, the range of the Lorentz factor of the incoming ejecta can be assessed by assuming that energy injection into the forward shock starts around the end of the burst. Substituting the burst duration in equation (14), the ejecta Lorentz factor at the end of the burst is found to be , and the spread in the ejecta Lorentz factor is . Thus, to explain the X-ray hump, the ejecta Lorentz factor (after internal shocks have ended) must vary by a factor 2–5 to yield an energy injection into the outflow leading edge that produces the X-ray light-curve hump (consistent with the findings of Granot & Kumar 2006, who used a smaller sample). The ratio of the total ejecta kinetic energy to that existing in the forward shock at the end of the burst is , which we find to be between 1.3 and 400, with most ratios ranging from 2 and 75.
For about half of the bursts with an X-ray hump, the required power-law evolution of the forward-shock energy (i.e. the index shown in Figure 14) is consistent with that resulting from absorption of the dipole electromagnetic emission of a newly-born millisecond pulsar (e.g. Dai & Lu 1998). At early times, when the gravitational and dipole radiation losses are less than the pulsar’s spin energy, its rotation frequency is constant and so is the dipole luminosity . Later, when radiation losses amount to a substantial fraction of the pulsar initial spin energy, and . Therefore, only the injection of energy through dipole radiation during the phase alters the forward-shock dynamics. The duration of this phase (Zhang & Mészáros 2001) is compatible with that of the X-ray hump. From the corresponding evolution of the blast-wave energy (), the shock adiabaticity assumption (), and the radius–time relation for a relativistic source (), it follows that the absorption of the pulsar dipole radiation leads to (for a homogeneous medium). This injection law is consistent with that inferred from equation (4) for about half of bursts; still, the injection indices shown in Figure 14 are not compatible with a universal value, as could be expected for a millisecond pulsar (see also Zhang et al 2006). Assuming that a universal existed, it should be the weighted average of the indices of Figure 14, calculated by taking into account the uncertainty of individual values: for and and for . Therefore, if were universal, the value inferred from observations of X-ray humps is not compatible with that expected for energy injection from a pulsar.
3.1.3 GRB efficiency
The ejecta which produce the X-ray hump emission and those yielding the burst may or may not be the same. If the ejecta releasing the burst are only the leading edge of the outflow then, for a spherical GRB outflow (i.e. a wide jet), the condition that the afterglow flux is not dominated by the emission from the burst ejecta (so that we see the X-ray hump) indicates that the afterglow ejecta carry more kinetic energy per solid angle than the burst ejecta. This implies that the efficiency of the GRB mechanism, defined as the ratio of the GRB output to the kinetic energy of the ejecta producing the burst, is larger than that obtained by comparing the afterglow kinetic energy with the GRB output and may be, for some bursts, implausibly large or even unphysical (above unity).
However, this issue of a high burst efficiency would not exist if the GRB outflow were a narrow jet whose angular boundary is visible after the burst because, in this case, the kinetic energy per solid angle of the burst ejecta can be (much) larger than that of the outflow ejecta (i.e. the GRB efficiency can be much less than unity) without the emission from the burst ejecta overshining that of the afterglow ejecta after the burst phase (this occurs if the kinetic energy of the narrow GRB jet is less than that of the afterglow outflow).
Thus, for spherical outflows and a plausible efficiency of the GRB mechanism, the burst and afterglow outflows should be the same. We investigate now the implications of the burst emission arising from ejecta moving at the Lorentz factors shown in Figures 12 and 14.


The burst ejecta are optically thin to electron scattering if the burst is produced at radii larger than
| (7) |
where is the GRB output and is the GRB efficiency (normalized to 10 percent). For this emission radius, photons from the visible region arrive at the observer over a time
| (8) |
for . Then, to explain the variability timescale of Swift bursts, which is times smaller than the above , the burst emission should be confined to regions of angular extent smaller by a factor than the visible region (the ”patchy shell” model of Kumar & Piran 2000). To obtain a burst with a high variability, the number of such emitting regions cannot be much larger than , hence the emitting patches cover a fraction of order (Sari & Piran 1997). This means that the condition for optical thinness to electron scattering sets an upper limit of 1–10 percent for the GRB efficiency, a value consistent with those determined by Granot et al (2006) and Zhang et al (2007) for Swift bursts from the burst and afterglow energetics.
Pair-formation may alter the GRB spectrum if this spectrum extends above the threshold photon-energy MeV. Assuming that the GRB spectrum is a power-law ( with ) up to energies well above , it can be shown that a photon of energy escapes if the GRB emission radius is larger than with
| (9) |
for , being the peak energy of the burst spectrum. For , the condition that the formed pairs are not optically thick to the burst emission (e.g. Lithwick & Sari 2001) leads to a low limit on the emission radius which is 4.4 times larger than .
Taking into account that , it follows that, depending on the burst spectrum, the condition of optical thinness to pair-formation may set a low limit on the GRB source radius higher than that resulting from the condition of optical thinness to scattering by the original electron ejecta (equation 7). This may lower too much the GRB efficiency, indicating that the underlying assumption of the burst and afterglow ejecta being the same is wrong and that the burst outflow should be a narrow jet of a kinetic energy per solid angle larger than that of the afterglow outflow.
3.2 Offset Outflows
The X-ray light-curve hump or slow-decay could also arise from a jet whose opening is less that the offset between the jet axis and the center–observer direction (Eichler & Granot 2006), as illustrated in the left panel of Figure 16. The emission from this afterglow is beamed toward the observer when its Lorentz factor has decreased below , so that its emission is beamed into cone which includes the direction toward the observer. Evidently, this model also requires the existence of an outflow moving toward the observer, which produces the GRB emission. This dual-jet model can explain the apparent high GRB efficiency provided that the kinetic energy per solid angle in the GRB jet is larger than in the afterglow outflow.
The emergence of the emission from the afterglow outflow has some specific properties, illustrated in the right panel of Figure 16: as the offset angle increases, the light-curve hump should be seen later, should be dimmer, and should exhibit a slower decay. Therefore, X-ray light-curve humps arising from jets seen initial off their aperture should exhibit a emergence epoch–decay index () anticorrelation and a brightness–decay index () correlation. The left panels of Figure 18 show that the former anticorrelation is not confirmed with a set of 32 bursts whose X-ray hump parameters are well-determined, while the latter correlation may be true, although it is not manifested at a statistically significant level. Given that and are dependent on the burst redshift, it is possible that the scatter in redshift weakens or completely hides the intrinsic correlations among the luminosity (), source-frame emergence epoch (, and decay index () expected in this model. However, as shown in the right panels of Figure 18, restricting the analysis to afterglows with known redshift still does not provide observational evidence for the expected correlations.

4 Chromatic and Achromatic X-ray Humps

If the X-ray hump originates from a long-lived episode of energy injection into the forward shock then the change in the dynamics of this shock at the end of energy injection should yield a hump at other wavelengths as well, i.e. the X-ray light-curve break should be achromatic. As shown in figure 1 of Panaitescu et al (2006b), this expectation is not confirmed by GRB afterglows 050401 and 050802, whose power-law optical decays do not steepen at the epoch of the X-ray break (around 10 ks) but continue unchanged for another 1–2 decades in time. The same figure shows that the optical light-curve of GRB 050922C breaks at 1 h while the X-ray data suggest an earlier break epoch. GRB afterglows 050319, 050607, and 050713A are also potential cases of chromatic X-ray breaks occurring at 1–10 h, although the post-break optical coverage is too limited to draw a strong conclusion.
Figure 20 shows three GRB afterglows with simultaneous optical and X-ray breaks. For all three, the pre-break optical and X-ray decay indices are comparable, indicating that the cooling frequency is not between optical and X-ray. The post-break decay indices are equal for GRB 050416A, differ by for GRB 051109A (which indicates a homogeneous ambient medium and being between optical and X-ray), and by for GRB 050730. Thus, cessation of energy injection may be compatible with the achromatic breaks seen in GRB afterglows 050416 and 051109A, but cannot account alone for the discrepancy between the optical and X-ray post-break decay indices of GRB 050730. That for this burst indicates that its post-break X-ray decay is at the limit of the steepest decay allowed for a spherical outflow, that of the large-angle emission (released prior to the break), implying that, after the break, the forward shock does not accelerate electrons to sufficiently high energies to radiate in the X-ray (although consistent with being a jet-break, this interpretation is not compatible with the significantly slower post-break decay seen in the optical).
Therefore, there is observational evidence for both chromatic and achromatic breaks at the end of the X-ray hump. As chromatic breaks cannot arise from the cessation of energy injection in the forward shock, their existence suggests that either this scenario is incomplete or that optical and X-ray emission can have, sometimes, different origins.
The afterglow optical and X-ray continua are often compatible with a single spectral component (after allowing for the cooling frequency to be in between), which suggests a common mechanism for the optical and X-ray emissions. Then, the decoupling of the X-ray and optical light-curves displayed by the afterglows with chromatic X-ray breaks must be attributed to the existence of a spectral break between optical and X-ray. The spectral break could be the cooling frequency , however, for the forward-shock emission to produce a chromatic X-ray break, the evolution of must be non-standard, which in turn requires that microphysical parameters evolve. The least contrived scenario is that where the X-ray hump is due to an episode of energy injection and the evolutions of the micro-parameters is such that they ”iron out” the optical light-curve break that cessation of energy injection would otherwise produce. Interestingly, to accommodate the pre and post-break optical and X-ray decay indices, this model requires a wind-like stratification of the circumburst medium (Panaitescu et al 2006b).
Genet, Daigne & Mochkovitch (2007) and Uhm & Beloborodov (2007) maintain the assumption that the optical and X-ray afterglows arise from the same mechanism, which they propose to be the reverse shock crossing the incoming ejecta, and attribute the decoupling of the optical and X-ray light-curves to the non-standard (i.e. non power-law) distribution of the ejecta electrons with energy that results from the continuous injection of fresh electrons and their cooling. To accommodate the observed X-ray fluxes, Genet et al (2007) indicate the acceleration of electrons at the reverse shock must be such that only a small fraction (around 1 percent) of electrons acquire a large fraction of the dissipated energy.
Chromatic X-ray breaks may also indicate that the X-ray and optical emissions arise from different mechanisms. In this venue, Ghisellini et al (2007) propose that the X-ray hump is emission from internal shocks, with the optical being dominated by forward-shock emission. This model is more likely to be at work in those X-ray humps that exhibit substantial variability, such as the GRB afterglow 050904 (Watson et al 2006, Cusumano et al 2007).
For the remainder of this article, we return to the forward-shock as the origin for the X-ray and optical afterglow emissions and assume that its microphysical parameters do not evolve.
5 Standard Decays
If we allow for any location of the cooling frequency relative to the X-ray and any of the two possible stratifications of the circumburst medium, the SPH model (outflow of constant kinetic energy per solid angle, whose Lorentz factor is still sufficiently large that the outflow boundary is not yet visible to the observer, and with constant microphysical parameters) is consistent at with 70 percent of the standard decays and with 85 percent at (Figure 22). The SPH1 model (cooling frequency below X-ray) is consistent at with 60 percent of the observed decays therefore, for these afterglows, the stratification of the circumburst medium is not constrained.
Despite the correlation between and expected in any variant of the SPH model, the observed decay indices and spectral slope do not display such a correlation: . If the post-hump X-ray emission arises indeed from the forward shock, then this lack of a correlation must be attributed to the scatter in the decay index for same spectral slope caused by X-ray being either below or above the cooling frequency and, perhaps, by the circumburst medium having both possible radial structures.

The decay index expected for the SPH model is consistent at with 75 percent of the long-lived slow-decay afterglows, which are shown in Figure 8 with dotted error bars. Still, that more than half of these afterglows lie below the slowest decay obtained with the SPH model indicates that the mechanism which reduces the decay of their X-ray emission (perhaps the energy injection into the forward shock discussed in the previous section) operates until the last measurement. The average decay of the slow-decay afterglows () is faster than that of the afterglows with a hump during the hump (, Figure 8) and slower than after the hump ( for the afterglows of Figure 22). Thus the difference between the slow-decay and hump afterglows is that, for the former type, the mechanism that mitigates the decay of the X-ray emission lasts longer and has a weaker effect than for the latter class.
6 Jet-Breaks

The decay of the light-curves of at least half of the well-monitored pre-Swift optical afterglows exhibited a steepening at 1 day, which can be interpreted as jet-break. In a sample of 78 X-ray afterglows observed by Swift until July 2006, we find 30 whose standard decay phase extends up to at least a few days, 19 of them lasting for more than 10 d, while several afterglows display a slow fall-off until after 30 d. The X-ray light-curves of 8 afterglows (GRBs 050315, 050505, 050525A, 050726, 050814, 051221A, 060428A, 060526) show a second steepening break at 0.1–3 day to a faster decay, which can be interpreted as a jet-break (i.e. a light-curve steepening arising from the jet edge becoming visible to the observer). For 3 other afterglows (GRBs 050318, 050820A, and 060124) only one break is observed, followed by a decay sufficiently steep to warrant a jet-break interpretation as well, yielding a total of 11 X-ray afterglows with potential jet-breaks. Willingale et al (2007) identify several other afterglows which exhibit a steep decay after the hump. Therefore, the fraction of Swift X-ray afterglows with potential jet-breaks is larger than percent of the total number of afterglows monitored for more than a few days.
The jet model (with cooling below X-ray) is consistent at with 7 of the 11 post-break decays (and with all of them within ) listed above, as illustrated in Figure 24. For all these afterglows, the pre jet-break decay is consistent with the SPH1 model expectations, thus the standard jet model seems able to explain the X-ray light-curve breaks at 0.2–4 d followed by a steep decay. Further testing of this model requires optical observations. If a collimated outflow is indeed the reason for the late X-ray breaks, then the optical light-curve should exhibit a break at the same time (jet-breaks are achromatic) and the optical and X-ray pre-break (, ) and post-break (, ) decay indices should not differ by more than 1/4. This difference is expected if the cooling frequency is between the optical and X-ray and could persist after the break if the jet does not expand sideways; if the jet spreads laterally, the post-break decay indices should be equal even when the cooling frequency is in between optical and X-ray (Sari, Piran & Halpern 1999).

For the above set of X-ray afterglows with potential jet-breaks, a sufficiently good optical coverage before and after the X-ray break epoch exists only for GRBs 050525A, 060124, and 060526. Their X-ray and optical light-curves are shown in Figure 26. As can be seen, the breaks appear achromatic and the condition is satisfied. For GRB afterglow 050525A, is above 0.25 at and the break is only marginally consistent with jet origin. \mbox{{$$}}\mbox{{$$}}footnotetext: There is no evidence for a host galaxy contribution to the post-break optical emission of GRB afterglow 050525A and its associated supernova does not dominate the afterglow flux until after 3 d (Della Valle et al 2006) For GRB afterglow 060124, implies that the cooling frequency is between optical and X-ray (which is marginally consistent with ) and that the jet does not expand sideways.
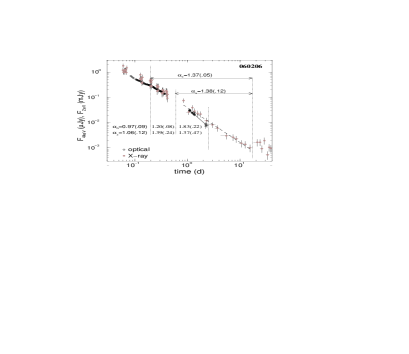
Figure 26 shows that achromatic light-curve breaks, as expected for jets, do exist. Burrows & Racusin (2007) show that the X-ray light-curve of GRB afterglow 060206 does not exhibit a steeper decay after the epoch (0.6 d) of the optical break identified by Stanek et al (2007). A chromatic optical break is incompatible with a jet origin and casts doubt over such an interpretation for the 10–15 optical breaks identified for BeppoSAX afterglows. Figure 28 shows that the post-break optical coverage for GRB afterglow 060206 is rather limited (last measurement is at 2.3 d) and that, within uncertainty of the X-ray measurements, the optical and X-ray decays at 0.1–2.5 d (when there are simultaneous measurements in both bands) are compatible. We suggest that the optical emission of this afterglow exhibits a fluctuation at 2 d and that there is no compelling evidence for a chromatic optical break at d.
7 Conclusions
As shown in §2, less than half of GRB tails are consistent with the delayed, large-angle emission released during the burst. Decays steeper than expected for this model may be due to the burst surface-brightness decreasing away from the direction to the observer on an angular scale of . The slower decays may be attributed to either the continuation of the burst emission or to the emergence of the forward-shock emission before the end of the burst. The former scenario finds support in the X-ray flares frequently occurring during the GRB tail, whose short timescale rules out a forward-shock origin (e.g. Zhang et al 2006, Burrows et al 2007). The latter scenario is proven to be at work occasionally by the long-lived, slow decays which start at the end of the burst and last for days.
Three quarters of GRB tails can be explained with the forward-shock synchrotron emission from a very narrow jet undergoing lateral spreading (Figure 4, right panel), the forward-shock inverse-Compton emission from a wide outflow (Figure 6, left panel), or the inverse-Compton emission from a jet that does not spread sideways (Figure 6, right panel). For the jet edge to be visible to the observer at the end of the burst, the jet half-opening angle must be less than , which is 2–10 times smaller than inferred for BeppoSAX afterglows from their day optical light-curve breaks (e.g. Frail et al 2001, Panaitescu & Kumar 2001). Together with the interpretation of the X-ray afterglow mechanism discussed below, this leads to a double-outflow forward-shock model (two jets moving in the same direction) where the burst emission arises from a narrow, leading jet and the afterglow emission from a less relativistic, wider outflow.
The X-ray slow-decay phase or hump following the GRB tail can be attributed to the emergence of the emission from a newly shocked outflow. This outflow may move along the same direction as that releasing the burst (i.e. there is a radial distribution of the ejecta energy), adding energy into the leading forward shock (e.g. Nousek et al 2006, Panaitescu et al 2006a, Zhang et al 2006), or slightly off the direction toward the observer (i.e. the ejecta energy has an angular distribution), its emission becoming visible after it has decelerated enough (Eichler & Granot 2006). The current sample of afterglows with well-determined X-ray emergence epoch, luminosity, and decay index (14 bursts with redshift, 32 in total) do not confirm the correlations expected in the latter model (§3.2, Figure 18), which indicates that energy injection in the forward shock (§3.1) is the mechanism producing the X-ray hump.
For the energy injection model, the duration of the hump requires a 2–5 spread in the Lorentz factor of the incoming ejecta (see also Granot & Kumar 2006), with the lowest (that of the ejecta arriving at the end of the hump) being between 20 and 100 (Figure 14). A smaller spread in the ejecta Lorentz factor is also possible; in the extreme case of a unique , the slow decay observed during the X-ray hump requires a circumburst medium with a wind-like stratification (as expected for a massive GRB progenitor) and ejecta Lorentz factors between 10 and 25 (Figure 12). As shown in Figure 14, the increase of the forward-shock energy that accommodates the X-ray hump does not obey a universal law, as could be expected if the energy injection were due to absorption of the dipole radiation from a newly born millisecond pulsar (Zhang et al 2006).
Granot et al (2006) and Zhang et al (2007) have found that the GRB output is between 1 and 10 percent of the forward-shock kinetic energy after the end of the hump (i.e. after energy injection has completed). If the forward-shock kinetic energy at the end of the burst is comparable to that of the GRB ejecta, then the increase by a factor 2–75 of the shock energy during the X-ray hump would imply that the efficiency of the GRB mechanism is, sometimes, not much below 100 percent. The first caveat here is the assumption that the ejecta injected during the X-ray hump did not contribute to the GRB emission. The opposite is possible if the gradual injection of energy in the forward shock is just a kinematic ”illusion” resulting from the dispersion in the ejecta Lorentz factor at the end of the burst phase. Evidently, in this situation, the GRB and its tail emissions cannot be from the forward shock, because the ejecta carrying most of the energy develop this shock only later, during the X-ray hump. Instead, the GRB tail must be identified with the large-angle burst emission (whatever is the burst mechanism) or with continuing internal shocks.
The second caveat of the above burst efficiency estimation is that it compares isotropic-equivalent energies over regions of different apertures, thus the true efficiency of the GRB mechanism may be smaller if the ejecta kinetic energy per solid angle over the visible opening is larger during the burst phase than during the afterglow. This could be the case for the double-outflow model mentioned above, where the GRB tail is the forward-shock emission from a ultrarelativistic, narrow jet () of higher kinetic energy per solid angle and the afterglow X-ray hump emission is that from the forward shock driven by of a less relativistic, wider outflow () of lower kinetic energy per solid angle.
The X-ray light-curves of 11 afterglows display a break at 0.1–15 d that can be attributed to a jet (Figure 24). The optical emission for 3 of them was monitored before and after the X-ray break epoch, providing evidence for an achromatic steepening of the afterglow emission decay, as expected for a jet-break. Their pre-break optical and X-ray decay indices are in agreement with the expectations for the standard forward-shock model. Taking into account the lack of conclusive evidence for achromatic breaks in pre-Swift afterglows, optical monitoring of future Swift afterglows will be essential in testing the predictions of the widely-used jet model.
The reverse shock and internal shocks have been recently proposed (Genet et al 2007, Ghisellini et al 2007, Uhm & Beloborodov 2007) to be the origin of the X-ray and, perhaps, the optical afterglow emissions, motivated by the decoupling of the light-curve decays at these frequencies during the X-ray hump. The continuity of the X-ray light-curve plateau and the subsequent ”standard decay” argues in favour of a single mechanism for both. It would be very contrived for internal shocks to yield smooth, power-law X-ray light-curves lasting days and weeks, thus this mechanism cannot be a prevalent origin for the X-ray humps. A sustained injection of ejecta in the reverse shock, characterized by a power-law distribution of ejecta mass with Lorentz factor, could account for the long-lived X-ray light-curves, but the forward-shock model still remains the most natural explanation for the X-ray afterglows emission because, in this model, the power-law decaying light-curves are a straightforward consequence of the power-law deceleration (Lorentz factor versus radius) of the blast-wave caused by its interaction with the ambient medium.
Acknowledgments
The author thanks Pawan Kumar, Richard Willingale, and the referee for their helpful suggestions and comments. This work made use of data supplied by the UK Swift Science Data Center at the University of Leicester.
References
- 1 Blustin A. et al, 2006, ApJ 637, 901
- 2 Burrows D., Racusin J., 2007, Nuovo Cimento B 121, accepted (astro-ph/0702633)
- 3 Burrows D. et al, 2007, Phil Trans A, accepted (astroph/0701046)
- 4 Chevalier R., Li Z., 1999, ApJ 520, L29
- 5 Curran P. et al, 2007, Nuovo Cimento B 121, accepted (astro-ph/0610067)
- 6 Cusumano G. et al, 2007, A&A, 462, 73
- 7 Dai X. et al, 2007, ApJ 658, 509
- 8 Dai Z., Lu T., 1998, A&A 333, L87
- 9 Della Valle M. et al, 2006, ApJ 642, L103
- 10 Eichler D., Granot J., 2006, ApJ 641, L5
- 11 Evans P. et al, 2007, A&A, submitted (arXiv:0704.0128)
- 12 Fenimore E., Sumner M., 1997, All-Sky X-ray Observations in the Next Decade, Riken, Japan, eds. M. Matsuoka and N. Kawai, 167 (astro-ph/9705052)
- 13 Frail D. et al, 2001, ApJ 562, L55
- 14 Genet F., Daigne F., Mochkovitch R., 2007, A&A, accepted (astro-ph/0701204)
- 15 Ghisellini G. et al, 2007, ApJ 658, L75
- 16 Granot J., Kumar P., 2006, MNRAS 366, L13
- 17 Granot J., Konigl A., Piran T., 2006, MNRAS 370, 1946
- 18 Holland S. et al, 2007, AJ 133, 122
- 19 Klotz A. et al, 2005, A&A 439, L35
- 20 Kulkarni S. et al, 1999, Nature 398, 389
- 21 Kumar P., Piran T., 2000, ApJ 535, 152
- 22 Kumar P., Panaitescu A., 2000, ApJ 541, L51
- 23 Lithwick Y., Sari R., 2001, ApJ 555, 540
- 24 Medvedev M., Loeb A., 1999, ApJ 526, 697
- 25 Mészáros P., Rees M., 1997, ApJ 476, 232
- 26 Mészáros P., Rees M., Wijers R., 1998, ApJ 499, 301
- 27 Misra K. et al, 2007, A&A, 464, 903
- 28 Nousek J. et al, 2006, ApJ 642, 389
- 29 O’Brien P. et al, 2006, ApJ 647, 1213
- 30 Paczyński B., 1998, ApJ 494, L45
- 31 Paczyński B., Rhoads J., 1993, ApJ 418, L5
- 32 Panaitescu A., Mészáros P., Rees M., 1998, ApJ 503, 314
- 33 Panaitescu A., Mészáros P., 2000, ApJ 544, L17
- 34 Panaitescu A., Kumar P., 2001, ApJ 560, L49
- 35 Panaitescu A., Kumar P., 2004, MNRAS 353, 511
- 36 Panaitescu A. et al, 2006a, MNRAS 366, 1357
- 37 Panaitescu A. et al, 2006b, MNRAS 369, 2059
- 38 Pandey S. et al, 2006, A&A 460, 415
- 39 Rees M., Mészáros P., 1994, ApJ 430, L93
- 40 Rees M., Mészáros P., 1998, ApJ 496, L1
- 41 Rhoads J., 1999, ApJ 525, 737
- 42 Rossi E., Lazzati D., Rees M., 2002, MNRAS 332, 945
- 43 Sari R., Piran T., 1997, ApJ 485, 270
- 44 Sari R., Piran T., Narayan R., 1998, ApJ 497, L17
- 45 Sari R., Piran T., Halpern J., 1999, ApJ 519, L17
- 46 Sari R., Esin A., 2001, ApJ 548, 787
- 47 Schady P. et al, 2007, MNRAS, submitted (astro-ph/0611081)
- 48 Soderberg A. et al, 2007, ApJ, in press (astro-ph/0607511)
- 49 Stanek K. et al, 2007, ApJ 654, L21
- 50 Stern B., Poutanen J., 2004, MNRAS 352, L35
- 51 Uhm Z., Beloborodov A., 2007, ApJ, subm (astro-ph/0701205)
- 52 Watson D. et al, 2007, ApJ 637, L69
- 53 Willingale R. et al, 2007, ApJ, submitted (astro-ph/0612031)
- 54 Yost S. et al, 2007, ApJ 657, 925
- 55 Zeh A., Klose S., Kann D., 2006, ApJ 637, 889
- 56 Zhang B., Mészáros P., 2001, ApJ 522, L35
- 57 Zhang B. et al, 2006, ApJ 642, 354
- 58 Zhang B. et al, 2007, ApJ 655, 989