Multi-frequency monitoring of -ray loud blazars
Abstract
Context. Being dominated by non-thermal emission from aligned relativistic jets, blazars allow us to elucidate the physics of extragalactic jets, and, ultimately, how the energy is extracted from the central black hole in radio-loud active galactic nuclei.
Aims. Crucial information is provided by broad-band spectral energy distributions (SEDs), their trends with luminosity and correlated multi-frequency variability. With this study we plan to obtain a database of contemporaneous radio-to-optical spectra of a sample of blazars, which are and will be observed by current and future high-energy satellites.
Methods. Since December 2004 we are performing a monthly multi-frequency radio monitoring of a sample of 35 blazars at the antennas in Medicina and Noto. Contemporaneous near-IR and optical observations for all our observing epochs are organised.
Results. Until June 2006 about 4000 radio measurements and 5500 near-IR and optical measurements were obtained. Most of the sources show significant variability in all observing bands. Here we present the multi-frequency data acquired during the first eighteen months of the project, and construct the SEDs for the best-sampled sources.
Key Words.:
galaxies: active – galaxies: BL Lacertae objects: general – galaxies: jets – galaxies: quasars: general1 Introduction
Blazars form a sub-group of radio-loud active galactic nuclei (AGN) showing extreme variability at all wavelengths, high degrees of linear polarization, strong -ray emission, apparent superluminal motion of radio jet components, and brightness temperatures exceeding the Compton limit (see e.g. Urry 1999). They include BL Lac objects as well as quasars with flat radio spectrum and violent variability in the optical band. The large amount of work done in the last decades led to the commonly accepted scenario in which a rotating supermassive black hole surrounded by an accretion disk with an intense plasma jet closely aligned to the line of sight is responsible for the blazar emission. Relativistic electrons produce the soft photons through synchrotron emission, while hard photons are likely produced by inverse-Compton scattering. This overall scenario, however, still presents a large number of poorly understood details which, in turn, lead to a wide variety of models and call for long-term and multi-wavelength campaigns capable of providing the necessary observational constraints.
From the time scales of variability key information on the AGN structure can be derived, down to linear scales or flux density levels not accessible even with interferometric imaging, but the mechanisms which are responsible for variability are not well understood yet. Different models are discussed in the literature such as shock-in-jets (e.g. Marscher & Gear 1985; Aller et al. 1985; Marscher 1996) or colliding relativistic plasma shells (e.g. Spada et al. 2001; Guetta et al. 2004). Further, in the case of precessing binary black-hole systems (e.g. Begelman et al. 1980; Sillanpää et al. 1988), rotating helical jets (e.g. Villata et al. 1998; Villata & Raiteri 1999) or helical trajectories of plasma elements (e.g. Camenzind & Krockenberger 1992), the models suggest that changes in the direction of forward beaming introduces flares due to the lighthouse effect. Thus, variability furnishes important clues into size, structure, physics and dynamics of the radiating source region. A tool to study the radiating particles is provided by the analysis of the synchrotron continuum over a range of frequencies as broad as possible. The shape of the synchrotron spectrum gives direct insight into the shape of the electron energy distribution, thus also constraining the emission by the inverse-Compton process at other wavelengths.
The most extensive blazar monitoring campaigns have been carried out at radio frequencies. The University of Michigan monitoring program at 4.8, 8.0 and 14.5 GHz has obtained data on over 200 sources for over three decades (Aller et al. 2003) and is still continued. At higher frequencies, the Metsähovi Radio Observatory has reported observations at 22, 37 and 87 GHz of 157 extragalactic radio sources (Teräsranta et al. 1998, 2004, 2005), many of which have been monitored for over 20 years, but the monitoring is now continued only at 37 GHz. The Bologna group (Bondi et al. 1996) has observed at 408 MHz 125 radio sources from 1975 to 1990. A sample of 550 sources is monitored at six radio frequencies from 1.4 to 31 GHz quasi simultaneously since many years at the RATAN-600 telescope (Kovalev et al. 2002).
However, aside from some organised broad multi-wavelength campaigns, most of our previous studies of the spectral energy distributions (SEDs) of blazars were performed by combining measurements carried out non-simultaneously (over a period of one or more months), using the above mentioned radio surveys and data from various optical, near-IR, and X-ray observatories (e.g. Raiteri et al. 1999, 2001, 2003; Villata et al. 2004a). Since blazars are highly variable, it is therewith necessary to extrapolate between non simultaneous points, which is not an ideal procedure. Hence, it is important to take simultaneous broad-band spectra that are not affected by the variability. Therefore, we started a monthly multi-frequency radio monitoring of a sample of 35 -ray loud blazars at the antennas in Medicina and Noto, and organised contemporaneous near-IR and optical observations for most of the observing epochs. This provides a valuable database of time-dependent SEDs, which can be used to test different jet emission models. The monitoring is supposed to support also the next Italian high-energy space missions AGILE, which will observe many of our monitored sources.
In this article we will present the light curves and SEDs of those sources which have been monitored for at least one year by the end of June 2006. Further publications with a more detailed timing analysis and modelling of the SEDs are in preparation. Throughout this paper we will assume a flat universe model with the following parameters: Hubble constant km s-1 Mpc-1, a pressure-less matter content , and a cosmological constant (Spergel et al. 2003). Cosmology-dependent values quoted from other authors are scaled to these parameters.
The paper is organised as follows: Section 2 introduces the source sample. In Sect. 3 we will describe the data acquisition and reduction procedures and in Sect. 4 we will present the resulting light curves and SEDs. Peculiar variability behaviours or special treatments during the data analysis for single sources are described in Sect 5. Conclusions are drawn in Sect. 6.
2 The source sample
At the beginning of our monitoring we started with a sample of -ray loud sources which had already been monitored in the optical band at the Perugia and Torino observatories since 1994 and which were relatively bright also in the radio band (SJy). In view of the forthcoming launch of the high-energy satellites AGILE and GLAST, we subsequently added some more sources from the third EGRET catalog (Hartman et al. 1999) with declination , which are also bright at optical () and radio wavelengths (S Jy). The 33 sources of the present sample are listed in Table 1. In this paper we present the data of those sources which were monitored for at least one year (marked in bold face in the table). The remaining ones will be reported in a later paper (Bach et al. in prep.).
| IAU | Other | R.A. & Dec. (J2000) | Type | |
|---|---|---|---|---|
| Name | Name | [h:m:s] [d:m:s] | ||
| 0219+428 | 3C 66A | 02:22:39.6 +43:02:08 | Q | 0.44 |
| 0235+164 | AO 0235+16 | 02:38:38.9 +16:36:59 | Q | 0.94 |
| 0336019 | CTA 026 | 03:39:30.9 01:46:36 | Q | 0.85 |
| 0420014 | PKS 042001 | 04:23:15.8 01:20:33 | Q | 0.91 |
| 0440003 | NRAO 190 | 04:42:38.6 00:17:43 | Q | 0.84 |
| 0528+134 | PKS 0528+134 | 05:30:56.4 +13:31:55 | Q | 2.06 |
| 0716+714 | S5 0716+71 | 07:21:53.4 +71:20:36 | BL | 0.3 |
| 0735+178 | PKS 0735+17 | 07:38:07.3 +17:42:19 | BL | 0.42 |
| 0736+017 | PKS 0736+01 | 07:39:18.0 +01:37:05 | Q | 0.19 |
| 0827+243 | OJ 248 | 08:30:52.1 +24:11:00 | Q | 0.94 |
| 0829+046 | OJ 49 | 08:31:48.9 +04:29:38 | BL | 0.17 |
| 0836+710 | S5 0836+71 | 08:41:24.3 +70:53:42 | Q | 2.17 |
| 0851+202 | OJ 287 | 08:54:48.8 +20:06:31 | BL | 0.31 |
| 0954+658 | S4 0954+65 | 09:58:47.2 +65:33:55 | BL | 0.37 |
| 1156+295 | 4C +29.45 | 11:59:31.8 +29:14:44 | Q | 0.73 |
| 1219+285 | W Com | 12:21:31.7 +28:13:58 | BL | 0.10 |
| 1226+023 | 3C 273 | 12:29:06.7 +02:03:09 | Q | 0.16 |
| 1253055 | 3C 279 | 12:56:11.1 05:47:21 | BL | 0.54 |
| 1334127 | PKS 1335127 | 13:37:39.8 12:57:25 | BL | 0.54 |
| 1354+195 | 4C +19.44 | 13:57:04.4 +19:19:07 | Sy | 0.72 |
| 1510089 | PKS 151008 | 15:12:50.5 09:06:00 | Q | 0.36 |
| 1606+105 | 4C +10.45 | 16:08:46.1 +10:29:08 | Q | 1.23 |
| 1611+343 | DA 406 | 16:13:41.0 +34:12:48 | Q | 1.40 |
| 1633+382 | S4 1633+38 | 16:35:15.4 +38:08:04 | Q | 1.81 |
| 1641+399 | 3C 345 | 16:42:58.8 +39:48:37 | Q | 0.59 |
| 1730130 | NRAO 530 | 17:33:02.6 13:04:49 | Q | 0.90 |
| 1741038 | PKS 174103 | 17:43:58.8 03:50:05 | Q | 1.05 |
| 1807+698 | 3C 371 | 18:06:50.7 +69:49:28 | BL | 0.05 |
| 2200+420 | BL Lac | 22:02:43.2 +42:16:40 | BL | 0.07 |
| 2223052 | 3C 446 | 22:25:47.2 04:57:01 | BL | 1.40 |
| 2230+114 | CTA 102 | 22:32:36.4 +11:43:50 | Q | 1.04 |
| 2251+158 | 3C 454.3 | 22:53:57.7 +16:08:54 | Q | 0.86 |
| 2344+092 | 4C 09.74 | 23:46:36.8 +09:30:45 | Q | 0.68 |
3 Observations and data reduction
3.1 Radio data
Radio measurements were taken at the 32 m radio antennas of the INAF-Istituto di Radioastronomia in Medicina and Noto on a monthly basis at frequencies of 5, 8, and 22 GHz. At the beginning all frequencies (5, 8, and 22 GHz) were taken at both telescopes, but because of the better performance of the Noto antenna at high frequencies, the observations were split to 5 and 8 GHz at Medicina and 22 GHz at Noto after the first 6 months. Unfortunately, the antenna in Noto was out of operation for the second half of 2005, because of a technical failure. During this time observations at 22 GHz were occasionally performed at Medicina. Because blazars tend to be more variable at higher radio frequencies and a new 43 GHz receiver at Noto became available, from early 2006 data are acquired at 43 GHz in Noto (Bach et al. in prep.), while the radio monitoring at 22 GHz is done with the Medicina antenna only.
The nominal system equivalent flux densities (SEFD) of the Medicina antenna are 296 Jy, 284 Jy, and 1318 Jy at 5, 8, and 22 GHz respectively, and 260 Jy, 770 Jy, and 800 Jy at the Noto antenna. On both telescopes the data is taken from the VLBI backend. Because of radio interference (RFI) the bandwidth at 5 GHz is limited to 32 MHz at Medicina, but at the other frequencies the full IF (intermediate frequency channel) of 400 MHz bandwidth is used.
The observations in Medicina are performed using ON/OFF measurements through the VLBI field system. The ON/OFFs are obtained by pointing the telescope subsequently ON the source and five beam widths to the east and west OFF the source. A typical ON/OFF sequence (8 to 20 ON/OFF subscans) takes about 8 to 18 minutes, depending on the frequency and source flux, and corresponds to 40 to 100 seconds ON-source integration time. Regular sky dip measurements (every 3 to 4 hours) are used to correct the data for opacity effects. The 22 and 43 GHz flux measurements in Noto are obtained with a similar method but the ON/OFF subscans are realized by “chopping” the secondary reflector between the ON and OFF position, which allows a faster switching. Here, a typical ON/OFF sequence of 20 subscans with 1 second integration time takes about 3 minutes. At the lower frequencies (5 and 8 GHz) the antenna performs raster scans in right ascension and flux densities are obtained by Gaussian fitting of the right ascension profiles. Opacity measurements are taken every half an hour.
Since the VLBI field system is used to perform the observations in Medicina and Noto, SNAP-command scripts or schedules are used to control the telescope. Most of the observations at Medicina are carried out remotely from Torino. Usually a single schedule is used for each 2–3 day observing run, switching between frequencies every few hours, but in case of technical problems or dramatic weather changes it is possible to change the schedule at any time. All the information provided by the observing system (e.g.: weather information, system temperature, as well as the counts from the ON/OFF measurements) are written in ASCI format into a log-file. The field system also performs an analysis of the ON/OFF scans and provides uncalibrated antenna temperatures. However, to be more flexible in the data editing and to discard also single subscans, we wrote a Python program which extracts the information from the log-file and analyses again the individual subscans. The resulting table contains Stoke I antenna temperatures averaged over the two IFs containing the left and right circular polarized signals. The software which was used during a previous blazar radio monitoring project performed in Medicina and Noto between 1996 and 2000 (Venturi et al. 2001) was not usable anymore, because the ON/OFF procedure of the field system has changed in the meantime. Noto measurements from both observing methods are written in separate log-files and are reduced using IDL programs.
The flux density measurements are calibrated using a set of standard primary calibrators, namely 3C 123, 3C 147, 3C 286, 3C 295, 3C 48, and NGC 7027, and in addition at 22 GHz DR 21 and W3OH. Their flux densities were calculated by the polynomial expressions given by Baars et al. (1977) and Ott et al. (1994). Presumably the most stable calibrator is 3C 286, for which 7.32 Jy (5 GHz), 5.22 Jy (8 GHz), and 2.50 Jy (22 GHz) were adopted for the calibration, but at 22 GHz mainly NGC 7027 (5.58 Jy) and DR 21 (19.04 Jy) were used, because they are more reliable (less variable) than quasars at this frequency. The calibrators are also used to obtain elevation-dependent gain curves to correct the data for this effect. The accuracy of the ON/OFF measurements in Medicina at 5 and 8 GHz is usually about 5% to 10%, depending on the source flux density and weather conditions. At 22 GHz the accuracy is more weather-dependent, and ranges between 10% to 15% during good weather, but can be much worse during unstable weather conditions. Raster scans, like they are used in Noto, yield a slightly better accuracy, the typical error at 5 and 8 GHz being 2–5%. At 22 GHz the typical error at the Noto antenna is about 10%.
3.2 Optical and near-IR data
Contemporaneously to the radio observations we organise optical ( bands) and near-IR ( bands) observations at several observatories, which are listed in Table 2. The optical and near-IR magnitudes are obtained by differential photometry to known reference stars111The adopted photometry can be found at http://www.to.astro.it/blazars/webt/bamp/list.html..
The images were reduced using standard procedures for photometry. To avoid offsets due to different calibration choices, the measurements from the different observatories were collected as instrumental magnitudes of the source and references stars and were calibrated all together. The uncertainty was calculated from the scattering of the references stars, which are supposed to be not variable.
| Observatory | Size [m] | Bands | N |
|---|---|---|---|
| Medicina12 | 32.0 | 5, 8, 22 GHz | 2953 |
| Noto5 | 32.0 | 5, 8, 22 GHz | 1405 |
| Maidanak (T-60)10 | 0.6 | 3327 | |
| Abastumani11 | 0.7 | 342 | |
| Crimea4 | 0.7 | 791 | |
| St. Petersburg4 | 0.4 | ||
| Perugia2 | 0.4 | 80 | |
| Campo Imperatore (AZT-24)9 | 1.1 | 2898 | |
| Torino (OTAP)1 | 1.0 | 1726 | |
| Sabadell7 | 0.5 | 204 |
Flux densities were derived from magnitudes using the absolute calibrations of Bessell et al. (1998), after dereddening according to the extinction laws of Cardelli et al. (1989). We adopted the -band values of Galactic extinction provided by Nasa/IPAC extragalactic database222http://nedwww.ipac.caltech.edu (NED), from Schlegel et al. (1998). Non standard procedures that were used to reduce the data of 0235+164 and 2200+420 (BL Lac) are described in Sect. 5.
4 Results
In this section we present the radio as well as the near-IR and optical light curves of the best sampled sources. The corresponding SEDs constructed with simultaneous data are also shown. Peculiarities in the light curves of single objects are described in the next section (Sect. 5)
4.1 Radio light curves
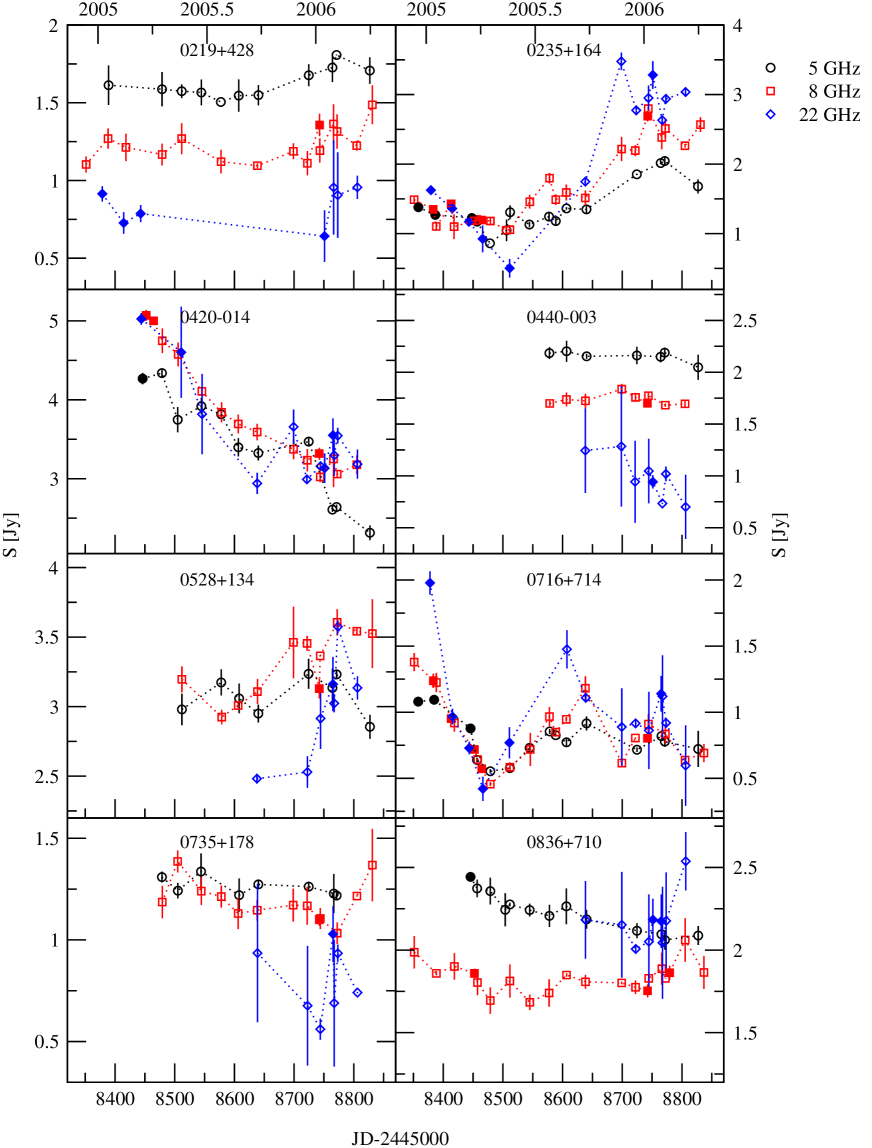
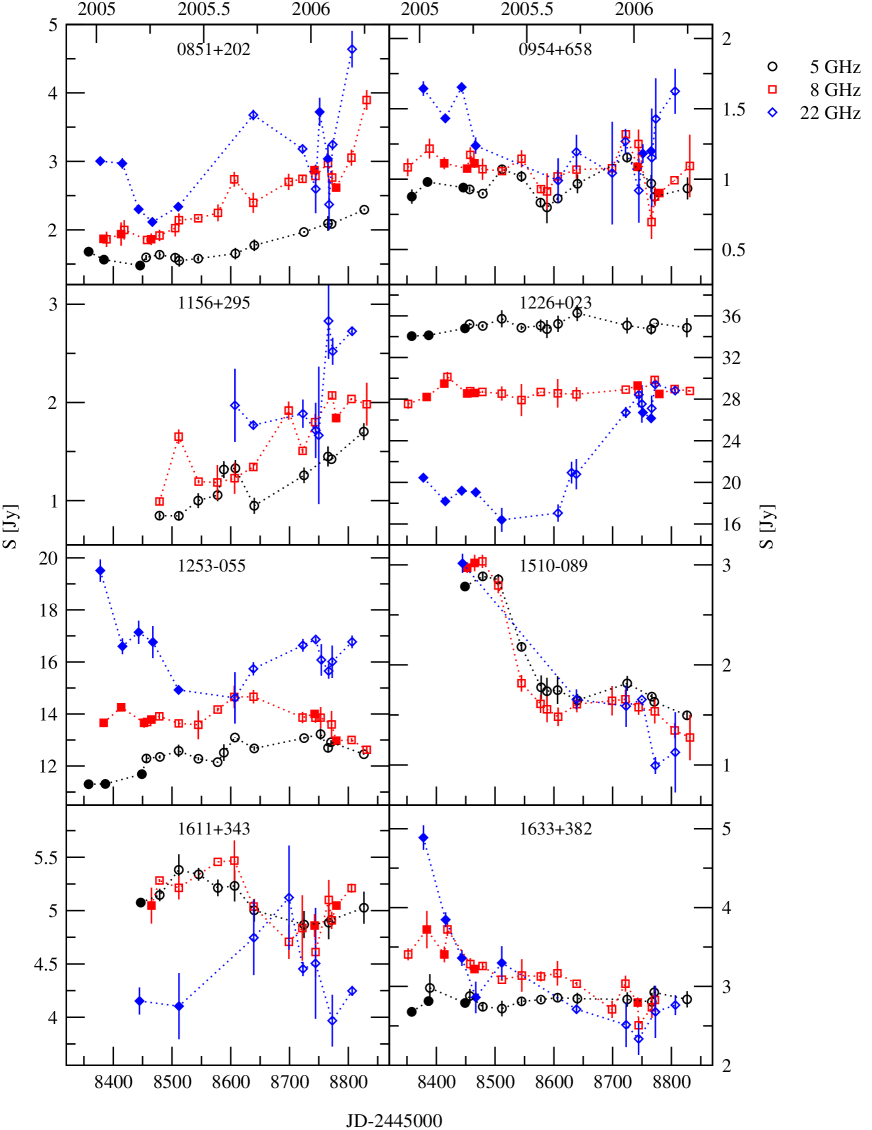
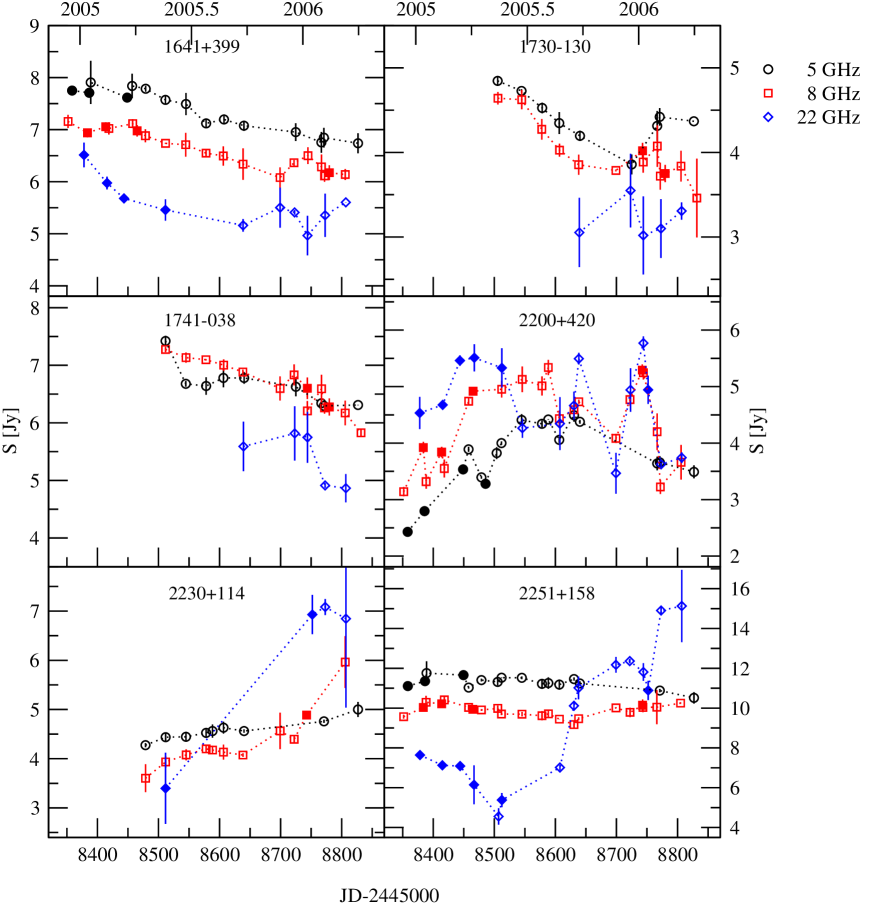
Radio light curves at 5, 8, and 22 GHz of those blazars that are monitored from the beginning of our project are shown in Fig. 1. As visible in the legend, different symbols refer to different frequencies, whereas open symbols denote data taken in Medicina and filled symbols denote data from the antenna in Noto. The very good agreement between the radio measurements from the antennas in Noto and Medicina, taken with different methods and reduced by different authors, confirms a overall good quality of the data. During some epochs the data was affected by bad weather conditions, which results in larger scattering and error bars, specially at 22 GHz.
Most of the sources display significant variability on monthly time scales. Some sources show an achromatic behaviour, where the flux densities at different frequencies vary simultaneously, e.g. 1510-089. In other cases variations at 22 GHz are likely leading those at the lower frequencies, e.g. 1226+023 (3C 273) and 2251+158 (3C 454.3). In the case of 2200+420 (BL Lacertae), we recognise both characteristics. A flare that is more pronounced at 22 GHz appeared in early 2005 and a second one equally bright at all frequencies followed about 250 days later.
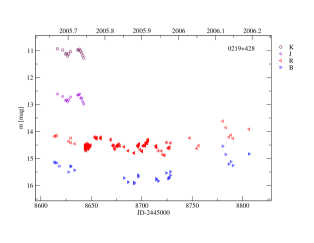
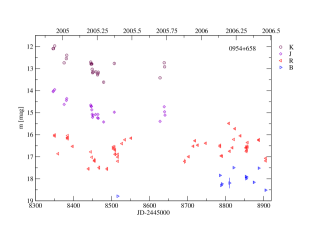
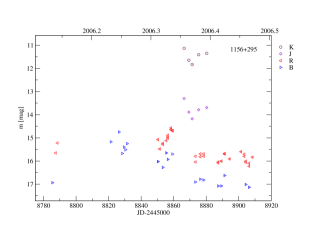
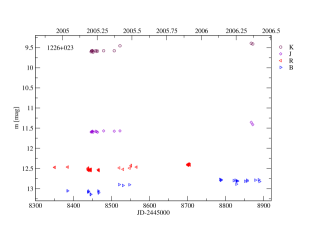
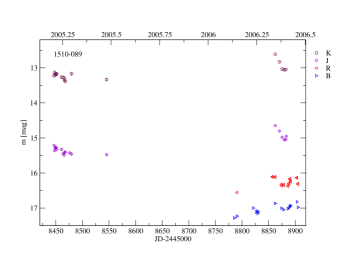
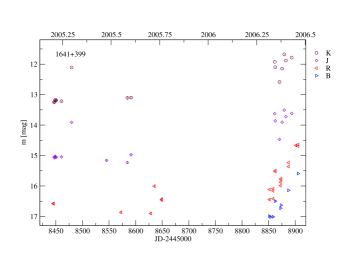
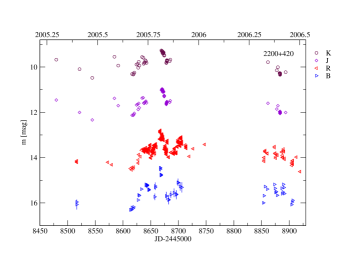
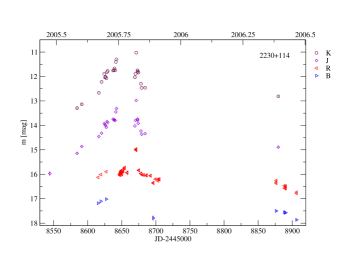
4.2 Optical light curves
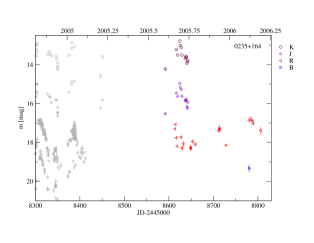
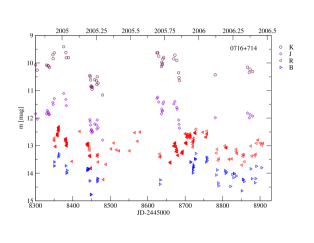
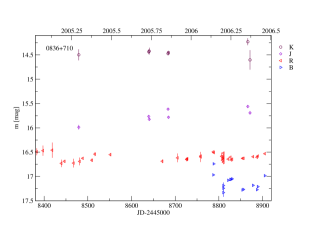
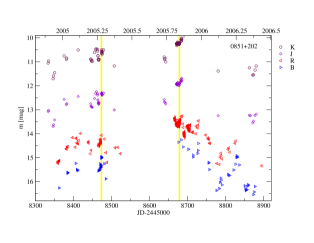
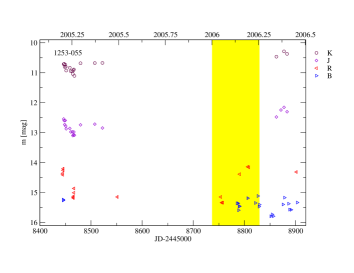
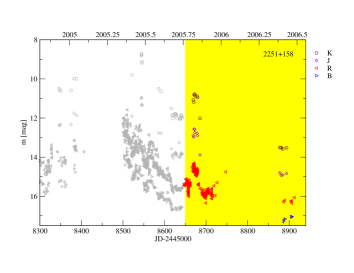
Optical light curves are not shown for all sources, but only for those which have a good time coverage (Fig. 2). The lack of data is mostly due to solar conjunction or bad weather periods. The measurements from different observatories agree quite well and the variations in the optical bands and near-IR bands usually show similar amplitudes. To allow the reader to better distinguish between different bands only , , , and light curves are shown. Measurements in , , and are shown in the SEDs only (next Sect.). In general, the sources are all more variable in the optical bands than at radio wavelengths. In Fig. 2 we complement the light curves of 0235+164 and 2251+158 with data taken by the Whole Earth Blazar Telescope333http://www.to.astro.it/blazars/webt/ (WEBT) during specific campaigns (grey symbols, see Raiteri et al. 2006b for 0235+164 and Villata et al. 2006 for 2251+258).
Part of the data presented here were also provided to other multi-wavelength campaigns and the specific time intervals are marked by yellow (grey in the printed version) vertical bars in the figure. For 0851+202 the periods of two short-term WEBT campaigns organized in conjunction with two pointings of the X-ray satellite XMM-Newton (Ciprini et al. in prep.) are highlighted. Similarly, the yellow strip crossing the 1253-055 light curves indicates the time of the January–March 2006 WEBT campaign on this object (Böttcher et al. in prep.). In the case of 2251+158, the yellow area corresponds to the new WEBT campaigns following the 2004–2005 one (Villata et al. in prep; Raiteri et al. in prep.).
4.3 Spectral energy distributions
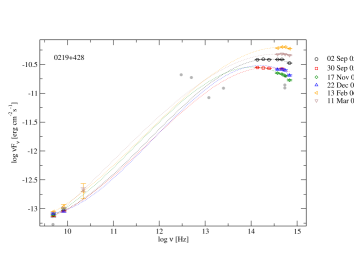
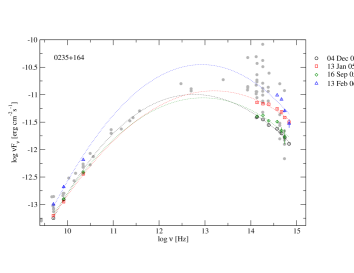
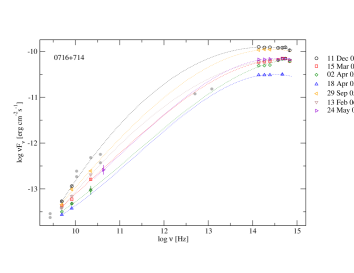
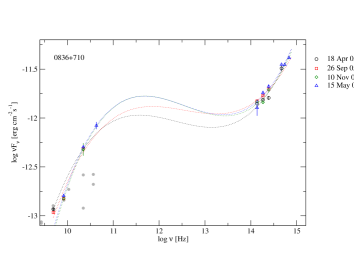
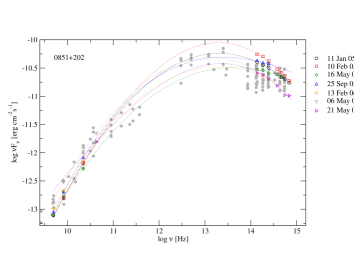
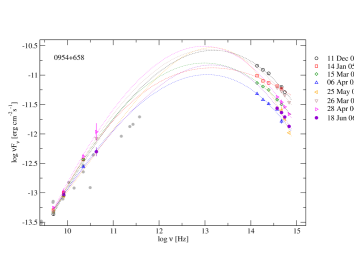
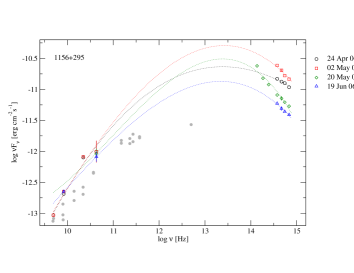
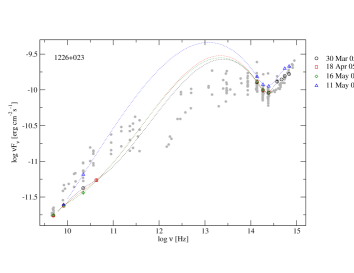
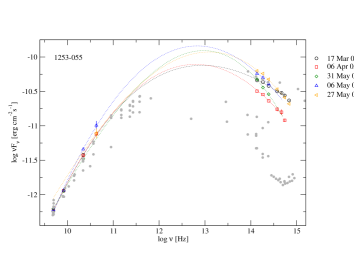
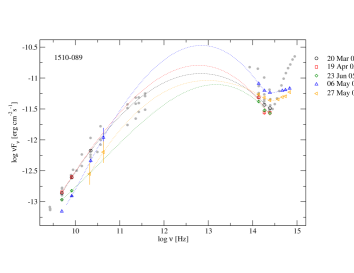
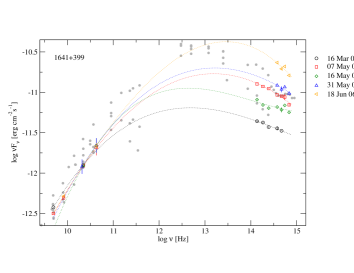
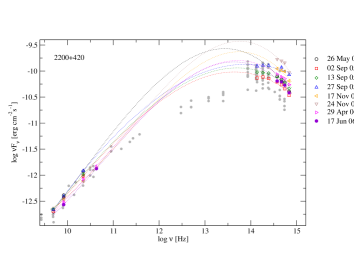
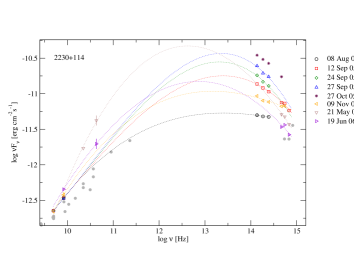
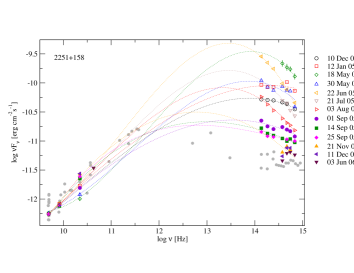
In Fig. 3 the SEDs of several blazars are shown. Grey dots represent non-simultaneous literature data taken from NED, while different symbols (and colours) have been used to distinguish the contemporaneous data acquired for this project. The sources shown here are those for which several epochs of simultaneous data exist and whose SEDs show significant variability. In this energy range, we expect to see the synchrotron component peaking in the sub-millimetre to infrared region, in the case of these low-energy peaked blazars.
The lines connecting the data points are third-order polynomial fits, and do not represent any emission model. Although the SEDs of blazars seem to be represented quite well by log-parabolic fits, as demonstrated by various authors (Landau et al. 1986; Perri et al. 2003; Massaro et al. 2004a, b), we used third-order fits because they show more clearly the optical spectral changes which are present in some sources. In those cases where a “blue bump” appears, we used cubic spline interpolations. Thus the lines are drawn just to guide the eye and to better illustrate the behaviour of the source. A proper modelling of the SED is behind the scope of this article, but will be presented in a future publication. Therefore, the peaks of the SEDs in Fig. 3 might not exactly match the position where most of the energy is released, but should provide an estimate of the true location.
As already seen in the radio light curves, also the broad-band variability can be either chromatic or achromatic. The long-term variability of the BL Lac object 0716+714 seems to affect the emission from the radio to the optical wavelengths at the same time, whereas the behaviour of 2251+158 is completely different. Indeed, in 2005 the source experienced a historical flare, peaking around May in the optical band (Fuhrmann et al. 2006; Pian et al. 2006; Villata et al. 2006), and possibly a bit later in the near-IR one, while it appeared at 22 GHz with a few months of delay, in August–September 2005 (see Fig. 1).
Although most blazars of our sample reach their emission peak in the millimetre-to-infrared regime and their SED declines in the optical band, some sources show different behaviours. Exceptions are e.g. 0716+714, whose SED appears rather flat in the optical band, and the quasars 0836+710, 1226+026, and 1510-089, whose optical part of the SED is increasing again (see the individual paragraphs in Sect. 5 for more details). Commonly, this increase is referred to as a “blue bump”, which could be due to emission from an accretion disk (e.g. Bregman 1990).
For some sources, e.g. 0235+164, 1156+195, and 2251+158, we can also see spectral changes during different states in the optical, whose dependence on the brightness level, if any, is not clear. In the other cases the colours do not change much during different brightness levels.
5 Notes on individual sources
0219+428 (3C 66A)
This BL Lac object has been observed intensively at optical wavelengths (e.g. Böttcher et al. 2005) and Lainela et al. (1999) found a possible periodicity of 65 days in its optical bright state. Very fast superluminal motion of up to 29 was reported by Jorstad et al. (2001). Despite some small flux changes, the radio light curves reveal not much variability (Fig. 1). A major problem for radio measurements of 3C 66A is its close companion 3C 66B, which at some position angles appears in the OFF measurements or the cross scans and makes the calibration more difficult. During the first days of the optical light curve a brightness decrease is visible, which reached its minimum at about JD=2453650 (October 2005), with some shorter variability on top of the long-term trend (Fig. 2).
0235+164
This BL Lac object usually displays strong variability at optical and radio wavelength. Although very compact, sometimes jet features with high superluminal motion can be observed. Jorstad et al. (2001) reported an apparent speed as fast as 40 , and another feature at about 26 was observed by Piner et al. (2006). An outburst in early 2004 was expected as part of a year quasi-periodicity resulting from the analysis of the radio (and optical) historical light curves (Raiteri et al. 2001). A long-term multi-wavelength campaign was organized by the WEBT to monitor the predicted outburst (Raiteri et al. 2005, 2006a, 2006b). The grey symbols in Fig. 2 represent the data taken in the last period of the WEBT campaign. Only two arcseconds south of the source, there is another AGN, which significantly affects the optical flux measurements of the 0235+164. Therefore, the magnitudes shown in Fig. 2 have been corrected for this contribution. Moreover, the near-IR and optical fluxes shown in Fig. 3 were obtained by taking into account not only the Galactic extinction, but also the extinction due to the foreground galaxy (see details in Raiteri et al. 2005). We observed the source in a very low state. The light curves show a slow increase at radio frequencies, reaching a maximum at 22 GHz around JD=2453700 (November 2005) and several weeks later at 8 and 5 GHz. Some significant variability is also visible at the optical wavelengths.
0716+714
This BL Lac object is one of the best-studied intraday variable sources. Simultaneous radio, optical, UV, and X-ray monitoring yielded a short duty cycle of variability at all frequencies, as well as a correlation between the rapid variations at different frequency regimes (Wagner et al. 1996). Those measurements suggested very small sources sizes and high brightness temperatures exceeding K. The data collected during a recent large multi-wavelength campaign allowed to obtain more moderate values of to K (Ostorero et al. 2006; Agudo et al. 2006; Fuhrmann et al. in prep.), well in agreement with the Doppler factors derived from kinematical studies of the jet (e.g, Jorstad et al. 2001; Kellermann et al. 2004; Bach et al. 2005) and space VLBI measurements of the source size (Bach et al. 2006a). A detailed study of the multi-wavelength long-term variability was performed by Raiteri et al. (2003). During the present monitoring, 0716+714 showed three flares in the radio, lasting about 100 days, and exhibiting a smaller amplitude than those occurred in the past. But in our observing period, the radio flux also went down to its historical minimum of about 0.5 Jy (Fig. 1). Similar variations appear also in the optical band (Fig. 2), and an inspection of the SEDs confirms that the optical and radio flux densities vary contemporaneously (Fig. 3). The fact that the peak of the SEDs falls at higher energies compared to many of the other blazars in our sample confirms the classification of this source as an “intermediate” BL Lac (as 3C 66A), half-way between the low-energy peaked (LBL) and the high-energy peaked (HBL) BL Lacs.
0836+710
This ultra-luminous quasar at is showing a well correlated broad-band variability that also seems to correlate with the structural changes seen in the VLBI jet (e.g. Otterbein et al. 1998). The source showed only weak variability (Figs. 1 & 2). The hard near-IR–optical spectrum implies that the blue bump component, likely due to thermal emission from the accretion disc, is still dominant in the near-IR band, and consequently it is not possible to distinguish the high-energy part of the synchrotron component. This is actually expected, because of the high redshift of the source.
0851+202 (OJ 287)
This well-studied BL Lac object is known for its -year periodicity in the optical light curve (Sillanpää et al. 1988, 1996). The outbursts appear as double-peaked and their periodic occurrence is mostly interpreted in terms of a binary black hole system (Sillanpää et al. 1988; Lehto & Valtonen 1996; Villata et al. 1998; Valtaoja et al. 2000). Depending on the model, different dates around 2006 are predicted for the next outburst, but the recent strong activity makes an identification not easy. According to Valtonen et al. (2006a, b), the outburst occurred in late 2005 may have already been the predicted one, but a final statement is not possible before 2008, when all predicted dates will have passed. During our radio monitoring we observed an increasing trend, with some flares detectable at 22 GHz (Fig. 1). The optical light curves show the declining phase of the large outburst around November 2005, and another flare around April–May 2006 (Fig. 2). The SEDs shows that the amplitude of the optical variations of OJ 287 were slightly larger than in the radio (Fig. 3).
0954+658
This BL Lac object is another famous IDV source (Wagner et al. 1993; Wagner & Witzel 1995; Gabuzda et al. 2000). The jet structure shows many bends from milliarcsecond to arcsecond scales and speeds of up to 9 were measured with VLBI (Gabuzda & Cawthorne 1996; Kollgaard et al. 1992). The long-term radio light curve (Fig. 1) displays some variability, which is more pronounced at 22 GHz, while greater activity characterizes the optical behaviour (Fig. 2). This becomes even more evident in the SEDs, where in addition one can notice the flattening of the optical spectrum during the flare of January 2005 (Fig. 3).
1156+295
This quasar is extremely variable over all the electromagnetic spectrum, from radio waves to -rays (Wills et al. 1983, 1992; Hartman et al. 1999). 1156+295 has a straight arcsecond scale jet and a more curved jet on milliarcsecond scales, with jet components moving at superluminal speeds of up to 16 (e.g. Hong et al. 2004). Our observations reveal a major optical outburst in March 2006 (Fig. 2). An increasing trend is also visible in the radio light (Fig. 1) and it will be interesting to see if we can find a connection between the two events.
1226+023 (3C 273)
This object shows all the characteristics that are typical of high-luminosity quasars: a flat radio spectrum of the core, strong and rapid variability in all the observed energy ranges (e.g. von Montigny et al. 1997; McHardy et al. 1999), variable polarization, and a radio jet with superluminal motion (e.g. Pearson et al. 1981). Additionally, it shows an optical and X-ray jet, and a very prominent UV excess, the so-called big blue bump (e.g. Röser et al. 1996; Jester et al. 2005). In the SEDs the contribution of this component begins to dominate over the synchrotron one in the optical band (Fig. 3). Since it is likely due to thermal radiation from the accretion disc, it is not expected to be strongly variable on short time scales, and indeed the optical light curves do not show important flux changes over the whole time range (Fig. 2). On the contrary, a noticeable flux increase has recently been observed at 22 GHz, which might propagate also to the lower radio frequencies in the next future (Fig. 1).
1253055 (3C 279)
This quasar, considered the first superluminal source (Whitney et al. 1971), is often nearly as bright as 3C 273 at high frequencies. Since it is also a bright -ray source (Hartman et al. 1999), 3C 279 has been the target of a number of campaigns of contemporaneous monitoring from -ray to radio frequencies (e.g. Grandi et al. 1996; Wehrle et al. 1998). Another campaign has recently been performed, which was motivated by an optical bright state observed in December 2005–January 2006, which in turn triggered ToO observations by Chandra and INTEGRAL (Böttcher et al. in prep.). The radio light curve at 22 GHz shows a noticeable decrease in the first months of the project, and a more moderate increase afterwards; on the contrary, the radio flux at 8 and 5 GHz did not change very much (Fig. 1). Due to the low declination of the source, the optical light curve has a large gap around the solar conjunction (Fig. 2). The SEDs show a fast changing optical spectrum (Fig. 3).
1510089
This is another extreme quasar, highly polarized, and bright at X-ray and -ray energies. It exhibits a highly bent radio jet structure with fast superluminal speeds of up to 20 (Singh et al. 1997; Hartman et al. 1999; Homan et al. 2001). In the radio band, we saw the source fading simultaneously at all frequencies (Fig. 1). Noticeable variations were seen also in the near-IR (Fig. 2). Note also that our SEDs (Fig. 3) show a dip between the near-IR and optical bands, in agreement with the observations by Neugebauer et al. (1979) in 1977 (data reported by NED, grey dots). In that case, however, the optical spectrum was quite harder and it seems that a much stronger emission component was present towards smaller wavelength. Such an increase in the spectrum of a quasar is commonly referred to thermal emission from an accretion disk (e.g. Bregman 1990), but in that case, although the observations are separated by years, the component should not be so strongly variable. A similar behaviour was observed in AO 0235+164, where a variable UV-to-soft-X-ray bump was found (Raiteri et al. 2005, 2006a, 2006b). In this case the authors speculate that the variability could be due to a strong change of e.g. the accretion rate. Another possibility would be the presence of another emission component, e.g. synchrotron radiation from an inner jet region with respect to that producing the radio–near-IR radiation. For 1510089 the latter explanation would be favoured by the noticeable optical variability also observed on short time scales (e.g. Raiteri et al. 1998). Further multi-wavelength monitoring will help to better characterize the behaviour of this component.
1641+399 (3C 345)
The quasar 3C 345 has been studied extensively at all accessible wavelength. The observed strong variability in the optical and radio bands, the existence of possible periodicities, and the detection of bent trajectories of the radio jet components, made this source particularly interesting to test jet precession and binary black hole models (e.g. Biretta et al. 1986; Caproni & Abraham 2004; Lobanov & Roland 2005; Lobanov & Zensus 1999; Schramm et al. 1993; Stevens et al. 1996; Webb et al. 1994. Our radio light curves are slowly declining (Fig. 1), but in the optical band a strong increase can be seen from the beginning of the last observing season (Fig. 2). This becomes even more evident by looking at the evolution of the SEDs (Fig. 3), specially when considering that the last four SEDs are separated by only a few weeks.
2200+420 (BL Lacertae)
This is the prototype of the BL Lac objects, which are well-known for their pronounced variability at all wavelengths, from the radio to the -ray band. BL Lac has been studied intensively since its discovery and was the target of several multi-wavelengths campaigns (Bloom et al. 1997; Sambruna et al. 1999; Madejski et al. 1999; Villata et al. 2002; Böttcher et al. 2003; Villata et al. 2004a, b). The radio emission appears well correlated, where variations at higher frequencies lead the lower-frequency ones by several days to a few months (e.g. Villata et al. 2004a). The detection of a fair correlation between the optical variations and the radio variability from the VLBI-core suggests a common origin in the inner portion of the jet (Bach et al. 2006b). A number of superluminal jet components have been observed displaying bent trajectories and speeds from 3 to (e.g. Mutel et al. 1990; Denn et al. 2000; Stirling et al. 2003; Kellermann et al. 2004; Jorstad et al. 2005). During our monitoring BL Lac showed its typical variability behaviour (Figs. 1 & 2). There are flares which are more pronounced at higher frequencies (including optical counter parts) and appear delayed at lower frequencies, and flares that are occurring contemporaneously and with comparable amplitudes, but appear only at radio wavelength. To construct the SED the optical flux densities of BL Lac were corrected for the contribution of the host galaxy using the -band value by Scarpa et al. (2000) () and deriving the other bands from the colour indices for elliptical galaxies with from Mannucci et al. (2001).
2230+114 (CTA 102)
This quasar shows the typical blazar behaviour and appears in the source lists of many radio and optical monitoring projects. Multi-wavelength monitoring and imaging revealed correlated variability and radio jet speeds of up to 21 were derived from VLBI observations (e.g. Rantakyrö et al. 2003). Our near-IR–optical light curve is dominated by a huge flare lasting more than a hundred days around October 2005 (Fig. 2), and we can follow now an ongoing radio flare (Fig. 1). The SEDs show impressively the change of the spectrum with the propagation of the flare towards lower frequencies (Fig. 3), similarly to the case of 2251+158 (see next paragraph).
2251+158 (3C 454.3)
This is another well-known quasar and also one of the brightest ones. The source is showing remarkable variability at all wavelengths, high degrees of polarization, superluminal motion of the radio jet components, and a X-ray jet (Cotton et al. 1984; Pauliny-Toth et al. 1987; Hartman et al. 1993). With the start of our monitoring 3C 454.3 underwent an exceptional optical outburst lasting for more than one year, subsequently followed by a radio flare (Figs. 1 & 2 and Fuhrmann et al. 2006; Villata et al. 2006). The maximum brightness detected was , which, at , represents the most luminous quasar state observed until today (, Villata et al. 2006). Therefore, the SED shows a remarkable variability and the propagation of the flare from higher to lower energies is clearly visible (Fig. 3). At the beginning of the rising phase the near-IR–optical spectrum appears rather flat and changes to a very steep one after the brightness peak was reached. The radio flare did not reach frequencies much below 15 GHz and, although some structural changes in the radio jet were detected, so far no jet component related to the outburst is visible (Marscher et al. 2007, in prep). A detailed analysis of the radio–optical correlations will be presented in an upcoming paper (Villata et al. in prep.).
6 Conclusions
During the first 18 months of our multi-wavelength monitoring we obtained about 4000 data points in the radio bands, at 5, 8, and 22 GHz, and 5500 near-IR and optical measurements.
Some of our sources were targets of observations by X-ray satellites and by ground-based TeV telescopes, and we contributed data to the multi-wavelength WEBT campaigns on 0235+164 (Raiteri et al. 2006b), OJ 287 (Ciprini et al. in prep.), 3C 279 (Böttcher et al. in prep.), BL Lac (Villata et al. in prep.), and 3C 454.3 (Villata et al. 2006; Villata et al. in prep; Raiteri et al. in prep.).
Most of the sources display significant variability on monthly time scales. Some sources show an achromatic variability behaviour, where the frequencies vary almost simultaneously, as e.g. 1510-089. In other cases the flux changes at the higher frequencies are likely leading lower-frequency ones, as for 1226+023 (3C 273) and 2251+158 (3C 454.3), where flares are visible at 22 GHz, but are not yet visible at 8 and 5 GHz. In the case of 2200+420 (BL Lac) we find both characteristics. A flare that is more pronounced at 22 GHz appeared in early 2005, and a second one equally bright at all frequencies appeared about 250 days later.
Many possible mechanisms which are able to explain the various variability behaviours are discussed in the literature (see Sect. 1 for references). They manly divide into geometrical models where changes of the viewing angle lead to variations of the Doppler beaming factor and models which propose changes of the physical parameters of the jet plasma itself. Because of the limited time interval covered by the present project, it is not possible yet to favour or rule out some of these models. Neither does it allow to perform a meaningful statistical analysis on the time scales of variability or on cross correlations among flux changes at different frequencies. However, the planned continuation of this multi-wavelength monitoring during the next years is expected to provide a wide database for our targets that will allow us to extract more information on the mechanisms at the origin of blazar emission variability.
Moreover, with the launch of AGILE and GLAST the GeV energy domain will be accessible and our monitoring will support the high-energy observations with low-energy data, to learn more about the inter-connection between the synchrotron and inverse-Compton components of blazar SEDs.
Acknowledgements.
We thank the referee, Esko Valtaoja, for his suggestions on improving the paper. We thank the staff at the Medicina and Noto radio observatories for their help and support during this monitoring. This work is based on observations with the Medicina and Noto telescopes operated by INAF - Istituto di Radioastronomia. AZT-24 telescope is operated under agreement between Pulkovo, Rome and Teramo observatories. This work is supported by the European Community’s Human Potential Programme under contract HPRCN-CT-2002-00321 (ENIGMA Network). St.Petersburg University team acknowledges support from Russian Federal Program for Basic Research under grant 05-02-17562. This research has made use of the NASA/IPAC Extragalactic Database (NED) which is operated by the Jet Propulsion Laboratory, California Institute of Technology, under contract with the National Aeronautics and Space Administration.References
- Agudo et al. (2006) Agudo, I., Krichbaum, T. P., Ungerechts, H., et al. 2006, A&A, submitted
- Aller et al. (1985) Aller, H. D., Aller, M. F., & Hughes, P. A. 1985, ApJ, 298, 296
- Aller et al. (2003) Aller, H. D., Aller, M. F., Latimer, G. E., & Hughes, P. A. 2003, American Astronomical Society Meeting, 202, 18.01
- Baars et al. (1977) Baars, J. W. M., Genzel, R., Pauliny-Toth, I. I. K., & Witzel, A. 1977, A&A, 61, 99
- Bach et al. (2006a) Bach, U., Krichbaum, T. P., Kraus, A., Witzel, A., & Zensus, J. A. 2006a, A&A, 452, 83
- Bach et al. (2005) Bach, U., Krichbaum, T. P., Ros, E., et al. 2005, A&A, 433, 815
- Bach et al. (2006b) Bach, U., Villata, M., Raiteri, C. M., et al. 2006b, A&A, 456, 105
- Begelman et al. (1980) Begelman, M. C., Blandford, R. D., & Rees, M. J. 1980, Nature, 287, 307
- Bessell et al. (1998) Bessell, M. S., Castelli, F., & Plez, B. 1998, A&A, 333, 231
- Biretta et al. (1986) Biretta, J. A., Moore, R. L., & Cohen, M. H. 1986, ApJ, 308, 93
- Bloom et al. (1997) Bloom, S. D., Bertsch, D. L., Hartman, R. C., et al. 1997, ApJ, 490, L145
- Bondi et al. (1996) Bondi, M., Padrielli, L., Fanti, R., et al. 1996, A&AS, 120, 89
- Böttcher et al. (2005) Böttcher, M., Harvey, J., Joshi, M., et al. 2005, ApJ, 631, 169
- Böttcher et al. (2003) Böttcher, M., Marscher, A. P., Ravasio, M., et al. 2003, ApJ, 596, 847
- Bregman (1990) Bregman, J. N. 1990, A&A Rev., 2, 125
- Camenzind & Krockenberger (1992) Camenzind, M. & Krockenberger, M. 1992, A&A, 255, 59
- Caproni & Abraham (2004) Caproni, A. & Abraham, Z. 2004, ApJ, 602, 625
- Cardelli et al. (1989) Cardelli, J. A., Clayton, G. C., & Mathis, J. S. 1989, ApJ, 345, 245
- Cotton et al. (1984) Cotton, W. D., Geldzahler, B. J., Marcaide, J. M., et al. 1984, ApJ, 286, 503
- Denn et al. (2000) Denn, G. R., Mutel, R. L., & Marscher, A. P. 2000, ApJS, 129, 61
- Fuhrmann et al. (2006) Fuhrmann, L., Cucchiara, A., Marchili, N., et al. 2006, A&A, 445, L1
- Gabuzda & Cawthorne (1996) Gabuzda, D. C. & Cawthorne, T. V. 1996, MNRAS, 283, 759
- Gabuzda et al. (2000) Gabuzda, D. C., Kochenov, P. Y., Kollgaard, R. I., & Cawthorne, T. V. 2000, MNRAS, 315, 229
- Grandi et al. (1996) Grandi, P., Urry, C. M., Maraschi, L., et al. 1996, ApJ, 459, 73
- Guetta et al. (2004) Guetta, D., Ghisellini, G., Lazzati, D., & Celotti, A. 2004, A&A, 421, 877
- Hartman et al. (1999) Hartman, R. C., Bertsch, D. L., Bloom, S. D., et al. 1999, ApJS, 123, 79
- Hartman et al. (1993) Hartman, R. C., Bertsch, D. L., Dingus, B. L., et al. 1993, ApJ, 407, L41
- Homan et al. (2001) Homan, D. C., Ojha, R., Wardle, J. F. C., et al. 2001, ApJ, 549, 840
- Hong et al. (2004) Hong, X. Y., Jiang, D. R., Gurvits, L. I., et al. 2004, A&A, 417, 887
- Jester et al. (2005) Jester, S., Röser, H.-J., Meisenheimer, K., & Perley, R. 2005, A&A, 431, 477
- Jorstad et al. (2005) Jorstad, S. G., Marscher, A. P., Lister, M. L., et al. 2005, AJ, 130, 1418
- Jorstad et al. (2001) Jorstad, S. G., Marscher, A. P., Mattox, J. R., et al. 2001, ApJS, 134, 181
- Kellermann et al. (2004) Kellermann, K. I., Lister, M. L., Homan, D. C., et al. 2004, ApJ, 609, 539
- Kollgaard et al. (1992) Kollgaard, R. I., Wardle, J. F. C., Roberts, D. H., & Gabuzda, D. C. 1992, AJ, 104, 1687
- Kovalev et al. (2002) Kovalev, Y. Y., Kovalev, Y. A., Nizhelsky, N. A., & Bogdantsov, A. B. 2002, Publications of the Astronomical Society of Australia, 19, 83
- Lainela et al. (1999) Lainela, M., Takalo, L. O., Sillanpää, A., et al. 1999, ApJ, 521, 561
- Landau et al. (1986) Landau, R., Golisch, B., Jones, T. J., et al. 1986, ApJ, 308, 78
- Lehto & Valtonen (1996) Lehto, H. J. & Valtonen, M. J. 1996, ApJ, 460, 207
- Lobanov & Roland (2005) Lobanov, A. P. & Roland, J. 2005, A&A, 431, 831
- Lobanov & Zensus (1999) Lobanov, A. P. & Zensus, J. A. 1999, ApJ, 521, 509
- Madejski et al. (1999) Madejski, G. M., Sikora, M., Jaffe, T., et al. 1999, ApJ, 521, 145
- Mannucci et al. (2001) Mannucci, F., Basile, F., Poggianti, B. M., et al. 2001, MNRAS, 326, 745
- Marscher (1996) Marscher, A. P. 1996, in ASP Conf. Ser. 100: Energy Transport in Radio Galaxies and Quasars, 45
- Marscher & Gear (1985) Marscher, A. P. & Gear, W. K. 1985, ApJ, 298, 114
- Massaro et al. (2004a) Massaro, E., Perri, M., Giommi, P., & Nesci, R. 2004a, A&A, 413, 489
- Massaro et al. (2004b) Massaro, E., Perri, M., Giommi, P., Nesci, R., & Verrecchia, F. 2004b, A&A, 422, 103
- McHardy et al. (1999) McHardy, I., Lawson, A., Newsam, A., et al. 1999, MNRAS, 310, 571
- Mutel et al. (1990) Mutel, R. L., Su, B., Bucciferro, R. R., & Phillips, R. B. 1990, ApJ, 352, 81
- Neugebauer et al. (1979) Neugebauer, G., Oke, J. B., Becklin, E. E., & Matthews, K. 1979, ApJ, 230, 79
- Ostorero et al. (2006) Ostorero, L., Wagner, S. J., Gracia, J., et al. 2006, A&A, 451, 797
- Ott et al. (1994) Ott, M., Witzel, A., Quirrenbach, A., et al. 1994, A&A, 284, 331
- Otterbein et al. (1998) Otterbein, K., Krichbaum, T. P., Kraus, A., et al. 1998, A&A, 334, 489
- Pauliny-Toth et al. (1987) Pauliny-Toth, I. I. K., Porcas, R. W., Zensus, J. A., Kellermann, K. I., & Wu, S. Y. 1987, Nature, 328, 778
- Pearson et al. (1981) Pearson, T. J., Unwin, S. C., Cohen, M. H., et al. 1981, Nature, 290, 365
- Perri et al. (2003) Perri, M., Massaro, E., Giommi, P., et al. 2003, A&A, 407, 453
- Pian et al. (2006) Pian, E., Foschini, L., Beckmann, V., et al. 2006, A&A, 449, L21
- Piner et al. (2006) Piner, B. G., Bhattarai, D., Edwards, P. G., & Jones, D. L. 2006, ApJ, 640, 196
- Raiteri et al. (1998) Raiteri, C. M., Ghisellini, G., Villata, M., et al. 1998, A&AS, 127, 445
- Raiteri et al. (2001) Raiteri, C. M., Villata, M., Aller, H. D., et al. 2001, A&A, 377, 396
- Raiteri et al. (2005) Raiteri, C. M., Villata, M., Ibrahimov, M. A., et al. 2005, A&A, 438, 39
- Raiteri et al. (2006a) Raiteri, C. M., Villata, M., Kadler, M., et al. 2006a, A&A, 452, 845
- Raiteri et al. (2006b) —. 2006b, A&A, in press
- Raiteri et al. (1999) Raiteri, C. M., Villata, M., Tosti, G., et al. 1999, A&A, 352, 19
- Raiteri et al. (2003) —. 2003, A&A, 402, 151
- Rantakyrö et al. (2003) Rantakyrö, F. T., Wiik, K., Tornikoski, M., Valtaoja, E., & Bååth, L. B. 2003, A&A, 405, 473
- Röser et al. (1996) Röser, H.-J., Conway, R. G., & Meisenheimer, K. 1996, A&A, 314, 414
- Sambruna et al. (1999) Sambruna, R. M., Ghisellini, G., Hooper, E., et al. 1999, ApJ, 515, 140
- Scarpa et al. (2000) Scarpa, R., Urry, C. M., Falomo, R., Pesce, J. E., & Treves, A. 2000, ApJ, 532, 740
- Schlegel et al. (1998) Schlegel, D. J., Finkbeiner, D. P., & Davis, M. 1998, ApJ, 500, 525
- Schramm et al. (1993) Schramm, K.-J., Borgeest, U., Camenzind, M., et al. 1993, A&A, 278, 391
- Sillanpää et al. (1988) Sillanpää, A., Haarala, S., Valtonen, M. J., Sundelius, B., & Byrd, G. G. 1988, ApJ, 325, 628
- Sillanpää et al. (1996) Sillanpää, A., Takalo, L. O., Pursimo, T., et al. 1996, A&A, 315, L13
- Singh et al. (1997) Singh, K. P., Shrader, C. R., & George, I. M. 1997, ApJ, 491, 515
- Spada et al. (2001) Spada, M., Ghisellini, G., Lazzati, D., & Celotti, A. 2001, MNRAS, 325, 1559
- Spergel et al. (2003) Spergel, D. N., Verde, L., Peiris, H. V., et al. 2003, ApJS, 148, 175
- Stevens et al. (1996) Stevens, J. A., Litchfield, S. J., Robson, E. I., et al. 1996, ApJ, 466, 158
- Stirling et al. (2003) Stirling, A. M., Cawthorne, T. V., Stevens, J. A., et al. 2003, MNRAS, 341, 405
- Teräsranta et al. (2004) Teräsranta, H., Achren, J., Hanski, M., et al. 2004, A&A, 427, 769
- Teräsranta et al. (1998) Teräsranta, H., Tornikoski, M., Mujunen, A., et al. 1998, A&AS, 132, 305
- Teräsranta et al. (2005) Teräsranta, H., Wiren, S., Koivisto, P., Saarinen, V., & Hovatta, T. 2005, A&A, 440, 409
- Urry (1999) Urry, C. M. 1999, Astroparticle Physics, 11, 159
- Valtaoja et al. (2000) Valtaoja, E., Teräsranta, H., Tornikoski, M., et al. 2000, ApJ, 531, 744
- Valtonen et al. (2006a) Valtonen, M. J., Lehto, H. J., Sillanpää, A., et al. 2006a, ApJ, 646, 36
- Valtonen et al. (2006b) Valtonen, M. J., Nilsson, K., Sillanpää, A., et al. 2006b, ApJ, 643, L9
- Venturi et al. (2001) Venturi, T., Dallacasa, D., Orfei, A., et al. 2001, A&A, 379, 755
- Villata & Raiteri (1999) Villata, M. & Raiteri, C. M. 1999, A&A, 347, 30
- Villata et al. (2004a) Villata, M., Raiteri, C. M., Aller, H. D., et al. 2004a, A&A, 424, 497
- Villata et al. (2006) Villata, M., Raiteri, C. M., Balonek, T. J., et al. 2006, A&A, 453, 817
- Villata et al. (2004b) Villata, M., Raiteri, C. M., Kurtanidze, O. M., et al. 2004b, A&A, 421, 103
- Villata et al. (2002) —. 2002, A&A, 390, 407
- Villata et al. (1998) Villata, M., Raiteri, C. M., Sillanpaa, A., & Takalo, L. O. 1998, MNRAS, 293, L13
- von Montigny et al. (1997) von Montigny, C., Aller, H., Aller, M., et al. 1997, ApJ, 483, 161
- Wagner & Witzel (1995) Wagner, S. J. & Witzel, A. 1995, ARA&A, 33, 163
- Wagner et al. (1996) Wagner, S. J., Witzel, A., Heidt, J., et al. 1996, AJ, 111, 2187
- Wagner et al. (1993) Wagner, S. J., Witzel, A., Krichbaum, T. P., et al. 1993, A&A, 271, 344
- Webb et al. (1994) Webb, J. R., Shrader, C. R., Balonek, T. J., et al. 1994, ApJ, 422, 570
- Wehrle et al. (1998) Wehrle, A. E., Pian, E., Urry, C. M., et al. 1998, ApJ, 497, 178
- Whitney et al. (1971) Whitney, A. R., Shapiro, I. I., Rogers, A. E. E., et al. 1971, Science, 173, 225
- Wills et al. (1983) Wills, B. J., Pollock, J. T., Aller, H. D., et al. 1983, ApJ, 274, 62
- Wills et al. (1992) Wills, B. J., Wills, D., Breger, M., Antonucci, R. R. J., & Barvainis, R. 1992, ApJ, 398, 454