Relation between the luminosity of young stellar objects and their circumstellar environment
Abstract
We present a new model-independent method of comparison of near-infrared (NIR) visibility data of young stellar objects (YSOs). The method is based on scaling the measured baseline with the YSO’s distance and luminosity, which removes the dependence of visibility on these two variables. We use this method to compare all available NIR visibility data and demonstrate that it distinguishes YSOs of luminosity (low-L) from YSOs of (high-L). This confirms earlier suggestions, based on fits of image models to the visibility data, for the difference between the NIR sizes of these two luminosity groups (Eisner et al., 2004; Monnier et al., 2005). When plotted against the “scaled” baseline, the visibility creates the following data clusters: low-L Herbig Ae/Be stars, T Tauri stars, and high-L Herbig Be stars. The T Tau cluster is similar to the low-L Herbig Ae/Be cluster, which has 7 times smaller “scaled” baselines than the high-L Herbig Be cluster. We model the shape and size of clusters with different image models and find that low-L Herbig stars are the best explained by the uniform brightness ring and the halo model, T Tauri stars with the halo model, and high-L Herbig stars with the accretion disk model. However, the plausibility of each model is not well established. Therefore, we try to build a descriptive model of the circumstellar environment consistent with various observed properties of YSOs. We argue that low-L YSOs have optically thick disks with the optically thin inner dust sublimation cavity and an optically thin dusty outflow above the inner disk regions. High-L YSOs have optically thick accretion disks with high accretion rates enabling gas to dominate the NIR emission over dust. Although observations would favor such a description of YSOs, the required dust distribution is not supported by our current understanding of dust dynamics.
Subject headings:
accretion, accretion disks — circumstellar matter — instrumentation: interferometers — radiative transfer — stars: formation — stars: pre-main-sequence1. Introduction
Young stellar objects (YSOs) are surrounded by dust and gas leftovers from the process of star formation. Observations have revealed that this material concentrates into a (protoplanetary) disk accreting toward the central star. The disk undergoes the process of dust and gas coagulation and formation of larger objects, eventually resulting in a planetary system. Hence, YSOs are of a topical astronomical interest because they can help us understand how planetary systems form and evolve.
Dust in the disk is very efficient in absorbing the stellar radiation. It makes the disk appear optically thick until the dust is either removed or coagulated into larger objects. Dust is also a very efficient tracer of protoplanetary disks in infrared, where dust reemits the energy that it absorbed from the star. Direct imaging has proved to be especially useful in unraveling properties of YSOs. Depending on the wavelength, images capture different temperature zones and optical depths of the protoplanetary dusty disk. From the terrestrial planet formation perspective, the most interesting is the inner few AU of the disk. In this zone dust temperatures can reach a thousand degrees or more. At these temperatures dust either sublimates or becomes heavily thermally processed, and it emits in the near-infrared (NIR). Unfortunately, the angular size of this zone is on the miliarcseconds scale and until recently unresolvable.
Thanks to advances in NIR interferometry (e.g. Monnier, 2003), the inner regions of many YSO disks have been resolved to date. One of the first surprises coming out of these observations is a significantly larger NIR size than previously predicted from theoretical models of accretion disks (Monnier & Millan-Gabet, 2002; Tuthill et al., 2001). This led to revisions of the existing theories of disk structure by invoking an optically thin inner disk hole around the star. The hole is clear of dust because of its sublimation, while the gas is unable to provide a considerable optical thickness. On the other hand, the spectrum shows that the inner disk emits much more NIR flux than expected from a simple flat disk. This directly implies that the disk structure has to flare up in the zone where it reaches its dust sublimation temperature (1500-2000K) in order to increase its NIR emitting area. Such a model was described by Dullemond, Dominik, & Natta (2001), where the disk is vertically puffed up at the inner disk rim because of the direct stellar heating of the disk interior.
Unfortunately, the NIR interferometric observations were capable of providing only the characteristic size of the emitting region, but they were not good enough to constrain the exact geometry of this region. It is only the most recent observations that manage to make a step further and detect deviations from simple centrally symmetric images (Monnier et al., 2006). These deviations turned out to be surprisingly small, unlike strong brightness asymmetries predicted by inclined disk models of Dullemond, Dominik, & Natta (2001). Such a result favors a derivative of this model where the inner disk rim does not create a vertically flat wall, but rather a curved surface (Isella & Natta, 2005). In addition, it is still not clear from the data if an additional dusty wind component coexists with the disk and contributes to the images and NIR flux. According to Vinković et al. (2006), such an optically thin halo around the inner disk can completely explain the NIR flux without a need for the disk puffing.
Another major result coming out of the NIR interferometric data is the dependence of inner disk size on luminosity (Monnier & Millan-Gabet, 2002; Monnier et al., 2005). The size was derived by fitting ad hoc uniform brightness ring image models to the measured visibilities. The inner ring radius , which is assumed to be the dust sublimation radius of the disk, is plotted against the luminosity of the observed object. The expected trend is followed by YSOs of , with sublimation temperatures between 1000 K and 1500 K. Objects with deviate from this trend by having considerably smaller inner radius than expected. Monnier et al. (2005) argue that high luminosity objects have optically thick gas within the inner dust-free disk hole. This would shield the dust from direct stellar heating and enable the dust to survive closer to the star, resulting with a smaller inner ring radius.
The basic approach in these studies is to use predefined theoretical models and correlate the object’s luminosity with a model parameter derived from fitting the model to the visibility data. This inevitably leads to questions on the validity of the model and conclusions derived from it. This is especially true for models of inner disk, considering large uncertainties about the inner disk geometry and dust properties. In this paper we propose an approach that can detect visibility dependence on luminosity without invoking any model of dust geometry. The approach is based on scaling the baseline value such that all objects seemingly appear located at the same distance from us and have the same luminosity.
We collected all available NIR visibility data on YSOs (13 T Tau, 27
Herbig Ae/Be and 4 FU Ori stars) in the literature and in
§2 we compared their scaled visibilities. We confirm
that the circumstellar environment of objects with
differs from less luminous objects, with high
luminous objects showing smaller structures. After that in
§3 we plot scaled theoretical visibilities
of uniform brightness ring, dusty halo, and accretion disk over the
scaled measured visibilities and explore the range of model parameters
that are needed for accommodating all the data. In
§4 we present an extensive discussion of
various observational aspects of YSOs, with a special attention given
to the differences between low- and high-luminous YSOs. We try to
sketch a self-consistent model that would explain various observed
properties of YSOs. The summary of the paper is given in
§5.


2. YSO visibilities with scaled baselines
Studies of the relation between YSO luminosities and their NIR visibilities have been based on fitting the constant surface brightness ring image model to the visibility data. The obtained inner ring radius is then correlated with the luminosity, where the basic assumption is that this radius is equivalent to the dust sublimation distance from the star (Monnier & Millan-Gabet, 2002; Eisner et al., 2004; Monnier et al., 2005; Akeson et al., 2005a). A slightly different approach is used by Vinković et al. (2006) who use a dusty halo model, but the approach is still based on obtaining the sublimation radius from the fit to visibility data. Using this approach, Eisner et al. (2004) and Monnier et al. (2005) showed that YSOs with luminosity 10 have a significantly smaller inner ring radius than less luminous objects.
It is, however, not clear if the ring model is a plausible model for fitting the visibility. The NIR disk surface brightness is not a uniform ring, but a complicated function that critically depends on dust emission and scattering properties and the disk optical depth structure. Moreover, Vinković et al. (2006) used a halo model and obtained a significantly smaller scatter of inner halo radius with luminosity. Here we show that, when exploring correlations between luminosity and visibility data, all uncertainties due to different models of circumstellar dust properties and geometry can be avoided by model independent scaling of visibility.
The visibility is a function of the spatial frequency , also called baseline. It consists of two individual additive visibilities: stellar and diffuse. The stellar contribution to the NIR visibility at currently used baselines is a constant because the star remains unresolved. The NIR diffuse part is a contribution from the circumstellar dust emission and scattering, while the gas brightness can be neglected (we will see later on that this is not true for luminous YSOs).
The diffuse visibility critically depends on two parameters: i) distance to the object, which affects the angular size of the image on the sky, and ii) physical size of the object, which is controlled by dust radiative transfer. The equations of dust radiative transfer have powerful intrinsic scaling properties according to which luminosity and linear dimensions are irrelevant for solving the equations (Ivezić & Elitzur, 1997). Overall luminosity is never an input parameter: only the source spectral shape is important. Also, absolute scales of dust densities and distances are irrelevant: only the optical depth, geometrical angles, relative thicknesses and aspect ratios enter the equations. Luminosity is important only when we need to translate dimensionless radiative transfer solutions to physical units, where physical dimensions scale with (equation 27 in Ivezić & Elitzur, 1997).
When comparing intrinsic properties of the circumstellar dust geometry of two objects in the sky, we want to make sure that detected size differences are not due to: a) differences in distances, and b) size scaling due to different luminosities. Therefore, we first need to scale objects to the same luminosity and to the same distance. Visibility of an image is inversely proportional to the characteristic angular size of the image (Ivezić & Elitzur, 1996). In turn, the angular size is inversely proportional to distance , but, as we argue from the radiative transfer scaling properties, proportional to . Hence, we define the scaled baseline
| (1) |
which has the same physical units like the ordinary baseline, but it removes the intrinsic dependence on distance and radiative transfer scaling.
Although this scaling can be postulated for any system, it is meaningful only for systems with a central heating source. Binary systems, for example, can have entirely different scaling properties. Notice, however, that the method is useful for disks with significant accretion luminosities because the most of accretion luminosity comes from the accretion shock. Hence, the dust in such disks is exposed primarily to the sum of stellar and accretion luminosity and this sum should replace the luminosity factor in equation 1.
We collected all objects with available H- and K-band visibility data and list them in Table 1: 13 objects classified as T Tauri stars, 27 Herbig Ae/Be stars and 4 FU Orionis objects. We excluded from the list objects that are most probably B[e] supergiants (MWC 349A, MWC342, HD45677, HD58647) and show them separately only for illustration. Since the goal is to compare overall trends in visibility, we average the visibility data within bins of about 0.5 in objects that have many measurements taken at similar baselines (the lower and upper visibility limits are shown in the table when applicable). For a more detailed view of the visibility data in individual objects, we suggest following the references given in the table.
Figures 1 and 2 show the visibility data when plotted against the scaled baseline. The difference between low luminosity (, low-L) and high luminosity (, high-L) Hebig Ae/Be objects is now clearly visible. It is important to emphasize that this is a model independent detection of intrinsic differences between the circumstellar environments of low-L and high-L objects. Clustering is evident in low-L Herbig Ae/Be stars and T Tau stars, while high-L objects cluster at significantly larger scaled baselines (except for LkH 101). The only exception are FU Ori objects, which appear more similar to high-L Herbig Be stars than to their older counterparts - T Tau stars. This suggests possible similarities in circumstellar geometry between these two types of objects. We address this issue in §3.3.2.
Figure 2 indicates a slight difference between zones of T Tau clustering and low-L Herbig Ae/Be clustering. This is a result of differences in the stellar spectral shape, where T Tau stars contribute relatively more to the NIR flux then Herbig Ae/Be stars. How that influences the scaled visibility curves will be more apparent in the next section when we plot theoretical models over the data.
Trends in Figures 1 and 2 are so strong that we can use them to identify two anomalous individual cases:
| Visibility Averages | ||||||
|---|---|---|---|---|---|---|
| Object Names | Distance (pc) | Luminosity () | Baseline (M) | H band | K band | Reference(s) |
| T Tau OBJECTS | ||||||
| LkCa 15 | 14214 (1) | 0.74 (2) | 35.5 | 0.95 | 2 | |
| BP Tau | 14214 (1) | 0.83 (2) | 37.5 | 0.93 | 2 | |
| DR Tau | 14214 (1) | 1.280.50 (51) | 38.0 | 0.84-1.03 | 3 | |
| 48.9 | 0.87-0.95 | |||||
| GM Aur | 14214 (1) | 1.01 (2) | 33.3 | 0.93 | 2 | |
| AS 205A | 16520 (5) | 7.86.5 (4) | 25.0 | 0.66-0.97 | 4 | |
| 37.0 | 0.79-0.85 | |||||
| HD143006 | 9435 (6) | 1.40.5 (6) | 25.5 | 0.93 | 6 | |
| 26.9 | 0.97 | |||||
| RW Aur | 14214 (1) | 1.7 (2) | 39.0 | 0.78 | 2 | |
| AS 207A | 16520 (5) | 2.90.2 (4) | 25.5 | 0.79-0.96 | 4 | |
| V2508 Oph | 16520 (5) | 4.10.8 (4) | 27.0 | 0.77-1.00 | 4 | |
| DG Tau | 14214 (1) | 3.62 (2) | 38.8 | 0.57-0.65 | 2,7 | |
| T Tau N | 14214 (1) | 7.3 (52) | 38.5 | 0.48-0.77 | 3,8,9 | |
| 48.5 | 0.32-0.80 | |||||
| RY Tau | 14214 (1) | 107(10,51) | 6.0 | 0.85-0.95 | 3,10 | |
| 17.5 | 0.75-0.82 | |||||
| 38.5 | 0.52-0.70 | |||||
| 49.5 | 0.16-0.55 | |||||
| SU Aur | 14214 (1) | 13.50.7 (51) | 38.0 | 0.64-1.04 | 3,8,9 | |
| 49.5 | 0.55-0.95 | |||||
| Herbig Ae/Be OBJECTS | ||||||
| PX Vul | 420 (11) | 26.212.5 (4) | 38.5 | 0.75-0.92 | 4 | |
| CQ Tau | 10421 (12) | 4.23.8 (12,45) | 38.0 | 0.55-0.67 | 13 | |
| 48.5 | 0.59-0.67 | |||||
| HD142666 | 116 (14) | 8.82.5 (6) | 34.1 | 0.78 | 6 | |
| 36.3 | 0.67-0.77 | |||||
| 37.5 | 0.75 | |||||
| HD144432 | 145 (15) | 14.54.0 (10,6) | 6.0 | 0.95-1.00 | 10,6 | |
| 14.0 | 0.87-0.93 | |||||
| 33.5 | 0.59-0.63 | |||||
| HD36112 (MWC758) | 21050 (12) | 2712 (12,6) | 38.9 | 0.53-0.67 | 13,6 | |
| 48.5 | 0.44-0.50 | |||||
| HD163296 (MWC275) | 12415 (12) | 408 (10,6) | 7.0 | 0.87-0.98 | 10,6,16 | |
| 12.5 | 0.83-0.91 | |||||
| 15.0 | 0.78-0.91 | |||||
| 34.9 | 0.42-0.50 | |||||
| UX Ori | 40060 (18) | 42.511.5 (17) | 38.9 | 0.69 | 6 | |
| HD31648 (MWC480) | 13421 (12) | 2818 (10,12) | 12.5 | 0.90-0.95 | 10,13 | |
| 23.0 | 0.75-0.80 | |||||
| 38.0 | 0.41-0.55 | |||||
| HD150193 (MWC863) | 13421 (12) | 2818 (6,10) | 6.0 | 0.90-0.97 | 6,10,16 | |
| 7.5 | 0.78-1.00 | |||||
| 12.5 | 0.70-0.85 | |||||
| 15.0 | 0.62-0.86 | |||||
| 17.5 | 0.75-0.78 | |||||
| 34.8 | 0.43-0.48 | |||||
| AB Aur | 14720 (12) | 5114 (12) | 7.5 | 0.90-0.95 | 16,13,19,10,20 | |
| 9.6 | 0.83-0.87 | |||||
| 10.0 | 0.84-0.95 | |||||
| 12.5 | 0.80-0.92 | |||||
| 15.0 | 0.75-0.85 | |||||
| 17.5 | 0.70-0.77 | 0.57-0.72 | ||||
| 20.0 | 0.67-0.77 | |||||
| 22.5 | 0.58-0.75 | |||||
| 35.0 | 0.41 | |||||
| 39.0 | 0.3 | |||||
| HD344361 (WW Vul) | 550 (21) | 655 (18) | 38.2 | 0.71-0.84 | 6 | |
| V1295 Aql (MWC325, | 290a (12) | 7310 (10,12,22) | 10.0 | 0.95-1.02 | 16,13,10,23 | |
| HD190073) | 14.0 | 0.87-0.92 | ||||
| 21.0 | 0.68-0.89 | |||||
| 37.0 | 0.42 | |||||
| 51.0 | 0.00-0.45 | |||||
| T Ori | 460 (18) | 83 (18) | 38.0 | 0.71-0.87 | 13 | |
| VV Ser | 350100 (18,24,25,26) | 4320 (18,27) | 38.0 | 0.54-0.71 | 13,19 | |
| 45.0 | 0.32-0.55 | |||||
| Visibility Averages | ||||||
|---|---|---|---|---|---|---|
| Object Names | Distance (pc) | Luminosity () | Baseline (M) | H band | K band | Reference(s) |
| V1578Cyg (AS477) | 900 (28) | 15420 (18) | 38.1 | 0.79-0.85 | 6 | |
| V1977Cyg (AS442) | 700 (29) | 300210 (6) | 38.3 | 0.30-0.95 | 6,13,19 | |
| 49.0 | 0.45-0.90 | |||||
| MWC419 (V594 Cas) | 650 (18) | 330 (18) | 39.5 | 0.60-0.66 | 23 | |
| MWC614 (HD179218) | 25555 (12) | 10035b (10) | 11.0 | 0.65 | 16,23,10 | |
| 14.0 | 0.62 | |||||
| 22.0 | 0.62 | |||||
| 40.0 | 0.0-0.45 | |||||
| 51.0 | 0.0-0.45 | |||||
| MWC120 (HD37806) | 360130 (12,30) | 10068 (12,30) | 38.0 | 0.35 | 13 | |
| LkH 101 | 340c (31,32) | 90005700c (31,32) | 0.5 | 0.95-1.05 | 0.95-1.0 | 32 |
| 1.0 | 0.85-0.95 | 0.85-0.95 | ||||
| 1.5 | 0.75-0.85 | 0.65-0.75 | ||||
| 2.0 | 0.60-0.70 | 0.45-0.55 | ||||
| 2.5 | 0.45-0.55 | 0.30-0.40 | ||||
| 3.0 | 0.30-0.40 | 0.15-0.25 | ||||
| 3.5 | 0.20-0.30 | 0.05-0.15 | ||||
| 4.0 | 0.15-0.25 | |||||
| V380 Ori | 44515 (18,30) | 10116 (18,33) | 11.0 | 0.96 | 16 | |
| 24.5 | 0.82-0.88 | |||||
| MWC147 (HD259431) | 800 (18) | 6300 (18) | 21.0 | 0.90 | 16,8,23 | |
| 22.0 | 0.98 | 1.00 | ||||
| 23.5 | 1.00 | |||||
| 39.5 | 0.75-0.78 | |||||
| 50.0 | 0.71-0.76 | |||||
| V1685Cyg (MWC340, | 1000 (18,19,34,35,36) | 50002000 (18,37) | 23.0 | 0.75-0.85 | 6,13,16,19 | |
| BD+40∘4124) | 38.0 | 0.59-0.74 | ||||
| 49.0 | 0.39-0.84 | |||||
| MWC297 (NZ Ser) | 25050 (38) | 33000d13000 (10,18,38) | 7.5 | 0.86-0.92 | 10,13,16,23,39 | |
| 10.0 | 0.81-0.97 | |||||
| 12.5 | 0.71-0.81 | |||||
| 15.0 | 0.67-0.70 | |||||
| 17.5 | 0.63-0.74 | |||||
| 20.0 | 0.50-0.67 | |||||
| 21.0 | 0.39-0.58 | |||||
| 39.0 | 0.00-0.45 | |||||
| 51.0 | 0.00-0.45 | |||||
| MWC1080 | 1600600 (18,40) | 10400076000 (10,18,27) | 5.0 | 0.95-1.00 | 10,13,16,19 | |
| 7.0 | 0.97-1.09 | |||||
| 16.0 | 0.93-0.96 | |||||
| 17.0 | 0.75-0.88 | |||||
| 20.0 | 0.72-0.84 | |||||
| 38.0 | 0.45-0.55 | |||||
| MWC166 (HD53367) | 1150 (18) | 14500095000 (18,10,41) | 10.0 | 0.84-1.00 | 10,16 | |
| 12.0 | 0.87-0.92 | |||||
| 17.0 | 0.80-0.92 | |||||
| Z CMa A | 110050 (11,43,44) | 333000268000 (42) | 27.4 | 0.42 | 6 | |
| 29.0 | 0.43 | |||||
| FU Ori OBJECTSe | ||||||
| FU Ori | 450 (44) | 42080 (44,46) | 9.6 | 0.88-1.01 | 47,48 | |
| 12.3 | 0.93-1.06 | |||||
| 15.9 | 0.94-1.03 | |||||
| 21.3 | 0.88-1.03 | |||||
| 38.6 | 0.86-0.95 | |||||
| 41.5 | 0.91-0.96 | |||||
| 47.5 | 0.80-0.89 | |||||
| 52.2 | 0.86-0.92 | |||||
| 63.2 | 0.89-0.93 | |||||
| V1515 Cyg | 1000200 (44) | 17575 (44,46) | 36.7 | 0.84-0.92 | 49 | |
| V1057 Cyg | 550100 (50) | 525275 (44,46) | 38.5 | 0.77-0.89 | 23,49 | |
| ZCMa SE | 110050 (11,43,44) | 51090 (44,46) | 26.3 | 0.40-0.42 | 49 | |
Note. — References: (1) Wichmann et al. (1998), (2) Akeson et al. (2005a), (3) Akeson et al. (2005b), (4) Eisner et al. (2005), (5) Chini (1981), (6) Monnier et al. (2005), (7) Colavita et al. (2003), (8) Akeson et al. (2000), (9) Akeson et al. (2002), (10) Monnier et al. (2006), (11) Herbst et al. (1982), (12) van den Ancker et al. (1998), (13) Eisner et al. (2004), (14) Meeus et al. (2001), (15) Pérez et al. (2004), (16) Millan-Gabet et al. (2001), (17) Hernández et al. (2004), (18) Hillenbrand et al. (1992), (19) Eisner et al. (2003), (20) Millan-Gabet et al. (1999), (21) Friedemann et al. (1993), (22) Acke et al. (2005), (23) Wilkin & Akeson (2003), (24) Chavarria-K. et al. (1988), (25) de Lara et al. (1991), (26) Strom et al. (1974), (27) Acke & van den Ancker (2004), (28) Lada (1985), (29) Terranegra et al. (1994), (30) Warren & Hesser (1978), (31) Herbig et al. (2004), (32) Tuthill et al. (2002), (33) Testi et al. (1998), (34) Lorenzetti et al. (2002), (35) Shevchenko et al. (1991), (36) Strom et al. (1972), (37) van den Ancker et al. (2000), (38) Drew et al. (1997), (39) Malbet et al. (2006), (40) Levreault (1988), (41) Berrilli et al. (1992), (42) van den Ancker et al. (2004), (43) Claria (1974), (44) Hartmann & Kenyon (1996), (45) Mannings & Sargent (1997), (46) Sandell & Weintraub (2001), (47) Malbet et al. (2005), (48) Malbet et al. (1998), (49) Millan-Gabet et al. (2006b), (50) Straizys et al. (1989), (51) Muzerolle et al. (2003), (52) White & Ghez (2001)
LkH 101: Unlike other high-L objects, LkH 101 shows a much smaller visibility with the scaled baseline, smaller even than low-L objects. This indicates a larger NIR emitting area than in other YSOs. This object was one of the first YSOs imaged with the NIR interferometry (Tuthill et al., 2001) and it played an important role in establishing the existence of the inner disk clearing (Tuthill et al., 2002). Prior to the advent of NIR interferometry, the canonical model of the inner protoplanetary disk was a power-law accretion disk model. Images of LkH 101 reconstructed from aperture masking interferometry data showed clearly that this object has a central clearing in the disk (Tuthill et al., 2002). The clearing was attributed to dust sublimation and LkH 101 became a prototype example of this new disk concept. Our scaled visibilities show that this object differs from other YSOs studied to date, although the existence of inner clearing has been confirmed in other objects. It is possible that this object is indeed more similar to the low-L objects than high-L objects. There is a large uncertainty in the luminosity, distance and evolutionary status of this object. Notice, however, that our scaled baseline in equation 1 is not affected by luminosity changes caused by changes in measured distance. There has to be an intrinsic error in luminosity to change the scaled baseline. For the most recent review of this object see Herbig et al. (2004).
MWC 614: This objects shows a flat visibility, which means it is completely resolved at all used baselines. This indicates a much larger structure than other low-L objects. Monnier et al. (2006) suggest the possibility of a companion star at about 1′′ distance, which would lead to an overestimate of the size of the emission region.
We excluded from this analysis objects that are most probably B[e] supergiants (MWC 349A: Danchi et al. (2001); Hofmann et al. (2002); MWC 342: Miroshnichenko & Corporon (1999); HD45677: Monnier et al. (2006); de Winter & van den Ancker (1997); HD58647: Monnier et al. (2005); Manoj et al. (2002)). Their basic stellar parameters are shown in Table 2 and their scaled visibilities in Figure 3. When compared with YSOs, these objects do not fit into the clustering scheme recognized in Figures 1 and 2.
3. Theoretical interpretations
Clustering of scaled visibility indicates very similar images, hence presumably similar dust geometry. Variations in the model parameters should explain the cluster location, size and shape. The advantage of modeling a cluster instead of individual objects is that here we can address the common properties of these types of objects without being misled by potential peculiarities of individual objects. We apply several different types of image models and discuss their constrains on the dust geometry based on fits to the data clusters.
3.1. Uniform brightness ring
A uniform brightness ring emerged as a prototype image model of NIR interferometry data. It assumes emission from a constant temperature disk with a central hole, which gives a ring of constant surface brightness. The inner radius of the ring is attributed to the dust sublimation, while the outer radius is derived from the total ring area required by the measured NIR photometric flux. Physical justification for this image configuration was found in the puffed up inner disk model (Dullemond, Dominik, & Natta, 2001). The most recent NIR interferometry measurements of the image departures from centrosymmetry (Monnier et al., 2006) do not support the original version of the puffed up model, but prefer its more recent derivative by Isella & Natta (2005).
The visibility function for a uniform brightness ring (along its major or minor axis when inclined) combined with an unresolved star is (see Millan-Gabet et al. (2001) or Eisner et al. (2004) for details)
| (2) |
| (3) |
where is the Bessel function and the variables are: = fractional contribution of the stellar component to the total observed flux at the given NIR wavelength , = ring inclination angle, and , = inner and outer ring size.
| Object | Distance | Luminosity | Visibility |
|---|---|---|---|
| (pc) | () | Reference | |
| HD58647 | 29565 (1) | 29550 (2) | 2 |
| HD45677 | 1000500 (3) | 140007000 (4) | 4 |
| MWC349 A | 1200 (5) | 5500025000 (5,6) | 6,7 |
| MWC342 | 1000 (8) | 3150016500 (4,8) | 4 |


The inner ring radius is controlled by dust sublimation and grain size. Cooling of smaller grains is less efficient than bigger grains, hence bigger grains survive closer to the star. Vinković (2006) has shown analytically that in optically thick disks made of a mixture of grain sizes, the inner radius is dictated by the largest grains in the mix. They provide shielding of smaller grains from direct stellar radiation, which allows smaller grains to move closer to the star. The inner disk radius of optically thick disks is, therefore, controlled by the largest grains, that is, by their sublimation. The most efficient cooling in NIR is archived by big (micron size or larger) grains because of their gray opacity in NIR and shorter wavelengths. For that reason, big grains reach the minimal possible dust distance from the star. Mid-infrared spectroscopy of YSOs shows that the presence of big grains is a typical feature of circumstellar dust in these objects (e.g. van Boekel et al., 2003; Przygodda et al., 2003; van Boekel et al., 2005). Thus, the inner disk radius in YSOs is uniquely defined by gray dust grains.
On the other hand, dust sublimation does not provide a unique solution to the inner radius of protoplanetary disks because we lack constrains on the exact density structure of these disks. Dust dynamics, growth and sublimation can make the most inner part of the disk vertically optically thin and allow more efficient cooling of the disk. This reduces the local diffuse radiation and enables the optically thin zone of the inner disk to extend much closer to the star than the optically thick part of the disk. Hence, the inner disk radius due to gray dust of temperature is (Vinković, 2006)
| (4) |
where depends on the details of the disk structure and radiative transfer and can be as low as for optically thin inner disks or the maximum of in the case of entirely optically thick disks. In objects with a non-negligible accretion, should be replaced with . The scaled baseline (equation 1) is introduced from equation 4 by considering the disk size at 1pc and 1L⊙
| (5) |
The stellar size follows directly from , while the outer disk size is derived from the requirement of the total flux being a sum of the stellar and ring component (i.e., )
| (6) |
where is the Planck function and is the stellar temperature. Now we can explore the range of parameter values constrained by the visibility clusters. We do not discuss this model for high-L objects because no satisfactory fit is possible.

3.1.1 Inclination
The clusters are expected to spread in size because of randomization of observed disk inclinations. With equation 2 we address only the major and minor axes, which are the image extremes, while the orientation of baselines can exist in between these two position angles. Nonetheless, observations are usually performed within a range of position angles, which increases the chance of covering the image extremes. These scans of position angles are usually incorporated in the visibility vertical error bars.
We apply equation 2 to the low-L Herbig Ae/Be cluster and T Tauri cluster. We use the dust sublimation temperature of 1500K and the optically thick disk of . The stellar temperatures are 10000K for Herbig stars and 5000K for T Tau stars. The fraction of stellar flux at different wavelengths depends on spectral shapes of stellar and diffuse radiation. Instead of letting this be a free parameter, we use observed spectral energy distributions (SEDs) of YSOs to constrain its value. This way we actually fit the observed diffuse flux level (relative to the stellar flux level), which is needed for realistic modeling of both the circumstellar geometry and the SEDs. Observations show that the fraction of stellar flux in low-L Herbig Ae/Be stars is in the range 0.2-0.6 in H-band and 0.1-0.3 in K-band (Millan-Gabet et al., 2001; Vinković et al., 2006), while for classical T Tauri stars it is 0.3-0.7 in K-band (Cieza et al., 2005). Therefore, we choose medium values of 0.4, 0.2, and 0.5, respectively.
Comparison of models with the data is shown in Figure 4. Herbig Ae/Be clusters are nicely reproduced with this model for the range of inclination angles between 0∘ and 60∘. The model fails in the T Tau cluster. These objects appear larger than expected from the model and only unrealistically small (i.e., inconsistent with observations) values of =0.1-0.2 can reproduce the cluster size. This is consistent with the findings of Akeson et al. (2005a), who performed a similar study and concluded that some T Tau stars appear bigger than the expected dust sublimation radius. There is also no positive correlation between size and accretion, just on the contrary, the opposite trend (decreasing size with increasing contribution of accretion luminosity) has been reported by Akeson et al. (2005a). Hence, we conclude that this model cannot provide a satisfactory explanation of the T Tau data cluster, and we continue with only addressing model parameters in low-L Herbig Ae/Be stars.
Interestingly enough, the inclination angles up to 60∘ are sufficient to explain the low-L cluster size even though we have not yet varied other parameters. Since we expect other parameters to spread the model further, this might be an indication of images appearing as if they had inclination angles in a smaller range than expected from random orientations. We address this issue further below.
3.1.2 Stellar flux fraction and dust sublimation
Next we explore the above mentioned limits in the stellar flux fraction. Figure 5 shows models with limiting values of combined with disk inclinations. Combining low with low and high with high brings up extremes in visibility functions. Comparison with the data shows that clusters appear slightly more compact than these limits, but this could be just the result of a small dataset. However, freedom in choosing the disk temperature (i.e., dust sublimation temperature) results in large model deviations from the data, as shown in Figure 5. The temperature of 2000K is often suggested to explain the data in some individual objects, but when it comes to explaining the collective dataset, then the temperature of 1500K emerges as the most plausible choice, assuming that visibility data clusters are indeed a result of very similar physical conditions in all these objects.
3.1.3 Stellar temperature and disk opacity
Objects comprising the data clusters have a range of stellar temperature from 7500K to 12000K for low-L Herbig Ae/Be stars. Figure 6 shows how this spread in temperature affects the model. Since the stellar spectrum at these temperatures peaks at wavelengths shorter than NIR, changes in the stellar temperature do not have a significant effect on the NIR images. Differences of these models from the 10000K models in Figure 5 are small and conclusions from §3.1.2 also hold here.
In addition, we explore the possibility of an optically thin inner disk and apply to these models. Figure 7 shows that optically thin disks would be an option if disks are almost face on, but not when the whole cluster of visibility data is considered. Since is the minimal possible value, maybe some intermediate () values exist. However, the NIR excess in Herbig Ae/Be stars cannot be explained by optically thin disks alone. Instead, an additional circumstellar structure, such as a puffed up disk or a dusty halo, has to be invoked to reproduce the observed amounts of NIR flux (Vinković et al., 2006).


3.2. Dusty halo
An alternative model to disk geometries is a dusty halo around the disk inner regions. Compact (10 AU) optically thin halos have been invoked to explain the NIR spectrum of Herbig Ae/Be stars and their NIR visibility (Johns-Krull & Valenti, 2001; Vinković et al., 2006). The exact physical mechanism for creating such a halo is not known, but the variability of YSOs (discussed in §4.2) supports its existence as a dusty outflow.
In its most rudimentary form, the halo can be approximated with a spherical geometry. We emphasize that this is just a convenient approximation, while a more realistic description of a dusty outflow probably requires a flattened and clumpy halo. Nevertheless, optically thin halos are dominated by direct stellar heating and, therefore, will maintain similar temperature profiles, no matter the exact geometry. We can also ignore the disk heating of the halo because optically thin halos are transparent to the disk emission. The exact images of the disk and halo model ultimately depend on detailed properties of the halo and the intrinsic ratio between the disk and halo surface brightness. These images also depend on the inclination angle, which is something that we cannot address here with our simple approximation. We caution that halo models cannot be dismissed by postulating that they should produce centro-symmetric images (e.g. Isella et al., 2006). Speckle interferometry images of the Herbig Be star R Mon are an illustrative example of complicated asymmetric images produced by a parabolic dusty outflow combined with the inclined disk (Weigelt et al., 2002).
The halo radiative transfer is solved with the code DUSTY (Ivezić, Nenkova, & Elitzur, 1999), which takes advantage of the scaling properties of the radiative transfer problem for dust absorption, emission and scattering (Ivezić & Elitzur, 1997). The stellar spectra used in our modeling are taken from Kurucz models. The silicate dust optical constants are from Dorschner et al. (1995) ( = 0.4 olivine). The radial density profile is described with since Vinković et al. (2006) showed that it can reproduce the NIR SEDs of Herbig Ae/Be stars. The outer halo radius has to be large enough to extended beyond the distance where the halo brightness drops below interferometric or photometric detection. Hence, we fix it to be 100 sublimation radii. Visibility functions at specified wavelengths are part of the computational output from the code. The output visibility already has the stellar and diffuse components included, thus, we do not need to specify in this modeling. The variable that indirectly controls the amount of diffuse flux in optically thin halos is the radial optical depth (see Appendix in Vinković et al., 2003).
The provided spatial frequency from DUSTY is the frequency scaled with the angular size of the inner cavity (Ivezić & Elitzur, 1996). Since the inner cavity radius for is also provided in the output, we can derive the scaled baseline from
| (7) |
Comparison between halo visibility models and data clusters is presented in Figure 8. Dust grains used in the models are 1m in size and sublimating at 1500K. We use stellar temperatures typical for these stars and find that optically thin halos can explain the data clusters. The required visual optical depth in low-L Herbig Ae/Be stars is , which is in agreement with derived from fits to SEDs (Vinković et al., 2006). The T Tau cluster displays a slightly larger upper optical depth limit of .


The grain size of seems optimal to fit the data. Figure 9 shows how the visibility changes when the grain size is reduced to 0.2m or increased to 10m. These changes are caused by variations in the sublimation radius of the halo, where larger grains reduce and smaller grains increase this radius. Similar grain sizes fitting the data mean that the inner halo radii are also very similar.
The model is unsuccessful in explaining the visibility of high-L Herbig Be stars. The only way to reach the observed visibility levels of these stars is to keep the halo at tiny optical depths, which creates a flat visibility due to an unresolved star at observational baselines. This was the approach used by Vinković et al. (2006) in fitting one high-L star (MWC 297). Since observed visibilities show a non-flat structure, this model is unsatisfactory. This shows that if the halo model is correct in low-L objects, then high-L objects differ from low-L objects by not having a dusty halo, which is not surprising considering that large luminosities would impose a large radiation pressure on optically thin dusty halos. Such a scenario would be in agreement with observations showing that YSOs of spectral type earlier than about B5 disperse their circumstellar environment much faster than later spectral types (Fuente et al., 1998). Hence, the NIR visibilities of high-L objects imply that these are stars that are still surrounded by circumstellar gas and dust, but the process of dispersal has already started within their immediate environment.
3.3. Accretion disks
Prior to the discovery of inner disk holes in low-L Herbig Ae/Be stars produced by dust sublimation (Monnier & Millan-Gabet, 2002), accretion disks were assumed to be the main source of the NIR excess in YSOs. Since accretion disks extend closer to the star than the dust sublimation radius, they are still a favored explanation for the NIR visibility data of high-L Herbig Be stars (Malbet et al., 2006; Monnier et al., 2005; Eisner et al., 2004, 2003; Monnier & Millan-Gabet, 2002; Millan-Gabet et al., 2001).
3.3.1 Accretion disk model
The total luminosity of stars with accretion disks is a sum of the stellar and the accretion luminosities, , where . Combining stellar heating (Friedjung, 1985) (for ) and viscous heating (Lynden-Bell & Pringle, 1974) of a geometrically thin, optically thick disk results in the disk temperature
| (8) |
where is the scaled angular size derived from the disk radius and the total luminosity
| (9) |
The inner disk edge size (radius ) and disk inclination angle are free parameters. The stellar fraction of NIR flux can be computed by integrating the disk emission
| (10) |
where the upper integral limit can be any size where the disk temperature drops below detection at NIR wavelengths.
The visibility is a sum of narrow rings over the disk surface. Each ring has the visibility described by equation 2, hence the accretion disk visibility is
| (11) |
where is a small angular step and is the scaled baseline defined in equation 3.
Unlike in dust ring models, here we do not have a firm theoretical limit on the inner radius , but if the disk accretes onto the star, then the inner radius of several stellar radii is expected. The main problem in constraining these models is that precise stellar parameters are not well known for high-L Herbig Be stars. On top of that, accretion luminosities are relatively small compared to stellar luminosities, which makes accretion rates difficult to constrain.
All these uncertainties are illustrated in Figure 10 where we compare various accretion disk models with the data (we ignore anomalously low visibilities of LkH 101 in this discussion, as described in §2). We display models with no accretion (a purely reprocessing disk) and with a very high accretion rate of 10-4M to illustrate how models with almost any accretion rate can be build to fit the visibility data (for further discussion see e.g. Malbet et al., 2006). Models are calculated only for face on inclination, since any loss of flux in inclined disks can be compensated by an increased inner disk radius (Millan-Gabet et al., 2001). Also, inclination increases the visibility, which again calls for a larger inner radius to fit the data. Hence, presented models put a lower limit on .
3.3.2 The nature of disk in high-L Herbig Be stars
It seems that some models with can fit the visibility, which would be in agreement with the magnetic accretion radii implied from T Tau stars (Kenyon et al., 1996). However, Figure 10 shows that models with are also applicable. Moreover, a detailed modeling of MWC 297 yields (Malbet et al., 2006), which raises the question of what is the physical process that truncates the disk at these radii.
Monnier et al. (2005) suggest that the NIR visibility of high-L objects is due to dust in the accretion disk. In that case the inner radius is dictated by the dust sublimation temperature. Figure 10 shows that sublimation temperatures would require . Such disks would be optically thick in their purely gaseous part inside of the dusty disk hole. This would allow shielding of the dust from direct stellar radiation, so that the dust can move closer to the star than the ordinary dust sublimation distance. The extent of this shielding can be estimated by scaling the high-L visibility clusters in Figures 1 and 2 to the location of low-L clusters. We find that all the stellar flux shorter than has to be removed to make this process work. The obtained scaling factor is 7, which also shows how smaller high-L objects are from the dust sublimation size typical of low-L objects.
Optically thin gas can be optically thick in some molecular and atomic lines, but it would be transparent at other wavelengths and incapable of producing such a severe reduction of the stellar flux. The shielding is, therefore, plausible only if the gas is completely optically thick, which also implies high accretion rates () (Muzerolle et al., 2004; Bell & Lin, 1994; Hartmann et al., 1993). On the other hand, this creates a problem because the side effect is a strong near IR radiation that can actually overshine the dusty disk. Muzerolle et al. (2004) demonstrate this in the case of a puffed up dusty disk, where gas emission from accretion disks of would dominate the NIR. Since shielded dusty accretion disks do not have such a puffing, their near IR dust emission is smaller than from puffed up disks and, therefore, competes with smaller accretion rates.
The effect is even more pronounced in NIR visibilities where a bright optically thick gas would affect images by decreasing the observed inner disk radius. Comparison between disk models of different inner radii in Figure 10 shows that any such decrease would significantly alter the visibilities. Thus, if dust is the source of NIR visibility of high-L objects, then the gas inside of the dust sublimation radius has to be optically thick for stellar radiation, but not bright in the NIR at the same time. Scattering of UV by low-density gas was suggested by Monnier & Millan-Gabet (2002) as a possible solution, but this cannot work because i) large optical depths are needed to block almost all of the scattered stellar flux, and ii) even if all of the stellar UV flux is removed, it is still not enough to make high-L scaled visibilities similar to low-L visibilities. This dilemma of how to reconcile such properties of the gaseous disk within the dust sublimation zone is actually quite old, and it was already recognized in a slightly different context by Hartmann et al. (1993).
It is, therefore, possible that instead of dust, the NIR flux of high-L objects originates from gas emission despite confusions about the inner disk radius. This would suggest that these stars have high accretion rates and their circumstellar environment is evolutionary similar to FU Ori objects (young counterparts of T Tau stars). Since both types of objects are of a similar age, they probably share similarities in the accretion process. Fast pre-main-sequence evolution of massive stars actually requires high accretion rates (Palla & Stahler, 2000). Also, observed high mass loss rates imply high accretion rates in massive stars (Cesaroni et al., 2006; Shepherd & Churchwell, 1996), similar to massive winds supported by high accretion rates in FU Ori stars (Sandell & Weintraub, 2001; Calvet et al., 1993). The main difference is the ability of highly luminous Herbig Be stars to relatively quickly disperse their circumstellar matter (Fuente et al., 1998).
The standard viscous disk model predicts proportionality between the disk mass and the accretion rate (e.g. Calvet et al., 2000). Thus, high accretion rates would suggest higher disk masses in high-L than in low-L objects. Observations, however, show exactly the opposite (Fuente et al., 2003). It may be that the dispersion of circumstellar matter around high-L stars starts with disk erosion due to disk and stellar winds. This may reduce the disk mass and explain the observed decrease in disk masses. Their destructive nature may also explain why these stars form a data cluster at 7 times larger scaled baselines than low-L YSOs instead of producing a range of values due to disk optical depth variations between objects. Namely, it may be that only high density and high accretion disks can survive so close to these luminous stars, which would result in disks with very similar NIR signatures.
High accretion rates may also be implied from the recently observed correlation between the accretion rate and the square of the stellar mass of low-L YSOs (e.g. Calvet et al., 2004; Muzerolle et al., 2005; Garcia Lopez et al., 2006; Natta et al., 2006, and references therein). If this correlation is not just a selection effect (Clarke & Pringle, 2006), then it probably extends to high-L objects, too. The required accretion rates would be , which is exactly what we suggest based on the NIR visibilities.
There are additional complications in deducing the nature of disks around Herbig Be stars. MWC 166 is, for example, a binary with a mean distance of 1.7AU between components and an orbital eccentricity of e=0.28 (Pogodin et al., 2006). The binary is surrounded by a common gaseous envelope and the existence of the disk in this system is a more puzzling problem than our general discussion about Herbig Be stars. We also ignore any contribution from the NIR free-free emission. Although this is a good approximation for Herbig Be stars, it is possible that some objects have a significant amount of free-free emission (e.g MWC 297: Porter et al., 1998)
3.3.3 FU Ori accretion disks
Accretion disks in FU Ori stars are corroborated with NIR visibility measurements, as evident from Figure 11 where we compare the visibility data of FU Ori stars and accretion disk models. Modeling is simplified in this case due to similarities in stellar properties of FU Ori stars. We use face-on disks and stellar temperature, mass and luminosity of 5000K, 1 and 4, respectively. Classical accretion disks of =3-5 and reach the upper observed visibility levels (see also Malbet et al., 2005, 1998; Millan-Gabet et al., 2006b). There is a problem with anomalously low visibility of Z CMa-SE, which is more consistent with T Tau visibilities. Other FU Ori stars also show a slightly smaller visibility than expected from pure accretion disks, which indicates an additional larger completely resolved circumstellar structure. Millan-Gabet et al. (2006b) argue that this is due to a large dusty envelope. Such a disk+envelope structure was previously predicted from the overall infrared spectral energy distribution (Hartmann & Kenyon, 1996). This configuration and derived accretion rates were recently confirmed by modeling the infrared spectra of FU Ori stars taken with the Spitzer Space Telescope (Green et al., 2006). However, Quanz et al. (2006) modeled their mid IR visibilities of FU Ori without any additional structure such as a dusty envelope and concluded that the presence of accretion disk is sufficient to explain this object.
4. Discussion
4.1. The importance of dust dynamics
We usually approach this kind of study with the assumption that circumstellar environments of YSOs share enough similarities to be successfully described with one universal theoretical model. This is a very strong assumption considering that the spectra reveal very dynamic gaseous disks around YSOs (e.g. Mora et al., 2004). Since gravity and gas drag are two forces that dictate dust dynamics within protoplanetary disks, dust should also display a very dynamic behavior. The infrared spectra provide evidence that this is indeed the case: the mid IR dust features exhibit clear signatures of small grains in the disk surface (Acke & van den Ancker, 2004), which is possible only if dust dynamics persistently replenishes the surface with these grains (Dullemond & Dominik, 2005).
Dust dynamics is, however, ignored when it comes to formulating dusty disk models used in calculating synthetic infrared spectra and images. The disk is modeled with a smooth surface that seemingly appears dynamically passive. This is a good approximation when it comes to modeling data taken at one epoch, but multi-epoch data reveals that YSOs are far more complicated than such simple disk models. Basically all pre-main-sequence objects are spectrally and photometrically variable, differing only in the amplitude and rate of variability. This variability includes also the near and mid IR wavelengths where dust emission dominates (e.g. Chen & Jura, 2003; Grinin, 2000; Herbst & Shevchenko, 1999; Skrutskie et al., 1996; Liu et al., 1996; Hutchinson et al., 1994; Prusti & Mitskevich, 1994).
While some mid IR variability can be attributed to variations in the stellar (or accretion) heating of the dust, many of these variabilities are not accompanied by changes in the luminosity of the central source. Such cases are a clear sign of dust dynamics producing modulations in the dust emission and/or stellar obscuration. On top of that, Vinković (2006) showed analytically that the dust sublimation zone of optically thick dusty disks cannot be constrained purely by radiative transfer. Sublimation leads to vertical optical thinning of the disk, which, combined with dust dynamics, leads to entirely new radiative transfer solutions. This result demonstrates that inferring a realistic geometry of dust distribution in the inner disk region of optically thick protoplanetary disks requires dust dynamics as well as radiative transfer.
Although the NIR visibilities are currently observed with a limited u-v coverage, dust dynamics responsible for strong variabilities should be detectable in multi-epoch visibility observations. In addition, the newly employed NIR closure-phase measurements enable interferometric detections of dusty disk inhomogeneities, as recently demonstrated in the case of AB Aur (Millan-Gabet et al., 2006a). Time evolution of such brightness asymmetries may significantly improve our understanding of processes responsible for the infrared variability of YSOs.
This is an important topic because current disk models have problems in explaining variabilities caused by transient dust obscurations of the central star (UXOR variables). This variability is manifested as changes in dust extinction, accompanied by the “blueing” effect and increased polarization at minima (Shakhovskoj et al., 2005; Rodgers et al., 2002; Rostopchina et al., 2001; Grinin et al., 2001; Grinin, 2000; Skrutskie et al., 1996; Grinin et al., 1994; Hutchinson et al., 1994). The photometric minima effects are a result of increased relative contribution of scattered starlight by dust in the total spectrum (Natta & Whitney, 2000).
Temporal properties of obscuration events affecting visual and NIR wavelengths indicate that dust clouds usually appear in the inner disk regions at or close to the dust sublimation zone. If they belong to inhomogeneities constrained to the disk then disk inclinations have to be large (Dullemond et al., 2003). The necessesity for such a correlation was originally suggested by Natta et al. (1997). If we assume the most optimistic inner disk puffing of 0.2 (Vinković et al., 2006) then the line of sight would be affected by the inner disk when inclination angles are 80∘. This is inconsistent with the imaging data, which show disks with smaller inclination angles. In particular, the UXOR star CQ Tau (Shakhovskoj et al., 2005) has derived from the NIR visiblities (Eisner et al., 2004), from the mid IR imaging (Doucet et al., 2006) and from mm-imaging (Testi et al., 2003), while the UXOR star VV Ser has derived from the NIR visiblities (Eisner et al., 2004).
We do not agree with the interpretation by Isella et al. (2006) that their derived disk inclinations (from fits to the NIR visibility) of 40-55∘ for CQ Tau and 50-70∘ for VV Ser are in agreement with the dust obscuration model. These inclinations would actually support the idea of dust clouds being ejected to 9 (CQ Tau) and 4.5 (VV Ser) vertical scale heights above the dusty disk, which would dynamically decouple them from the disk (i.e., their dynamics would not be controlled by gas-drag any more).
4.2. Are dusty halos a plausible option?
Dust obscuration events are easier to explain if we allow for a possibility of dust clouds being ejected to moderate polar angles above the disk mid-plane. Notice that this would still imply a dependence of variability on the inclination angle, which can explain the observed weak correlation between inclinations measured in and the amplitude of photometric variability (Grinin & Kozlova, 2000). Similar correlation between the observed polarization and does not exist, but polarimetry supports the idea of a flattened halo above the disk (Yudin, 2000). In addition, numerical models reproduce photometric and polarimetric variability of UXORs using the ad hoc assumption of obscuring dust clouds above the scattering dusty disk (Natta & Whitney, 2000). We note that the variable accretion luminosity model put forward by Herbst & Shevchenko (1999) in order to explain the variability of UXOR objects was successfully challenged by the proponents of dust obscuration model (Rostopchina et al., 2001; Grinin et al., 2001; Grinin, 2000).
Once a cloud is out of the dense gaseous disk, gas drag force becomes negligible and radiation pressure takes over. The cloud would be eventually blown away, creating a dusty halo-like outflow above the disk. Changes in such an outflow would manifest itself by changes in the near and mid IR thermal emission. This IR variability is not dependent on the inclination angle, assuming optically thin emission. It would also be uncorrelated with the stellar spectrum variability. Although simultaneous visual and infrared observations are rare, such variability events have been documented (Chen & Jura, 2003; Eiroa et al., 2002; Prusti & Mitskevich, 1994; Hutchinson et al., 1994). Particularly interesting is the case of HD 163296 in which Sitko et al. (2004) detected an event of a major increase in the near and mid IR emission. Since HST imaging shows a Herbig-Haro flow from this star (Grady et al., 2000a), they conclude that the observed infrared “flare” is possibly an ejection of a forthcoming Herbig-Haro object. If correct, this would directly link stellar outflow with the infrared variability due to dusty outflow.
Unfortunately, despite these seemingly convincing arguments, the existence of a dusty outflow is not straightforward and obvious. The biggest drawback in halo models is the lack of a known force capable of lifting a dust cloud out of the disk. The common assumption in circumstellar disk modeling is that gravity and gas drag do not allow dust to exit the high density gaseous disk. Hence, the existing studies of NIR visibilities are dominated by disk models. Circularly symmetric images are sometimes invoked as a feature of dusty outflows not in agreement with NIR interferometry observations. However, in §3.2 we argue that this is an ill-formed argument because halos can certainly display asymmetric images.
There was great excitement for some time about the possibility of cometary activity in Herbig Ae/Be stars detected in spectral line variations. This is called the Pictoris phenomenon, after the same effect first observed in the dust debris disk of Pic (Grady et al., 2000b). According to this interpretation, accretion episodes accompanied by redshifted absorption components in a number of metal lines are signatures of infalling evaporating comets. This would nicely fit into the above scheme of transient dust clouds. Unfortunately, further observations showed that the composition of infalling gas is consistent with the accretion disk gas (Natta et al., 2000), while numerical models revealed that spectral signatures of comets cannot be detectable due to suppression by strong stellar winds in Herbig Ae/Be stars (Beust et al., 2001). Since then there have been no other suggestions for a process that could lift a dust cloud out of the disk.
A new imperative to explore dusty halos may come from the NIR visibility studies. The large NIR excess (often called the NIR “bump”) of Herbig Ae/Be stars requires a vertical disk puffing at the inner disk edge (Isella et al., 2006; Dullemond, Dominik, & Natta, 2001). The NIR images based on this model have a large skewness - the brightness ratio between two opposite sides of the image centered on the star. Monnier et al. (2006) recently measured the NIR interferometry closure phases that can reveal the amount of skewness and found that observations do not support model predictions111Monnier et al. (2006) suggest that curved puffed up rim model by Isella & Natta (2005) may be more suitable, but notice that this model also produces images with a large skewness (Isella et al., 2006). However, their claim is based mostly on high-L objects that do not exhibit visibilities consistent with the puffed up disks anyway (see §3.3.2). The main question is whether low-L Herbig Ae/Be stars can be described with this model or not. It turns out that closure phases are inconclusive for their skewness determination due to insufficient telescope resolution.
On the other hand, detailed modeling of the NIR visibilities with the puffed up disk model is not successful in reproducing strong near IR bumps (MWC 758 and VV Ser: Isella et al., 2006). It was exactly these objects with a strong NIR bump that Vinković et al. (2006) point out as the most puzzling and most difficult to explain. The model also has problems with reconciling variability of UXOR stars with disk inclinations derived from the model, as already described above. Despite these difficulties, the model of curved puffed up rims by Isella et al. (2006) is quite promising and represents the most advanced description of the inner disk region so far.
4.3. Dust grain size in the inner disk region
Dust properties of the inner protoplanetary disk can also be deduced from the models of observed near IR visibilities. Since in §3.3.2 we argue that NIR visibilities of high-L objects are not dust related, we limit our discussion on dust grain size to low-L YSOs only.
As already described in §3.1, the inner radius of optically thick multigrain disks is controlled by the largest grains in the mix. Also, dust growth and dynamics may change the opacity structure of the inner disk and form a large optically thin zone populated by big (1m) grains extending closer to the star than the optically thick part of the disk. Results from §3.1 support models of optically thick inner disks containing big grains. Smaller grains can hide inside the dusty disk, but we can see only big grains that populate the disk surface and shield smaller grains from the direct stellar heating. Dusty halo models of NIR visibilities also favor micron size grains, but no larger than 10m (see §3.2). Visibilities are, therefore, clearly suggesting that circumstellar dust exists in the region where submicron grains cannot survive when directly exposed to the stellar radiation.
Presence of big grains in the inner disk has been suggested before. Grady et al. (1995) modeled variations in the UV and visual spectra of UX Ori and obtained the best fit with grains 0.15m, which suggests considerable grain growth in comparison with the ISM dust. van Boekel et al. (2004) obtained spectra from the 1-2 AU zone of the immediate surrounding of several low-L Herbig Ae/Be stars using mid IR interferometry. These spectra are dominated by micron size thermally processed (crystalline) dust grains, which differs from the outer (2-20 AU) region where grains are smaller (0.1m) and less crystalline. This is in agreement with results based on the NIR visibilities, where we expect such a grain size gradient due to dust sublimation. Small grains (0.1m) around low-L Herbig Ae/Be stars sublimate at 1 AU, while micron size grains can survive within 1 AU. These big grains populate the inner disk surface and dominate detected visibilities and spectra of the inner disk.
4.4. The difference between high-L and low-L YSOs
The clear distinction between visibilities of low-L and high-L YSOs may be a sign of more extensive dissimilarities between these two classes of objects. The change in circumstellar environment detected by visibilities appears at 10, which corresponds to the spectral type of about B3-B5 during the PMS phase. Here we point out some other significant changes in the YSO properties that happen around that spectral type.
Dispersal of circumstellar gas: The mean gas density within a radius of 0.8 pc around high-L Herbig stars decreases by almost two orders of magnitude during their fast ( yr: Palla & Stahler, 1993) evolution to the main sequence (Fuente et al., 1998). In contrast, environments of low-L stars experience a decrease of less than an order of magnitude. The NIR interferometry targets high-L objects that have still not dispersed their immediate environment. In §3.3.2 we speculate that disk accretion rates under such conditions are high enough to enable a gaseous accretion disk to dominate the NIR emission and visibilities. This differs from low-L objects, where disks have time to evolve to the point where accretion rates become low enough to make the gaseous disk transparent, allowing dust emission to dominate the NIR.
Disk Mass: Disk masses in high-L Herbig stars are significantly lower than in low-L (Fuente et al., 2003). The trend is most noticeable in the ratio of disk to stellar mass, but it is also significant when the absolute disk mass is considered. It could be that these stars evolve through the PMS phase too quickly to accrete a massive disk before the star disperses its circumstellar environment.
Radiation pressure: Detailed calculations of radiation pressure force on dust grains are very complicated and uncertain due to our limited knowledge of geometrical properties of individual dust grains (Burns et al., 1979). Nevertheless, we can exploit some general properties of the ratio of radiation pressure force to gravity, , and derive an estimate for the size of grains repelled by the star (). The ratio is generally proportional to . Differences in the shape of stellar spectrum, grain refractive indexes, and grain density can scatter the value of by an additional order of magnitude (Burns et al., 1979). But luminosity differences between low-L and high-L YSOs are so large that, in the first approximation, a comparison of values in YSOs is dominated by . A PMS star of has (Palla & Stahler, 1993), which means 170 times larger than in the Solar System. High-L objects have even larger , hence, even larger . The Sun can eject dust particles of 0.2m in size (Landgraf et al., 1996; Burns et al., 1979), while other particles smaller than 10m in the Solar System have . This means that we can safely assume that YSOs of repel all dust grains smaller than 10m. In general, high-L YSOs have this limit at grain sizes larger than 10m because their luminosity is . It is difficult to maintain dusty structures around high-L objects with such high values of . A dusty halo would be very efficiently dispersed. Puffed up disk rims cannot maintain their vertical stability and would be efficiently blown away. Only dust within the optically thick gaseous disk or strongly dragged by gas toward the star can resist the radiation pressure force. The situation is completely different for low-L objects. A Herbig star has (Palla & Stahler, 1993), hence the upper grain size limit of dust with is in the micron range. Curiously enough, this is consistent with smaller grains not surviving in the surface of the inner disk (see §4.3 above).
Variability: The range of photometric variabilities of high-L YSOs is much smaller (V1.5 mag) than that of low-L YSOs (V6 mag) (Rodgers, 2001; Herbst & Shevchenko, 1999; Bibo & The, 1991; Finkenzeller & Mundt, 1984). This dependence of variability on luminosity is not understood. It may be that high luminosities are masking underlying accretion variabilities (unlike FU Ori stars where the stellar luminosity is much smaller than the accretion luminosity) or that dust sublimates so far away from the star that the probability for a transient dust obscuration is highly reduced (Grinin & Kozlova, 2000). Near IR visibilities, however, indicate that differences in the geometry of circumstellar matter distribution may be the reason. Another interesting property of the variability data is the correlation between the NIR flux excess and the range of variability amplitudes. Herbst & Shevchenko (1999) show this for Herbig Ae/Be stars by plotting the variability range in V band against the ratio of NIR excess luminosity to the stellar luminosity. Skrutskie et al. (1996) show this for T Tau stars by plotting variations of intrinsic (K-L) color excess against the amplitude of the K-band variability. If the puffed-up inner dusty-disk rim model is responsible for V-band variability (which we challenge; see §4.1) then this correlation indicates temporal variations in the rim’s height. The halo model, on the other hand, explains this correlation by connecting the amount of dust in the halo with the dynamics of dusty outflow. A larger NIR flux requires a larger optical depth of the halo, which in turn is a result of enhanced dust dynamics supplying the halo with dust. Side effects of this enhanced dynamics are dust obscuration events and NIR emission variabilities. Since the existence of such a halo is consistent only with low-L YSOs (see §3.2), the variability amplitude is smaller in high-L YSOs because they lack the halo and its dust dynamics. Unfortunately, the current data are not sufficient for establishing which theory is correct.
5. Summary
We have reviewed all published NIR (H- and K-band) visibility data of YSOs and devised a method for their model-independent comparison. The method is based on scaling the distance of objects and their luminosity out of the measured baseline (equation 1). This removes the apparent dependence of the object’s size on: i) its distance and ii) radiative transfer scaling due to luminosity. Hence, the visibility dependence on scaled baseline detects inherent differences in the geometry of circumstellar matter distribution without applying any additional theoretical model-dependent assumption.
The comparison shows a clear distinction between low-L YSOs () and high-L YSOs (), as already suggested by previous studies (Monnier et al., 2005; Eisner et al., 2004). Low-L visibilities cluster at spatial scales 7 times larger than scales derived from the visibility clustering of high-L YSOs. Next, we analyze the observed visibility clusters with three types of image models. Modeling the whole data cluster instead of individual objects reveals or reaffirms some collective properties of these objects.
The first model is the uniform brightness ring, where we use dust sublimation as the boundary condition for the ring’s inner radius. High-L YSOs are inconsistent with dust sublimation and appear much too small. The model was also not successful in explaining the size of T Tau cluster. These stars appear slightly larger than model predictions. The model was more successful in low-L Herbig Ae/Be stars where the visibility cluster can be modeled with optically thick rings of 0-60∘ inclination and a dust sublimation temperature of 1500K. The second model is the optically thin dusty halo. It explains the T Tau cluster with halos of 0.2-1.0 visual optical depth. Low-L Herbig Ae/Be stars require optical depths of 0.15-0.8. Halos made of micron size grains provide the best fit to these data clusters. Finally, the third model is a classical accretion disk. We use this model on high-L Herbig Be stars and show that it can accommodate observed visibilities. The model does not constrain the accretion rate because equally successful fits can be built with . We argue, however, that the NIR emission from accretion disks must be due to gas and not dust, hence, accretion rates must be high in order to produce required thermal emission from the gas.
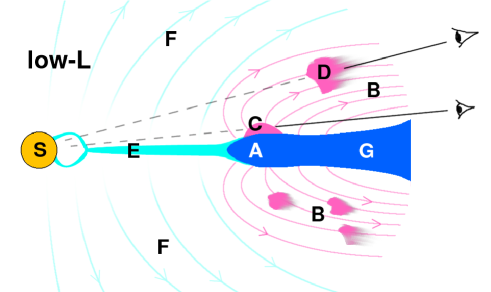
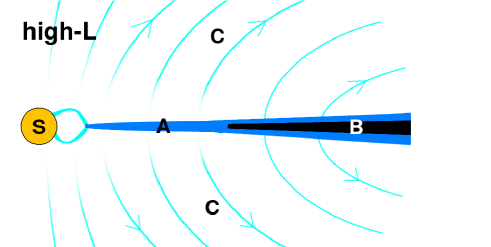
We also discuss variability properties of YSOs and made an attempt to incorporate them into the existing models of inner protoplanetary disk. We argue that dust obscuration events detected through photometric and spectroscopic variability are caused by dust clumps too high above the dense inner protoplanetary disk to be considered dynamically part of the disk. Instead, we advocate a model where dust is ejected out of the disk and blown away by the radiation pressure. This would create a clumpy dusty halo-like outflow above the inner disk. Unfortunately, we are not aware of any physical process that could lift the dust out of the disk. Without this process the only alternative is to assume that the inner disk rim is puffed-up and undergoes occasional height variations responsible for dust obscuration events. But this model is also problematic because it requires disk inclinations lager than actually observed in objects with dust obscuration events. All these facets of evidently complicated circumstellar environment of YSOs are sketched in Figure 12. Grain size also plays a very important role in this environment. We argued for large (1m) grains in the surface of inner disk region of low-L YSOs based on theoretical and observational evidence.
In addition to the difference in their visibility clusters, high-L and low-L YSOs differ in many other observational aspects. High-L Herbig Be stars: i) are much more efficient in dispersal of their circumstellar gas and dust, ii) have smaller disk masses, iii) have strong radiation pressure capable of destroying circumstellar dust structures made of grains up to 10m or more in size, iv) are far less photometrically variable. All these properties clearly indicate that the geometry of circumstellar gas and dust distribution around high-L YSOs is fundamentally different from those in their lower luminosity counterparts. Our current understanding of these environments is far from satisfactory and it is largely incomplete.
References
- Acke et al. (2005) Acke, B., van den Ancker, M. E., & Dullemond, C. P. 2005, A&A, 436, 209
- Acke & van den Ancker (2004) Acke, B., & van den Ancker, M. E. 2004, A&A, 426, 151
- Akeson et al. (2005a) Akeson, R. L., et al. 2005a, ApJ, 635, 1173
- Akeson et al. (2005b) Akeson, R. L., et al. 2005b, ApJ, 622, 440
- Akeson et al. (2002) Akeson, R. L., Ciardi, D. R., van Belle, G. T., & Creech-Eakman, M. J. 2002, ApJ, 566, 1124
- Akeson et al. (2000) Akeson, R. L., Ciardi, D. R., van Belle, G. T., Creech-Eakman, M. J., & Lada, E. A. 2000, ApJ, 543, 313
- Bell & Lin (1994) Bell, K. R., & Lin, D. N. C. 1994, ApJ, 427, 987
- Berrilli et al. (1992) Berrilli, F., et al. 1992, ApJ, 398, 254
- Beust et al. (2001) Beust, H., Karmann, C., & Lagrange, A.-M. 2001, A&A, 366, 945
- Bibo & The (1991) Bibo, E. A., & The, P. S. 1991, A&AS, 89, 319
- Burns et al. (1979) Burns, J. A., Lamy, P. L., & Soter, S. 1979, Icarus, 40, 1
- Calvet et al. (2004) Calvet, N., Muzerolle, J., Briceño, C., Hernández, J., Hartmann, L., Saucedo, J. L., & Gordon, K. D. 2004, AJ, 128, 1294
- Calvet et al. (2000) Calvet, N., Hartmann, L., & Strom, S. E. 2000, Protostars and Planets IV, 377
- Calvet et al. (1993) Calvet, N., Hartmann, L., & Kenyon, S. J. 1993, ApJ, 402, 623
- Cesaroni et al. (2006) Cesaroni, R., Galli, D., Lodato, G., Walmsley, C. M., & Zhang, Q. 2006, Protostars and Planets V, in press (astro-ph/0603093)
- Chavarria-K. et al. (1988) Chavarria-K., C., de Lara, E., Finkenzeller, U., Mendoza, E. E., & Ocegueda, J. 1988, A&A, 197, 151
- Chen & Jura (2003) Chen, C. H., & Jura, M. 2003, ApJ, 591, 267
- Chini (1981) Chini, R. 1981, A&A, 99, 346
- Cieza et al. (2005) Cieza, L. A., Kessler-Silacci, J. E., Jaffe, D. T., Harvey, P. M., & Evans, N. J., II 2005, ApJ, 635, 422
- Claria (1974) Claria, J. J. 1974, A&A, 37, 229
- Clarke & Pringle (2006) Clarke, C. J., & Pringle, J. E. 2006, MNRAS, 370, L10
- Cohen et al. (1985) Cohen, M., Bieging, J. H., Welch, W. J., & Dreher, J. W. 1985, ApJ, 292, 249
- Colavita et al. (2003) Colavita, M., et al. 2003, ApJ, 592, L83
- Danchi et al. (2001) Danchi, W. C., Tuthill, P. G., & Monnier, J. D. 2001, ApJ, 562, 440
- de Lara et al. (1991) de Lara, E., Chavarria-K., C., & Lopez-Molina, G. 1991, A&A, 243, 139
- de Winter & van den Ancker (1997) de Winter, D., & van den Ancker, M. E. 1997, A&AS, 121, 275
- Dorschner et al. (1995) Dorschner, J., Begemann, B., Henning, T., Jaeger, C., & Mutschke, H. 1995, A&A, 300, 503
- Doucet et al. (2006) Doucet, C., Pantin, E., Lagage, P. O., & Dullemond, C. P. 2006, A&Aaccepted (arXiv:astro-ph/0608615)
- Drew et al. (1997) Drew, J. E., et al. 1997, MNRAS, 286, 538
- Dullemond & Dominik (2005) Dullemond, C. P., & Dominik, C. 2005, A&A, 434, 971
- Dullemond, Dominik, & Natta (2001) Dullemond, C. P., Dominik, C., & Natta, A. 2001, ApJ, 560, 957
- Dullemond et al. (2003) Dullemond, C. P., van den Ancker, M. E., Acke, B., & van Boekel, R. 2003, ApJ, 594, L47
- Finkenzeller & Mundt (1984) Finkenzeller, U., & Mundt, R. 1984, A&AS, 55, 109
- Eiroa et al. (2002) Eiroa, C., et al. 2002, A&A, 384, 1038
- Eisner et al. (2005) Eisner, J. A., Hillenbrand, L. A., White, R. J., Akeson, R. L., & Sargent, A. I. 2005, ApJ, 623, 952
- Eisner et al. (2004) Eisner, J. A., Lane, B. F., Hillenbrand, L. A., Akeson, R. L., & Sargent, A. I. 2004, ApJ, 613, 1049
- Eisner et al. (2003) Eisner, J. A., Lane, B. F., Akeson, R. L., Hillenbrand, L. A., & Sargent, A. I. 2003, ApJ, 588, 360
- Friedemann et al. (1993) Friedemann, C., et al. 1993, A&A, 277, 184
- Friedjung (1985) Friedjung, M. 1985, A&A, 146, 366
- Fuente et al. (2003) Fuente, A., Rodríguez-Franco, A., Testi, L., Natta, A., Bachiller, R., & Neri, R. 2003, ApJ, 598, L39
- Fuente et al. (1998) Fuente, A., Martin-Pintado, J., Bachiller, R., Neri, R., & Palla, F. 1998, A&A, 334, 253
- Garcia Lopez et al. (2006) Garcia Lopez, R., Natta, A., Testi, L., & Habart, E. 2006, A&A, accepted (arXiv:astro-ph/0609032)
- Grady et al. (2000a) Grady, C. A., et al. 2000a, ApJ, 544, 895
- Grady et al. (2000b) Grady, C. A., Sitko, M. L., Russell, R. W., Lynch, D. K., Hanner, M. S., Perez, M. R., Bjorkman, K. S., & de Winter, D. 2000b, Protostars and Planets IV, 613
- Grady et al. (1995) Grady, C. A., Perez, M. R., The, P. S., Grinin, V. P., de Winter, D., Johnson, S. B., & Talavera, A. 1995, A&A, 302, 472
- Green et al. (2006) Green, J. D. et al. 2006, ApJ, accepted (astro-ph/0605365)
- Grinin (2000) Grinin, V. P. 2000, ASP Conf. Ser. 219: Disks, Planetesimals, and Planets, 219, 216
- Grinin & Kozlova (2000) Grinin, V. P., & Kozlova, O. V. 2000, Astrophysics, 43, 239
- Grinin et al. (2001) Grinin, V. P., Kozlova, O. V., Natta, A., Ilyin, I., Tuominen, I., Rostopchina, A. N., & Shakhovskoy, D. N. 2001, A&A, 379, 482
- Grinin et al. (1994) Grinin, V. P., The, P. S., de Winter, D., Giampapa, M., Rostopchina, A. N., Tambovtseva, L. V., & van den Ancker, M. E. 1994, A&A, 292, 165
- Hartmann & Kenyon (1996) Hartmann, L., & Kenyon, S. J. 1996, ARA&A, 34, 207
- Hartmann et al. (1993) Hartmann, L., Kenyon, S. J., & Calvet, N. 1993, ApJ, 407, 219
- Herbig et al. (2004) Herbig, G. H., Andrews, S. M., & Dahm, S. E. 2004, AJ, 128, 1233
- Herbst & Shevchenko (1999) Herbst, W., & Shevchenko, V. S. 1999, AJ, 118, 1043
- Herbst et al. (1982) Herbst, W., Warner, J. W., Miller, D. P., & Herzog, A. 1982, AJ, 87, 98
- Hernández et al. (2004) Hernández, J., Calvet, N., Briceño, C., Hartmann, L., & Berlind, P. 2004, AJ, 127, 1682
- Hillenbrand et al. (1992) Hillenbrand, L. A., Strom, S. E., Vrba, F. J., & Keene, J. 1992, ApJ, 397, 613
- Hofmann et al. (2002) Hofmann, K.-H., Balega, Y., Ikhsanov, N. R., Miroshnichenko, A. S., & Weigelt, G. 2002, A&A, 395, 891
- Hutchinson et al. (1994) Hutchinson, M. G., Albinson, J. S., Barrett, P., Davies, J. K., Evans, A., Goldsmith, M. J., & Maddison, R. C. 1994, A&A, 285, 883
- Isella & Natta (2005) Isella, A., & Natta, A. 2005, A&A, 438, 899
- Isella et al. (2006) Isella, A., Testi, L., & Natta, A. 2006, A&A, 451, 951
- Ivezić, Nenkova, & Elitzur (1999) Ivezić, Ž., Nenkova, M. & Elitzur, M. 1999, User Manual for DUSTY, Univ. of Kentucky internal report, accessible at http://www.pa.uky.edu/moshe/dusty
- Ivezić & Elitzur (1997) Ivezić, Ž., & Elitzur, M. 1997, MNRAS, 287, 799
- Ivezić & Elitzur (1996) Ivezić, Ž., & Elitzur, M. 1996, MNRAS, 279, 1011
- Johns-Krull & Valenti (2001) Johns-Krull, C. M., & Valenti, J. A. 2001, ApJ, 561, 1060
- Kenyon et al. (1996) Kenyon, S. J., Yi, I., & Hartmann, L. 1996, ApJ, 462, 439
- Lada (1985) Lada, C. J. 1985, ARA&A, 23, 267
- Landgraf et al. (1996) Landgraf, M., Augustsson, K., Grün, E., & Gustafson, B. . S. 1999, Science, 286, 2319
- Levreault (1988) Levreault, R. M. 1988, ApJ, 330, 897
- Liu et al. (1996) Liu, M. C., et al. 1996, ApJ, 461, 334
- Lorenzetti et al. (2002) Lorenzetti, D., Giannini, T., Nisini, B., Benedettini, M., Elia, D., Campeggio, L., & Strafella, F. 2002, A&A, 395, 637
- Lynden-Bell & Pringle (1974) Lynden-Bell, D., & Pringle, J. E. 1974, MNRAS, 168, 603
- Malbet et al. (2006) Malbet, F. et al. 2006, A&A, in press
- Malbet et al. (2005) Malbet, F., et al. 2005, A&A, 437, 627
- Malbet et al. (1998) Malbet, F., et al. 1998, ApJ, 507, L149
- Mannings & Sargent (1997) Mannings, V., & Sargent, A. I. 1997, ApJ, 490, 792
- Manoj et al. (2002) Manoj, P., Maheswar, G., & Bhatt, H. C. 2002, MNRAS, 334, 419
- Meeus et al. (2001) Meeus, G., Waters, L. B. F. M., Bouwman, J., van den Ancker, M. E., Waelkens, C., & Malfait, K. 2001, A&A, 365, 476
- Millan-Gabet et al. (2006a) Millan-Gabet, R., et al. 2006a, ApJ, 645, L77
- Millan-Gabet et al. (2006b) Millan-Gabet, R., et al. 2006b, ApJ, 641, 547
- Millan-Gabet et al. (2001) Millan-Gabet, R., Schloerb, F. P., & Traub, W. A. 2001, ApJ, 546, 358
- Millan-Gabet et al. (1999) Millan-Gabet, R., Schloerb, F. P., Traub, W. A., Malbet, F., Berger, J. P., & Bregman, J. D. 1999, ApJ, 513, L131
- Miroshnichenko & Corporon (1999) Miroshnichenko, A., & Corporon, P. 1999, A&A, 349, 126
- Monnier (2003) Monnier, J. D. 2003, Reports of Progress in Physics, 66, 789
- Monnier et al. (2005) Monnier, J. D. et al. 2005, ApJ624, 832
- Monnier et al. (2006) Monnier, J. D., et al. 2006, ApJ, 647, 444
- Monnier & Millan-Gabet (2002) Monnier, J. D. & Millan-Gabet, R. 2002, ApJ579, 694
- Mora et al. (2004) Mora, A., et al. 2004, A&A, 419, 225
- Muzerolle et al. (2003) Muzerolle, J., Calvet, N., Hartmann, L., & D’Alessio, P. 2003, ApJ, 597, L149
- Muzerolle et al. (2004) Muzerolle, J., D’Alessio, P., Calvet, N., & Hartmann, L. 2004, ApJ, 617, 406
- Muzerolle et al. (2005) Muzerolle, J., Luhman, K. L., Briceño, C., Hartmann, L., & Calvet, N. 2005, ApJ, 625, 906
- Natta et al. (1997) Natta, A., Grinin, V. P., Mannings, V., & Ungerechts, H. 1997, ApJ, 491, 885
- Natta et al. (2000) Natta, A., Grinin, V. P., & Tambovtseva, L. V. 2000, ApJ, 542, 421
- Natta & Whitney (2000) Natta, A., & Whitney, B. A. 2000, A&A, 364, 633
- Natta et al. (2006) Natta, A., Testi, L., & Randich, S. 2006, A&A, 452, 245
- Palla & Stahler (2000) Palla, F., & Stahler, S. W. 2000, ESA SP-445: Star Formation from the Small to the Large Scale, 179
- Palla & Stahler (1993) Palla, F., & Stahler, S. W. 1993, ApJ, 418, 414
- Pérez et al. (2004) Pérez, M. R., van den Ancker, M. E., de Winter, D., & Bopp, B. W. 2004, A&A, 416, 647
- Pogodin et al. (2006) Pogodin, M. A., Malanushenko, V. P., Kozlova, O. V., Tarasova, T. N., & Franco, G. A. P. 2006, A&A, 452, 551
- Porter et al. (1998) Porter, J. M., Drew, J. E., & Lumsden, S. L. 1998, A&A, 332, 999
- Prusti & Mitskevich (1994) Prusti, T., & Mitskevich, A. S. 1994, ASP Conf. Ser. 62: The Nature and Evolutionary Status of Herbig Ae/Be Stars, 62, 257
- Przygodda et al. (2003) Przygodda, F., van Boekel, R., Àbrahàm, P., Melnikov, S. Y., Waters, L. B. F. M., & Leinert, C. 2003, A&A, 412, L43
- Quanz et al. (2006) Quanz, S. P., Henning, T., Bouwman, J., Ratzka, T., & Leinert, C. 2006, ApJ, accepted (astro-ph/0605382)
- Rodgers (2001) Rodgers, B. M. 2001, Ph.D. Thesis,
- Rodgers et al. (2002) Rodgers, B., Wooden, D. H., Grinin, V., Shakhovsky, D., & Natta, A. 2002, ApJ, 564, 405
- Rostopchina et al. (2001) Rostopchina, A. N., Grinin, V. P., & Shakhovskoi, D. N. 2001, Astronomy Reports, 45, 51
- Sandell & Weintraub (2001) Sandell, G., & Weintraub, D. A. 2001, ApJS, 134, 115
- Shakhovskoj et al. (2005) Shakhovskoj, D. N., Grinin, V. P., & Rostopchina, A. N. 2005, Astrophysics, 48, 135
- Shepherd & Churchwell (1996) Shepherd, D. S., & Churchwell, E. 1996, ApJ, 472, 225
- Shevchenko et al. (1991) Shevchenko, V. S., Ibragimov, M. A., & Chenysheva, T. L. 1991, Soviet Astronomy, 35, 229
- Sitko et al. (2004) Sitko, M. L., Carpenter, W. J., Lynch, D. K., Russell, R. W., Grady, C. A., Brafford, S. M., & Wooden, D. H. 2004, American Astronomical Society Meeting Abstracts, 205, #16.06
- Skrutskie et al. (1996) Skrutskie, M. F., Meyer, M. R., Whalen, D., & Hamilton, C. 1996, AJ, 112, 2168
- Straizys et al. (1989) Straizys, V., et al. 1989, A&A, 222, 82
- Strom et al. (1972) Strom, K. M., Strom, S. E., Breger, M., Brooke, A. L., Yost, J., Grasdalen, G., & Carrasco, L. 1972, ApJ, 173, L65
- Strom et al. (1974) Strom, S. E., Grasdalen, G. L., & Strom, K. M. 1974, ApJ, 191, 111
- Tuthill et al. (2002) Tuthill, P. G., Monnier, J. D., Danchi, W. C., Hale, D. D. S., & Townes, C. H. 2002, ApJ, 577, 826
- Tuthill et al. (2001) Tuthill, P. G., Monnier, J. D., & Danchi, W. C. 2001, Nature, 409, 1012
- Terranegra et al. (1994) Terranegra, L., Chavarria-K., C., Diaz, S., & Gonzalez-Patino, D. 1994, A&AS, 104, 557
- Testi et al. (2003) Testi, L., Natta, A., Shepherd, D. S., & Wilner, D. J. 2003, A&A, 403, 323
- Testi et al. (1998) Testi, L., Palla, F., & Natta, A. 1998, A&AS, 133, 81
- van Boekel et al. (2003) van Boekel, R., Waters, L. B. F. M., Dominik, C., Bouwman, J., de Koter, A., Dullemond, C. P., & Paresce, F. 2003, A&A, 400, L21
- van Boekel et al. (2004) van Boekel, R., et al. 2004, Nature, 432, 479
- van Boekel et al. (2005) van Boekel, R., Min, M., Waters, L. B. F. M., de Koter, A., Dominik, C., van den Ancker, M. E., & Bouwman, J. 2005, A&A, 437, 189
- van den Ancker et al. (2004) van den Ancker, M. E., Blondel, P. F. C., Tjin A Djie, H. R. E., Grankin, K. N., Ezhkova, O. V., Shevchenko, V. S., Guenther, E., & Acke, B. 2004, MNRAS, 349, 1516
- van den Ancker et al. (2000) van den Ancker, M. E., Wesselius, P. R., & Tielens, A. G. G. M. 2000, A&A, 355, 194
- van den Ancker et al. (1998) van den Ancker, M. E., de Winter, D., & Tjin A Djie, H. R. E. 1998, A&A, 330, 145
- Vinković (2006) Vinković, D. 2006, ApJ, 651, 906
- Vinković et al. (2003) Vinković, D., Ivezić, Ž., Miroshnichenko, A. S., & Elitzur, M. 2003, MNRAS, 346, 1151
- Vinković et al. (2006) Vinković, D., Ivezić, Ž., Jurkić, T., & Elitzur, M. 2006b, ApJ, 636, 348
- Yudin (2000) Yudin, R. V. 2000, A&AS, 144, 285
- Warren & Hesser (1978) Warren, W. H., & Hesser, J. E. 1978, ApJS, 36, 497
- Weigelt et al. (2002) Weigelt, G., Balega, Y. Y., Hofmann, K.-H., & Preibisch, T. 2002, A&A, 392, 937
- White & Ghez (2001) White, R. J., & Ghez, A. M. 2001, ApJ, 556, 265
- Wichmann et al. (1998) Wichmann, R., Bastian, U., Krautter, J., Jankovics, I., & Rucinski, S. M. 1998, MNRAS, 301, L39
- Wilkin & Akeson (2003) Wilkin, F. P., & Akeson, R. L. 2003, Ap&SS, 286, 145