address=LUTH, Observatoire de Paris-Meudon, 5 Place Jules Janssen, F-92195 Meudon, France
Thermal instabilities in Active Galactic Nuclei:
the case of thin vs. thick ionized media
Abstract
We have studied the thermal instabilities in the context of Active Galactic Nuclei (AGN), addressing the cases of thin and thick (stratified) X-ray illuminated media. For that, we have compared the behaviour of different models in pressure equilibrium. Ionized gas in pressure equilibrium show temperature discontinuities which, however difficult to tackle, can be modelled with the transfer-photoionization code TITAN. Our code allows to choose between the hot and the cold stable solutions in the multi-branch regime of the S-curve, and then to compute a fully consistent photoionisation model with the chosen solution. For the first time, it is now possible to compare the true stable solution models with the approximate solution model normally used. Our studies may be applied to media in any pressure equilibrium conditions, e.g. constant gas pressure, constant total pressure, or hydrostatic pressure equilibrium; they can be used to model irradiated accretion discs in AGN, the Warm Absorber in type 1 AGN, or the X-ray line-emitting gas in type 2 AGN.
Keywords:
X-ray – Computer modeling and simulation – Emission, absorption, and scattering of electromagnetic radiation:
95.85.Nv – 95.75.-z – 52.25.Os1 Thermal instabilities in thin and thick media
First, let us introduce the subject of thermal instabilities in thin and thick ionized media, and address the main differences observed in each case. It is well known that a photoionized gas in thermal equilibrium can display a thermal instability (e.g. Krolik et al. 1981). The phenomenon manifests itself in the S-shape of the net cooling function, or, which is equivalent, through the curve giving the temperature versus the radiation-to-gas-pressure ratio. Such an S-shape curve allows for the co-existence of gas at different temperatures and densities for the same pressure ratio. For a given value of the radiation-to-gas-pressure ratio, the gas can thus be in three states of thermal equilibrium — one of these states is thermally unstable; the two others (a “hot” and a “cold” solution) are stable. Such thermal instabilities are, for instance, at the origin of the two-phase model for the interstellar medium (Field et al. 1969) and the two-phase medium interpretation of the Broad Line Region in Active Galactic Nuclei (AGN) (Krolik et al. 1981).
Since Krolik et al., many studies have been devoted to the S-shape curve, but always in the optically thin case. Thanks to the most recent developments of the TITAN code, described in Gonçalves et al. (2007), it is now possible to address the thermal instabilities in the case of optically thick, stratified media (note that by “optically thick”, we here mean media optically thick to the photoionization continuum; in such case, the continuum displays absorptions at one or more ionization edges).
Our modeling can be applied to the study of the Warm Absorber (WA) in type 1 AGN, the X-ray line-emitting gas in type 2 AGN, or still the irradiated accretion discs in AGN and X-ray binaries.
1.1 Optically thin ionized media
In optically thin media, the radiation pressure keeps a constant value, and the energy balance equation solution depends on the gas pressure only. When the gas pressure is small compared to the radiation pressure, there is a unique stable hot solution, where both the heating and the cooling are dominated by Compton processes (Compton heating, inverse Compton cooling). As the gas pressure increases, atomic processes (photoionization heating, line and continuum cooling) become important, and multiple solutions arise. Then, above a given gas pressure, again a unique, cold solution, exists. Krolik et al. (1981) have studied the thermal instabilities in the context of optically thin media. They showed that multiple solutions may lead to the existence of a 2-phase medium, with a hot dilute medium confining a dense cold one; what about thick media?
1.2 Optically thick ionized media
The thermal instability problem in thick, stratified media is very different from what happens in thin media, this for mainly two reasons:
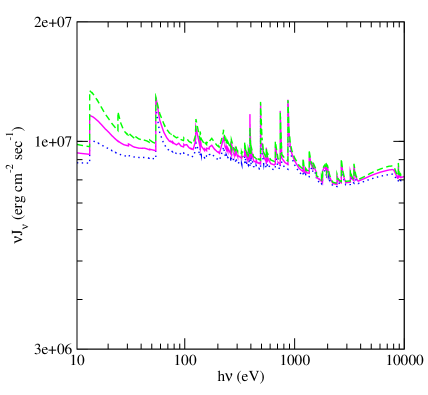
(i) First, the spectral distribution of the mean intensity, , at the illuminated surface of the medium is different from the incident spectrum, as it equally contains a “returning” radiation component emitted by the slab of gas itself. To illustrate this phenomenon, we have computed a series of photoionization models with the TITAN code: all models were computed under total pressure equilibrium, null turbulent velocity, and cosmic abundances; the hydrogen numerical density at the illuminated surface, , was set to cm-3. We recall that the thermal and ionization structures of our ionized gas are mainly determined by the ionization parameter and the shape of the incident continuum — here a power-law of photon index , covering the 10105 eV energy range. Figure 1 shows the spectral distribution of the mean continuum intensity at the slab surface for three models with different values of the column density, ; we observe that the spectrum at the irradiated surface contains strong discontinuities, whose amplitude increases with the slab thickness, as does the intensity of the whole spectrum.
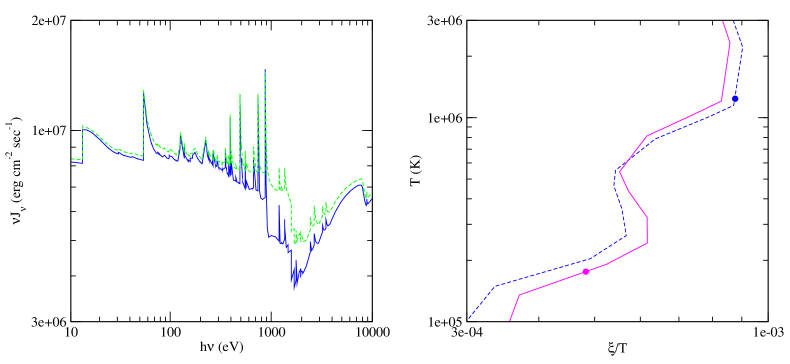
(ii) Second, the spectral distribution changes as the radiation progresses inside the medium; as a consequence, the shape of the S-curve also changes, and instead of traveling along a given S-curve, as the radiation-to-gas pressure ratio decreases, the temperature follows successively different curves. This behaviour is illustrated in Fig. 2, which shows the spectral distribution of the mean continuum for two layers located at different depths in the gas slab, and the corresponding curves giving versus . We can see that the S-curves are different for the two represented layers, and that the deeper layer displays a larger multi-branch region; this is due to its larger absorption trough.
2 Summary of our results and their implications
An important result to keep in mind is that a thick, stratified medium, ionized by X-rays, behaves differently from a thin ionized medium. This has observational implications in the emitted/absorbed spectra, ionization states, and variability.
It is impossible to know what solution the plasma will adopt when attaining the multi-solutions regime: it can oscillate between the hot and cold solutions, it can fragment into hot and cold clumps which will coexist together, or it can take the form of a hot, dilute medium confining cold, denser clumps. In addition, the relative proportion of those phases could be varying with time. Nevertheless, one expects the emitted/absorbed spectrum to be intermediate between those resulting from pure cold and hot models.
TITAN can compute models using either the stable, cold/hot solutions (this version of our program is based on an isobaric iteration scheme), or else an intermediate solution between those two (the computations are then based on an isodensity iteration scheme). When comparing the results obtained with models based on the stable hot/cold solutions, and the approximate, intermediate solution, we conclude that the hot/cold models represent two extreme results corresponding to a given gas composition and photoionizing flux. We stress that the three (hot, cold, and intermediate) models differ not only in the layers where multiple solutions are possible, but all along the gas slab, this because the entire radiation field suffers modifications while crossing a thick medium. The spectra emitted or absorbed by a given ionized medium, consisting of a mixture of gas in the hot and cold phases, should thus be intermediate between those resulting from the pure cold and hot models; therefore, the intermediate model provides a good description of such a mixed-phase medium. Furthermore, the differences between the emitted and absorbed spectra obtained with the stable solutions can provide an indication for the maximum error bars associated to the spectra computed with the intermediate solution previously used by TITAN to circumvent the problem of thermal instabilities. The differences amount at most to 1–2% for the outward emitted spectrum, and to 20% for the absorption spectrum. The agreement is much better for the outward emission in the X-ray range. The lines have similar intensities in all the spectra. A more throughout comparison of the hot, cold, and intermediate models is given in Gonçalves et al. (2007).
An important point to take into account when choosing which computational method to apply, is that the full computation of the hot and cold models is extremely time-consuming; this is because the process is strongly unstable and requires thus more iterations than the intermediate model. Given the results, we sustain that it is reasonable to use the simpler, isodensity scheme to compute constant pressure models or hydrostatic equilibrium models. This procedure is less ad-hoc than to choose arbitrarily between one of the possible solutions, as other codes do, resulting, in the end, in gas structures and emitted/absorbed spectra very close to what is expected from an ionized medium consisting in similar proportions of gas in the hot and cold phases.
References
- (1) G. B. Field, D. W. Goldsmith, and H. J. Habing, ApJ, 155, L149–154 (1969)
- (2) A. C. Gonçalves, S. Collin, A.-M. Dumont, and L. Chevallier, submitted to A&A (2007)
- (3) J. H. Krolik, C. F. McKee, and C. B. Tarter, ApJ, 249, 422–442 (1981)