Rapid NH changes in NGC 4151
Abstract
We have analyzed the two longest (elapsed time days) BeppoSAX observations of the X-ray brightest Seyfert galaxy, NGC 4151, to search for spectral variability on timescales from a few tens of ksec to years. We found in both cases highly significant spectral variability below keV down to the shortest timescales investigated. These variations can be naturally explained in terms of variations in the low energy cut-off due to obscuring matter along the line of sight. If the cut-off is modeled by two neutral absorption components, one fully covering the source and the second covering only a fraction of the source, the shortest timescale of variability of a few days constrains the location of the obscuring matter to within 3.4 Schwarzschild radii from the central X-ray source. This is consistent with the distance of the Broad Emission Line Region, as inferred from reverberation mapping, and difficult to reconcile with the parsec scale dusty molecular torus of Krolik Begelman (1988). We have also explored a more complex absorption structure, namely the presence of an ionized absorber. Although the behaviour of the ionization parameter is nicely consistent with the expectations, the results are not completely satisfactory from the statistical point of view.
The overall absorption during the 2001 December observation is lower than in all other historical observations with similar 2-10 keV flux. This suggests that absorption variability plays a crucial role in the observed flux variability of this source.
keywords:
Galaxies: Seyfert – Galaxies: individual: NGC 4151 — X–rays: galaxies1 Introduction
In the Unified Scheme for AGN (Antonucci 1993, Urry Padovani 1995), type 2 narrow lines Active Galactic Nuclei (AGNs) are normal type 1 AGNs with both the characteristic broad emission lines and the optical to X-ray continuum observed through a column of gas and dust of density N cm-2. In this model, the absorption is located in a dusty torus at parsec distances from the central continuum (Krolik Begelman 1988, Pier Krolik 1992, Pier Krolik 1993). Large variations of the obscuring screen are therefore not expected on timescales much shorter than the crossing time at the dust sublimation radius (rd4LTcm, where LUV,46 is the ultraviolet luminosity in units of 1046 erg s-1 and T1500 is the grain evaporation temperature in units of 1500 K, Barvainis 1987). However, Risaliti, Elvis Nicastro (2002) found that 23/24 X-ray absorbed (Compton “thin”, i.e.N cm-2) AGNs showed NH variability by a factor 2-3, and, most interestingly, that several objects varied on timescales of months (but see the case of NGC 4388 for even shorter variability timescales: Elvis et al. 2004), implying a limit to the distance r of the absorber from the X-ray source of cm. Therefore Risaliti, Elvis Nicastro (2002) suggested that the absorber might be located in cool clouds present in an accretion disk wind on the scale of the Broad Emission Line Region (BELR). This echoes the model of Kartje, Königl & Elitzur (1999), which predicts NH variability down to a timescales of days. Variations of the overall level of the absorption may also be expected in the case of an ionized absorber responding to variations of the continuum level (see e.g Nicastro et al. 1999, Schurch & Warwick 2002). An accurate analysis of the temporal behaviour of the X-ray absorber can help us to gain precious information on its physics, size, geometry and location. Unfortunately, this has been possible so far in a handful of cases only (e.g. NGC 4388, Elvis et al. 2004, NGC 1365, Risaliti et al. 2005, Mkn 348, Smith et al. 2001), because of the strong parameter degeneracy in complex, multi-component spectral fittings, in particular between the absorber and the continuum parameters. High statistics, broad-band observations are crucial to remove this degeneracy. To this purpose, we have analyzed two BeppoSAX long (elapsed time days) observations of the bright Seyfert galaxy, NGC 4151, which are particularly well suited to further investigate this issue. In this paper we focus on the search for variability of the absorber on timescales from a few tens of ksec to years.
NGC 4151 is one of the brightest Seyfert galaxy in the sky in the X-ray band, and for this reason it has been studied in detail by all X-ray missions since the discovery of its X-ray emission in the 1971 (Gursky et al., 1971). The intrinsic continuum has historically been parameterizered by an absorbed power law, with variable intensity and photon index (, Ives, Sandford & Penston 1976, Barr et al. 1977, Paciesas, Mushotzky & Pelling 1977, Perola et al. 1986, Yaqoob, Warwick, & Pounds 1989, Fiore et al. 1990, Schurch and Warwick 2002, Zdziarski et al. 2002). A strong narrow iron Kα line is present in the spectrum. This line has an intensity of 1.8 10-4 ph cm-2 s-1 (HETGS (i.e. High-Energy Transmission Grating Spectrometer, Canizares 2000) Ogle et al. 2000). The narrow core of the line is unresolved, with FWHM2000 km s-1. The Fe Kα intensity remains constant over short-medium (days-months) timescales and varies by on timescales of about one year (Perola et al. 1986, Zdziarski et al. 2002, Schurch and Warwick 2002, Takahashi, Inoue and Dotani 2002, Schurch et al. 2003). These timescales suggest that the Fe Kα line arises in a region at a distance r cm from the nucleus. A Compton reflection component has been detected in the spectrum of NGC 4151 by Zdziarski et al. (2002), Schurch and Warwick (2002). At energies above 50 keV the continuum becomes steeper, and this change in slope can be modelled by an exponential cut-off with e-folding energy of 70250 keV (Zdziarski et al. 1996).
The nuclear power-law spectrum is heavily absorbed at E 6 keV by a photoelectric absorption due to a large amount of material along the line of sight (NH 10221023 cm-2). A single absorber does not provide a good fit, as recognized since the first Einstein observations (SSS, Holt et al. 1980). A better description of the spectrum is provided by an inhomogeneous absorber, which allows some fraction of the nuclear X-ray continuum to emerge with significantly less attenuation than the rest of the continuum. Both a partial covering absorber (Holt et al. 1980, Perola et al. 1986, Zdziarski et al. 2002) and an ionized absorber (Yaqoob, Warwick, & Pounds 1989, Weaver et al. 1994, Schurch and Warwick 2002) have been proposed in the past. Part of the emission is due to extended kpc-scale emission associated with the narrow line region (Elvis, Briel Henry, 1983, Ogle et al. 2000). Interestingly, changes of the absorbing screen(s) on timescales of days to years have been often reported in the past (Barr et al. 1977, Fiore et al. 1990, Yaqoob et al. 1993, Schurch & Warwick 2002). These changes have been interpreted in terms of creation and destruction of cold filaments and clouds in the BELR (Barr et al., 1977), or in terms of their orbital motion (Holt et al. 1980, Lawrence Elvis 1982). In the latter case, the inhomogeneous absorber consists of a large number of discrete clouds, each much smaller than the size of the X-ray source. The number of the clouds that, at any time, cover a given line of sight is distributed according to the Poisson statistics. Column density variations, in this scenario, are simply due to statistical fluctuations of the number of clouds along the line of sight. The thickness and size of the absorbing clouds can therefore be estimated by measuring amplitude and timescales of the column density variations. In models of a partially ionized absorber the variations in the underlying ionizing continuum change the optical depth of the absorber along the light of sight and so simulate a change in equivalent H column density, when the spectra are modelled with a neutral absorber. In this scenario, Schurch & Warwick (2002) interpret the spectral variability observed in a ASCA long look in terms of changes of the ionization state in response of variations of the underlying continuum flux. This interpretation relies on the assumption of a constant underlying continuum shape, evaluated using a broad-band BeppoSAX observation. In this paper we report on further BeppoSAX observations which reveal changes in the obscuring column density on timescales of a few days, which strongly constrain the geometry of the absorber. Thanks to the high statistics and broad spectral coverage we were able for the first time to investigate the nature of the observed variability without resorting on any a-priori assumption on the continuum emission.
The structure of this paper is the following: Section 2 gives some details on the data reduction, Section 3 illustrates the method used for the data analysis and presents the results of the temporal and spectral analysis, Section 4 is devoted to the discussion of our results and conclusions.
2 Observations and data reduction
To look for changes in the absorber(s) of NGC 4151 and to further investigate on its origin and geometry, we have selected the two longest observations performed with the BeppoSAX Narrow Field Instruments (Table 1), LECS (0.1-10 keV, Parmar et al. 1997), MECS (1.3-10 keV, Boella et al. 1997) and PDS (13-200 keV, Frontera et al. 1997), which have good sensitivity from 0.1 to at least 100 keV. Because of the complexity of the spectrum, an energy coverage as broad as possible is the key to obtain a good constrain on the absorption models. The first observation was performed between 1996 July 6 and 9 for a total elapsed time of ksec. During the observation the 2-4 keV flux increased by a factor 3, and therefore this observation is particularly well suited to search for spectral variability. The second observation was a target of opportunity observation (ToO) performed between 2001 December 18 and 20, for a total elapsed time of ksec, during a NGC 4151 outburst in the soft X-rays. This outburst was serendipitously detected by the BeppoSAX Wide Field Cameras, and a ToO observation of the source with the Narrow Field Instruments was promptly performed. In this observation the signal to noise is particularly good and allows us to search for small spectral variation, and for variation on short timescales.
The 1996 July observation was performed with MECS units 1, 2 and 3, while the 2001 December observation was performed with MECS units 2 and 3 only (on 1997 May 6 a technical failure caused MECS unit 1 to be switched off); data from the units were combined after gain equalization. The LECS was operated during dark time only, therefore LECS exposure times are smaller than MECS ones. Table 1 gives the LECS, MECS and PDS exposure times and the mean count rates.
| Instrument | channels | Energy range | Net counts s-1 | Exposure (s) |
|---|---|---|---|---|
| 1996 July 6-9 | ||||
| LECS | 41-370 | 0.45-4 keV | 0.1090.003 | 8960 |
| MECS | 37-227 | 1.65-10.5 keV | 1.4460.004 | 73620 |
| PDS | 50-580 | 15-200 keV | 4.09 0.03 | 35160 |
| 2001 December 18-20 | ||||
| LECS | 41-370 | 0.45-4 keV | 0.3950.003 | 43300 |
| MECS | 37-227 | 1.65-10.5 keV | 2.0700.004 | 114860 |
| PDS | 50-580 | 15-200 keV | 5.100.02 | 53290 |
Standard data reduction was performed using the SAXDAS software package version 2.0 following Fiore, Guainazzi Grandi (1999). In particular, data are linearized and cleaned of Earth occultation periods (we accumulated data for Earth elevation angles degrees) and unwanted periods of high particle background (satellite passages through the South Atlantic Anomaly and periods with magnetic cut-off rigidity GeV/c).
NGC 4151 lies 5 arcmin south of the relatively bright BL Lac object 1E1207.9+3945 (0.3-3.5 keV flux of , Gioia et al. 1990) and 5.2 arcmin south of the galaxy NGC 4156 (which is 20 times fainter than NGC 4151, Elvis et al. 1981, Fabbiano et al. 1992). To study the possible contamination from these two sources we compared the LECS and MECS spectra extracted from regions of 2, 3 and 4 arcmin radii. The spectra are all consistent with each other in shape and therefore we conclude that the contamination of the nearby sources is negligible, even in the 4 arcmin radius spectra. Since these spectra provide the best signal to noise, we use them in the following analysis.
Background spectra were extracted in detector coordinates from high Galactic latitude ‘blank’ fields (98_11 release) using regions equal in size to the source extraction region. We have compared the mean level of the background in the LECS and MECS “blank fields” observations to the mean level of the background in the NGC 4151 observations using source free regions at various positions in the detectors. The “local” MECS, LECS background count rates are within a few per cent of those in the “blank fields”.
The PDS data were reduced using the “variable risetime threshold” technique to reject particle background (see Fiore, Guainazzi Grandi 1999). To check the reliability of the background subtraction in the PDS spectra we looked at the spectrum between 200 and 300 keV, where the effective area of the PDS to X-ray photons is small and therefore the source contribution is negligible. After background subtraction we obtain a count rate of 0.010.01 counts s-1, for the 1996 July observation and 0.0030.009 counts s-1 for the 2001 December observation, fully consistent with the expected value of 0. The BL Lac object 1E1207.9+3945 and the galaxy NGC 4156 contribute less than a few per cent to the PDS flux, based on the extrapolation of the 2-10 keV spectrum of these sources to higher energies, assuming a power law spectrum with (Perlman et al., 1996) and a 7 keV exponential spectrum (Burstein et al., 1997) respectively. NGC 4151 is detected with a signal to noise ratio up to 130140 keV in the two observations.
Spectral fits were performed using the XSPEC 11.2.0 software package and the most recent responses (1999 December release). For both LECS and MECS we used the standard on-axis responses, since the source is close to the default pointing position (within 5 raw pixels, i.e. 40 arcsec). LECS and MECS spectra were binned following two criteria: (a) allowing at least four channels per resolution element at all energies, when possible, and (b) to obtain at least 20 counts per energy channels.
Constant normalization factors have been introduced in the fitting models in order to take into account the intercalibration systematics between the instruments (Fiore, Guainazzi Grandi, 1999). The normalization factor between the LECS and the MECS instruments, assuming the MECS as a reference, has been obtained by fitting the LECS and MECS spectra in the common 1.65-4 keV band with a simple power law model. We obtained a normalization factor of 0.40 for the 1996 July observation and a factor of 0.60 for the 2001 December observation. Accordingly, in all the following fits the LECS-MECS factor is constrained to vary in the above ranges for the 1996 July observation and for the 2001 December observation respectively. The LECS-MECS normalization factor is somewhat lower than usually assumed (see Fiore, Guainazzi Grandi 1999), due to the adopted LECS source extraction region of radius 4 arcmin, smaller than the typical one (because of confusion problems, see above). The normalization factor adopted between the PDS and the MECS instruments is constrained to vary between 0.72 and 0.87, as recommended (see Fiore, Guainazzi Grandi 1999).
In the spectral fits we used the LECS between 0.45-4 keV (channels 41-370), MECS between 1.65-10.5 keV (channels 37-227), and the PDS between 15-200 keV (channels 50-580). Errors throughout the paper are quoted at a significance level of 90% for two interesting parameters ( Lampton et al. 1976), unless differently specified.
3 Data analysis
The aim of this paper is to search for variations of the absorber(s) on timescales from a few tens of ksec to years. The total absorbing column density measured toward NGC 4151 ranges from a few cm-2 to a few cm-2 and the corresponding photoelectric cut-off lies in the 2-4 keV energy range. This band is therefore best suited to monitor changes in the absorber. The 6-10 keV and 15-100 keV bands, being less affected by photoelectric absorption can be used to monitor the continuum, normalization and power law photon index.
3.1 Light curves analysis


Light curves of the count rate in the three energy bands 2-4 keV, 6-10 keV, 15-100 keV, and the softness ratios 2-4 keV/6-10 keV and 6-10 keV/15-100 keV, are plotted in figures 1 and 2 in bins of 5500 seconds ( 1 satellite orbit). The analysis of both count rate and softness ratio light curves indicates large spectral variations on timescales from a few tens of ksec to a few days.
On longer timescales (i.e. the 4.5 years between the two observations), we find similar results.The 6-10 keV count rates in the intervals A and B of the 1996 July observation are similar to the corresponding count rates recorded during the 2001 December observation (see figures 3), as well as the the 6-10 keV/15-100 keV softness ratios. Conversely, the 2-4 keV/6-10 keV softness ratios are different by a factor 2 (see figure 4). The similarity of the higher energy count rates (and 6-10 keV/ 15-100 keV softness ratios) suggests a comparable photon index in the range 1.75-1.85 (assuming a simple power law model reduced at low energy by a uniform column of cold gas). On the other hand, the difference in the 2-4 keV/6-10 keV ratios can be naturally explained by secular changes of the absorber of .


3.2 Spectral analysis


The statistics of the spectra extracted in 5500 s bins is not high enough to constrain complex models. To characterize the spectral variability we therefore accumulated spectra in contiguous time intervals when the source does not display large spectral variations. We selected four time intervals for each of the two observations to perform a time resolved spectral analysis (indicated as A, B, C and D in figure 1 and as J, K, L, M in figure 2). The counts spectra in these time intervals are plotted in the upper panels of figures 5 and 6. The lower panels plot the same spectra normalized to the lower count rate spectrum of each observation. The largest variations are seen below keV, thus suggesting variations of the absorber(s).
The comparison of figures 5 and 6 suggests that the absorber variations during the 2001 December observation are smaller than those in the 1996 July observation, but qualitatively similar. To fully characterize the observed spectral variations we performed a detailed spectral analysis of the spectra plotted in figures 5 and 6. We have adopted a model including the following components. The hard X-ray continuum is described by a power-law with an exponential high-energy cut-off plus a neutral Compton reflection component (the PEXRAV model in XSPEC, Magdziarz Zdziarski 1995). The latter component can be safely assumed constant on timescales from days to months (see e.g. Johnson et al. 1997) and therefore its normalization has been fixed to the best fit value found fitting the spectra of each complete observation. A narrow iron Kα emission line with energy set to 6.4 keV (rest frame) is added to this continuum.
The soft X-ray continuum is described by two components, a thermal bremsstrahlung component (Elvis et al. 1990, Weaver et al. 1994 and references therein), and a scattering component (Weaver et al., 1994). The thermal component can be safely assumed constant on the timescales spanned by our observations and therefore we fixed temperature and normalization to the best fit values found by fitting the total 2001 December spectrum (T0.18 keV and a 0.4-4 keV flux of erg cm-2 s-1). The low energy scattering component, parameterizered by a power law, is likely produced by scattering of the nuclear power law by warm-hot gas distributed on scales greater than parsec (Ogle et al. 2000, Yang et al. 2001).Therefore, also this component can be safely assumed constant on the timescales spanned by our observations. We fixed its photon index to 1.7 and the normalization to the best fit values found by fitting the total spectra (0.4-4 keV flux of erg cm-2 s-1 and of 4.5 erg cm-2 s-1 for the 1996 July and the 2001 December observations, respectively).
The complex absorber has been parameterizered in three different ways: A) two neutral components, one covering the nucleus totally and the other covering the nucleus only partly; B) one neutral absorber and one ionized absorber both covering the nucleus totally; and C) one ionized absorber covering the nucleus totally and one neutral absorber covering the nucleus only partly. A Galactic column density along the line of sight of N cm-2 (Murphy et al. 1996) has been added to the model in all cases.
Models A) and B) have seven free parameters: the photon index , normalization and the energy of the cut-off of the nuclear continuum, three parameters for the absorber (NH, NHc, cv, or NH1, NHw, and the ionization parameter ) and the normalization of the iron Kα line. Model C) has one more free parameter (the covering fraction of the neutral absorber).
Model A) provided the smallest in both 1996 July and 2001 December observations. We then discuss first the results of this series of fits and then compare them with the results obtained using models B) and C). Tables 2 and 3 give the best fit values of NH, NHc, cv, , along with the , the count rate and the flux in the 6-10 keV band, for the four spectra selected in each observation. In all cases the fits are acceptable at a confidence level better than . Figure 7 shows the 68%, 90%, and 99% confidence contours of NHc versus , NH versus c and Cv versus NH for the 1996 July and the 2001 December observations.
| spectrum | NHa | NHcb | cvc | d | c6-10e | F6-10f | |
|---|---|---|---|---|---|---|---|
| A | 149.20/151 | 6.2 | 30.3 | 0.71 | 1.79 | 0.41 | 5.5 |
| B | 147.74/138 | 4.6 | 14.0 | 0.7 | 1.77 | 0.45 | 6.0 |
| C | 119.10/118 | 2.6 | 11.6 | 0.6 | 1.82 | 0.64 | 8.2 |
| D | 124.29/118 | 2.4 | 10.0 | 0.6 | 1.77 | 0.73 | 9.7 |
a column density of the totally covering absorber in unit of cm-2, b column density of the partial covering absorber in unit of cm-2,c covering factor, d photon index, e 6-10 keV count rate, f MECS 6-10 keV flux in 10-11 .
| spectrum | NHa | NHcb | cvc | d | c6-10e | F6-10f | |
|---|---|---|---|---|---|---|---|
| J | 134.22/136 | 1.4 | 6.1 | 0.5 | 1.80 | 0.50 | 10.0 |
| K | 134.43/136 | 1.6 | 6.3 | 0.6 | 1.82 | 0.43 | 8.5 |
| L | 168.93/136 | 1.6 | 6.7 | 0.50 | 1.82 | 0.46 | 9.2 |
| M | 152.55/135 | 2.2 | 10.8 | 0.41 | 1.81 | 0.49 | 9.7 |
a column density of the totally covering absorber in unit of cm-2, b column density of the partial covering absorber in unit of cm-2, c covering factor, d photon index, e 6-10 keV count rate, f MECS 6-10 keV flux in 10-11 .
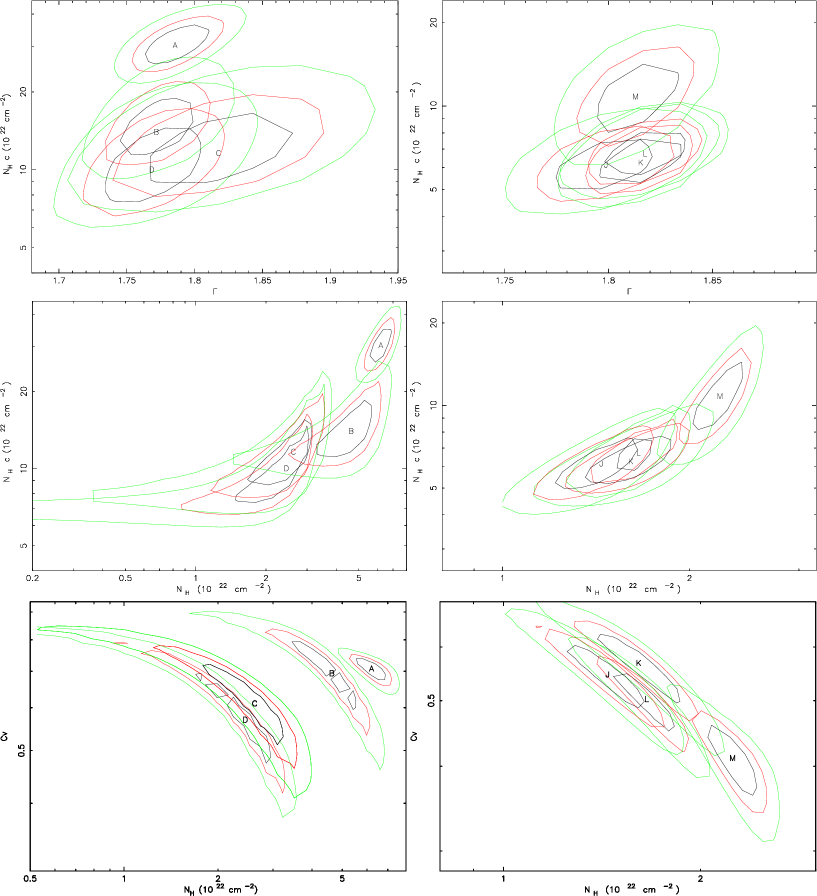
During both observations the photon index is constant at a confidence level better than 68% while both absorbers undergo significant changes. During the 1996 July observation NHc and NH both change by at a confidence level better than from A to C. Significant (at a confidence level better than 90 %) but smaller changes are also present from spectra A to B. On the other hand, the covering factor cv is consistent with a constant value within the relatively large errors, expecially for spectra C and D. During the 2001 December observation we detect significant changes of the absorbers, despite smaller flux variations. NHc and NH change at a confidence level better than by and from L to M respectively. The covering factor changes by 25% at a confidence level better than 90% from J to M.
We remark that statistically significant changes of the absorber parameters have been obtained leaving the power law continuum parameters free to vary and therefore we can exclude that they are spurious results of subtle variations of the continuum shape. Having assessed this, we can now fix the continuum shape so as to obtain better constraints on the absorber parameters. Since the covering factor turned out to be constant or limited within a narrow range, we also fix it in the next series of fits. These new constraints do not worsen the fit, the total increasing by 14 for 16 additional degrees of freedom. Figure 8 shows the NH – c confidence contours for the two observations for this series of fits. The magnitude of the variations of both parameters is similar to those reported above, but of course now the contours are smaller, and therefore the variations are more statistically significant. In the July 1996 observation the variations of NH and NHc seems correlated one to the other (figure 8). This may appear unexpected, but it should be considered that real absorbers would have smooth edges and therefore NH would vary smoothly, covering the source with a continuous set of NH values. If this is the case, and if there has been a large variation of the denser absorber NHc, it is not surprising to find a correlation between the two parameters of our simple representation of this complex structure.
In addition to the partial covering model (A), we now explore two versions of a more complex absorption structure, namely the presence of an ionized absorber (models B and C).
Tables 4 and 5 report the best fit parameters of model B, obtained letting the continuum photon index free to vary and fixing it to its average value (the photon index is again consistent with a constant value during each observation).
The quality of the fit using model B is worse than that of model A at a high level of confidence for spectrum A (). It is worse for spectrum C and J, K, L, M () and it is similar only for spectrum B. The analysis of the residuals shows that warm absorber models systematically underpredict the observed spectrum between 1.7 and 2.5 keV. Of course this effect is more prominent in spectrum A. We used a simple equilibrium photoionization model ABSORI in XSPEC. Conversely, Schurch & Warwick (2002) argues that the variable absorber in NGC 4151 is often in a non-equilibrium ionization state. This may help in explaining the poor fits obtained with ABSORI. Interestingly, the ionization parameter of spectrum D of the 1996 July observation, when the source was in a high continuum state, is 2-10 times higher than that of spectra A and B, when the source was in a low state, although the errors are rather large. This behaviour is fully consistent with the warm absorber scenario.
Finally, we investigated model C, similar to that proposed by Piro et al. (2005). This produces ionization parameters consistent with zero in all cases, thus reproducing model A.
| sa | NH1b | NHc | d | e | f | NH1g | NHh | i | |
|---|---|---|---|---|---|---|---|---|---|
| A | 229.5/151 | 6.0 | 20.0 | 210 | 1.69 | 235.1/152 | 6.3 | 20.6 | 220 |
| B | 146.6/138 | 5.2 | 17.6 | 45 | 1.72 | 146.8/139 | 5.3 | 17.3 | 40 |
| C | 123.4/118 | 2.2 | 15.4 | 140 | 1.74 | 124.2/119 | 1.8 | 14.9 | 140 |
| D | 139.3/118 | 3.3 | 13.1 | 530 | 1.70 | 139.5/119 | 4.0 | 13.5 | 520 |
a time interval,b column density of the fully covering absorber in unit of cm-2, c column density of uniform ionized absorber in unit of cm-2,d absorber ionization parameter (L/nR2, see Done et al. 1992),e photon index, f for fixed to 1.71, g, h and i as b, c and d respectively, for fixed to 1.71.
| sa | NH1b | NHc | d | e | f | NH1g | NHh | i | |
|---|---|---|---|---|---|---|---|---|---|
| J | 144.7/136 | 1.5 | 7.8 | 360 | 1.73 | 146.6/137 | 1.5 | 8.3 | 370 |
| K | 141.9/136 | 1.7 | 9.8 | 460 | 1.77 | 144.0/137 | 1.8 | 9.1 | 440 |
| L | 187.9/136 | 1.8 | 9.3 | 610 | 1.77 | 190.4/137 | 1.8 | 8.6 | 590 |
| M | 169.6/135 | 2.0 | 8.7 | 560 | 1.74 | 171.2/136 | 2.1 | 9.4 | 640 |
a time interval, b column density of the fully covering absorber in unit of cm-2, c column density of uniform ionized absorber in unit of cm-2,d absorber ionization parameter (L/nR2, see Done et al. 1992),e photon index f for fixed to 1.76, g, h and i as b, c and d respectively, for fixed to 1.76.


|
4 Discussion
We have analyzed two long (elapsed time days) BeppoSAX observations of NGC 4151 searching for variability of the absorber on timescales from tens of ksec to years . We find significant low energy spectral variations in the softness ratio light curves of both observations suggesting that the absorption changed during the observations.
To characterize the spectral variability we used three models as a parameterization of the absorption: A) a partial covering absorber plus a uniform absorber, both neutral; B) one neutral absorber and one ionized absorber both covering the nucleus totally; and C) one ionized absorber covering the nucleus totally and one neutral absorber covering the nucleus only partly. The simplest partial covering model A provided the smallest in both 1996 July and 2001 December observations. Factor of changes of both the uniform and the partial covering absorbers have been obtained leaving the spectral index free to vary.
During the 2001 December observation the mean 6-10 keV count rate is only slightly higher than that of the low flux intervals of the 1996 July observations, but NH and NHc are a factor of about 3 smaller. They are also smaller than those in the 1996 July C and D intervals. Indeed the low energy absorption during the 2001 December observation is among the lowest ever measured in NGC 4151, as can be seen in figure 9, where we compare the best fit NHc and cv of the two BeppoSAX observations with a compilation of data from literature. The covering factor in the 2001 December observation appears lower than in all other historical observations with similar 2-10 keV flux. This suggests that on long timescales (years) the variations of the covering factor are not (or not only) correlated with the X-ray continuum.

The partial covering model is a convenient parameterization, but does not have
a direct physical interpretation. A more physical model is the clumpy absorber
of Holt et al. (1980). In this model the absorbing medium is composed of a
large number of small clouds, the column density of an individual cloud being
nc and the mean number of clouds along a particular line of sight being
(Holt et al., 1980). In this scenario, the observed variations of the column
density are due to Poissonian fluctuations of the number of clouds, .
The covering factor cv spans from to in
observations, with c in only one case (figure 9). An
immediate estimate of the probability of having no clouds along the line of
sight is P(1/50, which implies . A better estimate
can be obtained assuming a gaussian distribution of cv around the average
value c, with , implying
.
During the 1996 July observation the largest variation of the
column density is cm-2 on timescales as short as
days. This timescale has strong implications for the location of
the obscuring matter. Assuming that the absorbing medium is made by spherical
clouds moving with Keplerian velocities around the central black hole
(M, Peterson et al. 2004), and identifying the
above -day timescale with the crossing time of a cloud, the
absorbing medium would be located at the distance from the nucleus, r RS, where is the
density in units of 1010 cm-3, is the timescale in units of
two days and RS is the Schwarzschild radius (Risaliti, Elvis Nicastro, 2002). If the X-ray
absorber has a density typical of the clouds in the BELR,
1091011 cm-3, then it would be located at a distance
from the nucleus 340 RSr3.4RS. This range includes
the distance of the BELR, as inferred from reverberation mapping of the
H, C iv, Mg ii and H line (Wandel, Peterson and Malkan 1999,
Clavel et al. 1990, Sergeev 1994) and from theoretical estimates of the outer
radius of the BELR (Cassidy and Raine 1997). If the X-ray absorber lies in the parsec
scale dusty molecular torus (Krolik Begelman 1988, Pier Krolik 1992, Pier Krolik 1993),
its density would be cm-3. The X-ray absorber
would then be a very compact slab (thickness RS, i.e. ) at parsec distance from the nucleus, which is a
physically unlikely structure. We then conclude that the most likely location
of the X-ray absorber is within the BELR. If the clouds absorbing the X-rays
are pressure-confining by a hot medium surrounding the BELR, this confining
gas would produce a thermal emission. Interpreting the 0.5-2 keV luminosity of
the thermal bremsstrahlung during the December 2001 observation
(1041 ), as due to this confining gas, the size of the region
containing the thermal gas is 1104 T n
RS, where T7 and n7 are the temperature and the density in units of
107 K and 107 cm-3 respectively. This is consistent with the
distance from the nucleus of the BELR, and therefore a pressure-confining
medium can not be excluded.
Variations of the X-ray absorber on timescales of days are expected in the model proposed by Elvis (2000) for type 1 AGN and extended to type 2 AGN by Risaliti, Elvis Nicastro (2002). In the model of Elvis (2000), a wind arises vertically from a narrow region on the accretion disk and it is then radially accelerated by the radiation pressure (Murray et al. 1995, Kartje, Königl & Elitzur 1999). The wind is both warm (106 K) and highly ionized, with a density cm-3, which puts it in pressure equilibrium with the BELR clouds. The BELR is then a cool phase embedded in the wind and absorbing the X-rays coming from the nucleus. In the wind model the X-ray absorber is axisymmetric, like the torus, but the typical size and dynamic state in the two cases are quite different. In particular the X-ray absorber is located a few light days from the nucleus, then changes of the column density and/or of the covering factor are naturally expected on timescales greater than a few days. Elvis et al. (2004) have found a factor of 100 decrease in the column density toward the normally almost Compton-thick (0.1-0.3) type 2 AGN NGC 4388 on timescales either 2 days or 4 hr, thus giving further support to the “wind” model. Such model naturally predicts an absorber made by a cold and a warm phase.
We tested this scenario through our models B and C. The best fit ionization parameters are roughly in the range found by Schurch & Warwick (2002). Although the behaviour of the ionization parameter in model B is nicely consistent with the expectations, with the absorber ionization parameter roughly correlated with the intrinsic flux, the results are not satisfactory from the statistical point of view, indicating that the physical and geometrical structure of the absorber is more complex than any of our simple parameterizations. Model C, similar to that proposed by Piro et al. (2005) produces best fit ionization parameters consistent with zero in all cases, thus reproducing model A. In particular, our time dependent spectral analysis does not confirm the Piro et al. (2005) claim of a significant highly ionized iron absorption feature. Therefore a word of caution is necessary concernig the presence of a relativistic outflow in this source.
To better locate the X-ray absorber, long monitoring of the source with instruments with good energy resolution and high sensitivity (to collect high quality spectra in a few thousands of seconds) are needed. Simultaneous optical monitoring of the source would allow us to search for dust features, and therefore to understand how much dust lies in the region occupied by the X-ray absorber. Simultaneous X-ray and optical-UV spectroscopy could also be used to investigate whether broad emission lines emerge when the column density of the absorber along the line of sight is decreasing. X-ray spectroscopy on short timescales ( ksec) could also be used to determine whether the change of the absorbing column is step-wise (as expected for discrete clouds with sharp edges) or more continuous, by giving a measure of the ’fuzziness’ of the clouds (i.e. their column density gradients).
Recently, De Rosa et al. (2007) reported a time resolved spectral analysis of the 1996 July observation, finding significant variations of the complex absorber on timescales similar to those found in this paper. De Rosa et al. also note, in agreement with our findings, that the level of absorbtion during the 2001 December obervation is one of the lowest ever recorded, an episode during which the source was unusually uncovered.
Acknowledgements
This work was partially supported from NASA grant G02-3142X. We thank Giuseppe Cesare Perola for useful discussions.
References
- Antonucci (1993) Antonucci, R. 1993 ARAA, 31, 47
- Barr et al. (1977) Barr, P., White, N. E., Sanford, P. W. 1977, MNRAS, 181, 43
- Barvainis (1987) Barvainis R. 1987, ApJ, 320, 537
- Boella et al. (1997) Boella, G., Chiappetti, L., Conti, G. et al. 1997, AAS, 122, 299
- Burstein et al. (1997) Burstein, D., Jones, C., Forman, W. et al. 1997, ApJS, 111, 163
- Canizares (2000) Canizares, C. R., http://space.mit.edu/HETG/
- Cassidy and Raine (1997) Cassidy I. and Raine D. J. 1997, A A 322, 400
- Clavel et al. (1990) Clavel, J., Boksenberg, A., Bromage, G. E. et al. 1990, MNRAS, 246, 668
- De Rosa et al. (2007) De Rosa, A., Piro, L., Perola, G. C. et al. arXiv:astro-ph/0611470
- Done et al. (1992) Done, C., Mulchaey, J. S., Mushotzky, R. F. et al. 1992, ApJ, 395, 275
- Elvis et al. (1981) Elvis, M., Schreier, E. J., Tonry, J. et al. 1981 ApJ, 246, 20
- Elvis, Briel Henry, (1983) Elvis, M., Briel, U. G., Henry, J. P. 1983, ApJ, 268, 105
- Elvis et al. (1990) Elvis, M., Fassnacht, C., Wilson, A. S., Briel 1990, ApJ, 361, 459
- Elvis (2000) Elvis, M. 2000 ApJ, 545, 63
- Elvis et al. (2004) Elvis M., Risaliti G., Nicastro N. et al. 2004, ApJ, 615L, 25
- Fabbiano et al. (1992) Fabbiano, G., Kim, D.-W., Trinchieri, G. 1992, ApJS, 80, 531
- Fiore et al. (1990) Fiore, F., Perola, G. C., Romano, M. 1990, MNRAS, 243, 522
- Fiore, Guainazzi Grandi (1999) Fiore, F., Guainazzi, M. & Grandi, P. 1999,Handbook for BeppoSAX NFI spectral analysis,ftp://ftp.asdc.asi.it/pub/sax/doc/software_docs/saxabc_v1.2.ps.gz or http://heasarc.gsfc.nasa.gov/docs/sax/abc/saxabc/saxabc_v1.2.ps.gz
- Frontera et al. (1997) Frontera, F., Costa, E., dal Fiume, D. et al. 1997, AAS, 122, 357
- Gioia et al. (1990) Gioia, I. M., Maccacaro, T., Schild, R. E. et al. 1990, ApJS, 72, 567
- Gursky et al. (1971) Gursky, H., Kellogg, E. M., Leong, C. et al. 1971, ApJ, 165L, 43
- Holt et al. (1980) Holt, S. S., Mushotzky, R. F., Boldt, E. A. et al. 1980,ApJ, 241L, 13
- Ives, Sandford & Penston (1976) Ives, J. C. Sandford, P. W. & Penston, M. V., 1976, AJ, 207, 159
- (24) Johnson, W. N., McNaron-Brown, K., Kurfess, J. D. et al. 1997, ApJ, 482, 173
- Kartje, Königl & Elitzur (1999) Kartje, J. F., Königl, A. & Elitzur, M. 1999, ApJ, 513, 180
- Krolik Begelman (1988) Krolik, J. H. Begelman M. C. 1988, ApJ, 329, 702
- Lampton et al. (1976) Lampton M., Margon B. Bowyer S., 1976, ApJ 208, 1771
- Lawrence Elvis (1982) Lawrence, A. Elvis, M. 1982, ApJ, 256, 410
- Magdziarz Zdziarski (1995) Magdziarz, P. Zdziarski, A. A. 1995, MNRAS, 273, 837
- Murphy et al. (1996) Murphy, E. M.; Lockman, F. J.; Laor, A. et al. 1996 ApJS, 105, 369
- Murray et al. (1995) Murray, N., Chiang, J., Grossman, S. A. et al. 1995 ApJ, 451, 498
- (32) Nicastro, F., Fiore, F., Perola, G. C., Elvis, M. 1999, ApJ, 512, 184
- Ogle et al. (2000) Ogle, P. M., Marshall, H. L., Lee, J. C. et al. 2000, ApJ, 545, 81
- Paciesas, Mushotzky & Pelling (1977) Paciesas, W. S., Mushotzky, R. F. & Pelling, R. M. 1997, MNRAS, 178, 23
- Parmar et al. (1997) Parmar, A. N., Martin, D. D. E., Bavdaz, M.et al. 1997, AAS, 122, 309
- Perlman et al. (1996) Perlman E. S., Stocke, J. T., Wang, Q. D. et al. 1996, ApJ, 456, 451
- Perola et al. (1986) Perola, G. C., Piro, L., Altamore, A. et al. 1986, ApJ, 306, 508
- Peterson et al. (2004) Peterson, B. M., Ferrarese, L., Gilbert, K. M. et al. 2004, ApJ, 613, 682
- Pier Krolik (1992) Pier, E. A. Krolik, J. H. 1992 ApJ, 399L, 23
- Pier Krolik (1993) Pier, E. A. Krolik, J. H. 1993 ApJ, 418, 673
- Piro et al. (2005) Piro L., De Rosa A., Matt G. and Perola, G. C. 2005, A&AL, 441, L13
- Pounds et al. (1986) Pounds, K. A., Warwick, R. S., Culhane, J. L. et al. 1986, MNRAS, 218, 685
- Risaliti, Elvis Nicastro (2002) Risaliti, G., Elvis, M., Nicastro, F. 2002 ApJ, 571, 234
- Risaliti et al. (2005) Risaliti, G., Elvis, M., Fabbiano G. et al. 2005, ApJ, 623L, 93
- Takahashi, Inoue and Dotani (2002) Takahashi, K., Inoue, H. and Dotani T., 2002, PASJ, 54, 373
- Schurch and Warwick (2002) Schurch, N. J. and Warwick, R. S. 2002, MNRAS, 334, 811
- Schurch et al. (2003) Schurch, N. J., Warwick, R. S., Griffiths R. E. et al 2003, MNRAS, 345, 423
- Sergeev (1994) Sergeev, S. G. 1994,ARep, 38, 162
- (49) Smith, D. A., Georgantopoulos, I., Warwick, R. S. 2001, ApJ, 550, 635
- Urry Padovani (1995) Urry Padovani 1995, PASP, 107, 803
- Yaqoob, Warwick, & Pounds (1989) Yaqoob, T., Warwick, R. S., Pounds, K. A 1989, MNRAS, 236, 153
- Yaqoob & Warwick (1991) Yaqoob, T. and Warwick, R. S. 1991, MNRAS, 248, 773
- Yaqoob et al. (1993) Yaqoob, T., Warwick, R. S., Makino, F. et al. 1993, MNRAS, 264, 411
- Yang et al. (2001) Yang, Y., Wilson, A. S., Ferruit, P. et al. 2001, ApJ, 563, 124
- Wandel, Peterson and Malkan (1999) Wandel, A., Peterson, B. M. and Malkan, M. A.1999, ApJ, 526, 579
- Warwick Done and Smith (1995) Warwick R. S., Done C. and Smith D. A. 1995 MNRAS, 275, 1003
- Weaver et al. (1994) Weaver, K. A., Yaqoob, T., Holt, S. S. et al. 1994, ApJ, 436L, 27
- Zdziarski et al. (1996) Zdziarski, A. A., Johnson, W. N., Magdziarz, P. 1996, MNRAS, 283, 193
- Zdziarski et al. (2002) Zdziarski, A. A., Leighly, K. M., Matsuoka, M. et al. 2002, ApJ, 573, 505