The X-ray Evolution of Early-Type Galaxies in the Extended Chandra Deep Field-South
Abstract
We investigate the evolution over the last 6.3 Gyr of cosmic time (i.e., since ) of the average X-ray properties of early-type galaxies within the Extended Chandra Deep Field-South (E-CDF-S). Our early-type galaxy sample includes 539 objects with red-sequence colors and Sérsic indices larger than , which were selected jointly from the COMBO-17 (Classifying Objects by Medium-Band Observations in 17 Filters) and GEMS (Galaxy Evolution from Morphologies and SEDs) surveys. We utilize the deep Chandra observations over the E-CDF-S and X-ray stacking analyses to constrain primarily the average X-ray emission from “normal” early-type galaxies (i.e., those that are not dominated by luminous active galactic nuclei [AGNs]). In our analyses, we study separately optically luminous ( ) and faint ( ) galaxy samples, which we expect to have soft (0.5–2.0 keV) X-ray emission dominated by hot (1 keV) interstellar gas and low mass X-ray binary (LMXB) populations, respectively. We detect individually 49 (9%) of our galaxies in the X-ray band, and classify these sources as either normal early-type galaxies (17 galaxies) or AGN candidates (32 galaxies). The AGN fraction of our optically luminous samples evolves with redshift in a manner consistent with the evolution observed in other investigations of X-ray-selected AGNs. After removing potential AGNs from our samples, we find that the X-ray–to–-band mean luminosity ratio () for optically luminous early-type galaxies does not evolve significantly over the redshift range 0.0–0.7. This lack of X-ray evolution implies a general balance between the heating and cooling of the hot interstellar gas. If transient AGN activity is largely responsible for maintaining this balance, then we infer that mechanical power must be dominating the feedback out to . Furthermore, in this scenario the average mechanical AGN power must remain roughly constant over the last half of cosmic time despite significant evolution in the average AGN radiative luminosity. For our optically faint early-type galaxies, we find suggestive evidence that increases with redshift over the range 0.0–0.5; however, due to limited statistical constraints on both the local ratio and the AGN contamination of our samples, we consider this result to be marginal.
1 Introduction
Distant ( 0.1–3), isolated early-type galaxies have been studied extensively at optical and near-IR wavelengths. The optical luminosities of early-type galaxies with rest-frame red-sequence colors have faded by 1 magnitude since (e.g., Bell et al. 2004a; McIntosh et al. 2005; Treu et al. 2005, 2006; van der Wel et al. 2005). Furthermore, little star-formation activity is observed within these galaxies out to at least (e.g., Bell et al. 2005) indicating that this observed evolution is consistent with the passive aging of old stars. However, the luminosity density of red-sequence galaxies has been observed to remain approximately constant over 0.1–0.7 (e.g., Bell et al. 2004a; Faber et al. 2006), and since these galaxies appear to be fading passively with cosmic time, this suggests that an important fraction (1/2) of the current stellar-mass content of the early-type galaxy population has emerged since . One explanation for these observations is that relatively young, lower-mass galaxies continuously populate the red-sequence (e.g., van der Wel et al. 2004; Thomas et al. 2005) through either a downsizing mass-assembly scenario (e.g., Cowie et al. 1996; Bundy et al. 2005; Cimatti et al. 2006; De Lucia et al. 2006; Lee et al. 2006) and/or a scenario where lower-mass early-type galaxies have different merging histories than their higher-mass counterparts (e.g., Khochfar & Burkert 2003). At , distant red galaxies (DRGs; selected using colors) and extremely red objects (EROs; or selected), some of which are likely progenitors to early-type galaxies, appear to have large star-formation rates and inferred dynamical masses similar to those observed for massive local ellipticals (e.g., Förster–Schreiber et al. 2004; McCarthy 2004; van Dokkum et al. 2004; Papovich et al. 2006). These analyses suggest that the majority of the stellar mass within many massive early-type galaxies formed at , possibly during a dust-obscured far-infrared-luminous phase (e.g., Chapman et al. 2005; Swinbank et al. 2006).
1.1 X-ray Properties of Early-Type Galaxies
X-ray investigations of local early-type galaxies have revealed that the total X-ray luminosity is correlated with optical luminosity (e.g., Trinchieri & Fabbiano 1985; Canizares et al. 1987; Brown & Bregman 1998; O’Sullivan et al. 2001; Ellis & O’Sullivan 2006). X-ray emission from local early-type galaxies originates primarily from a combination of hot interstellar gas and low mass X-ray binaries (LMXBs), and due to their relatively low star-formation rates (SFRs) per unit stellar mass (typically SFR/– Gyr-1 for 0.0–0.7 galaxies with ; e.g., Feulner et al. 2006), these galaxies are expected to have negligible contributions from high mass X-ray binaries (HMXBs; e.g., Grimm et al. 2002). Two fairly distinct classes of early-type galaxies, which can be divided by optical luminosity at , have been identified. Early-type galaxies with are referred to as “optically luminous” and those with are referred to as “optically faint.”
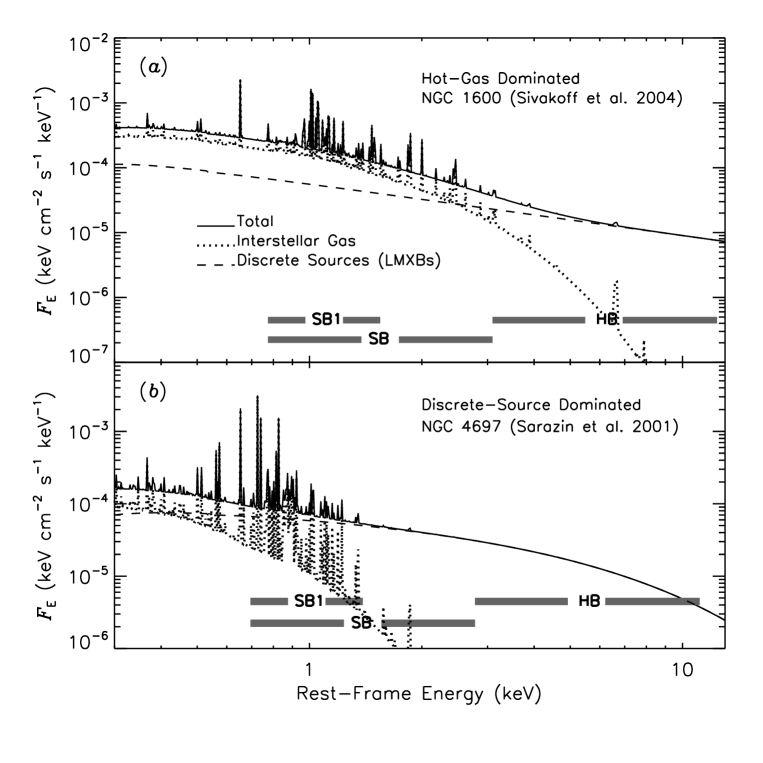
Optically luminous early-type galaxies in the local universe are generally observed to have X-ray emission powered largely by hot ( 0.3–1 keV) interstellar gas at soft (0.5–2.0 keV) X-ray energies and LMXBs at hard (2–10 keV) X-ray energies (e.g., Matsumoto et al. 1997). Figure 1a illustrates the X-ray spectrum of NGC 1600 (Sivakoff et al. 2004), a representative optically luminous early-type galaxy; the hot-gas and LMXB components have been separated for illustrative purposes. The X-ray luminosities for optically luminous early-type galaxies are correlated with their optical luminosities following . Stellar winds generate the gas and high-velocity interactions and Type Ia supernovae heat it to X-ray temperatures (e.g., Sarazin 1997). Galaxies with larger stellar masses and deeper gravitational potential wells generally have higher stellar velocity dispersions and thus provide more significant heating of the gas. Therefore, the – relation is manifested as a result of proportionalities between the stellar mass in a particular galaxy (traced by ) and the stellar velocity dispersion of that galaxy (traced by ; e.g., Mahdavi & Geller 2001).
Optically faint early-type galaxies in the local universe have soft X-ray emission characterized by a power-law () component from LMXBs and a mild contribution from hot interstellar gas (i.e., a thermal plasma with keV). At hard X-ray energies, the emission is completely dominated by LMXBs. The total X-ray luminosities of optically faint early-type galaxies are observed to be linearly correlated with their optical luminosities (i.e., ). This linear correlation is thought to arise largely as a result of the number of LMXBs in a given galaxy being proportional to the stellar mass within that galaxy (e.g., Gilfanov 2004). Due to their low luminosities, few optically faint early-type galaxies have been studied in detail in the X-ray band, and the presently available data for these galaxies are plagued by large scatter due to small numbers of LMXBs per galaxy and varying contributions from hot interstellar gas (e.g., David et al. 2006). Therefore, much of what is known about LMXBs in these galaxies comes from studying optically luminous early-type galaxies that have little contamination from hot interstellar gas (i.e., X-ray faint early-type galaxies). Figure 1b shows the X-ray spectrum of NGC 4697 (e.g., Sarazin et al. 2001), an X-ray faint (yet optically luminous) early-type galaxy, which is expected to be representative of the typical optically faint early-type galaxy X-ray spectrum.
1.2 Physical Properties of the X-ray Emitting Components
The two early-type galaxy classes discussed above (optically luminous and faint) generally differ in their relative spectral contributions from hot interstellar gas and LMXBs. An important component of the X-ray emission from early-type galaxies, most notably in optically luminous sources, is the hot interstellar gas. Detailed observations of the gas have shown that it radiates strongly but does not appear to be cooling as expected (e.g., Xu et al. 2002; 7.1 of Mathews & Brighenti 2003 and references therein; Tamura et al. 2003; Bregman et al. 2005). The observed gas temperatures and densities of the central regions of optically luminous early-type galaxies (e.g., Fukazawa et al. 2006) imply short radiative cooling times of yr on average. Simple cooling-flow models, which include heating from stellar winds and Type Ia supernovae, vastly overpredict the amount of cooled gas observed in the central regions of these galaxies (see, e.g., 8 of Mathews & Brighenti 2003); this suggests some additional form of heating must be present. Attempts to mitigate this problem by including additional heating components in these models, such as transient heating from active galactic nuclei (AGNs), have been unsuccessful in reproducing the observed properties of the gas (e.g., the radial profiles of electron temperature, density, and metallicity; see, e.g., Brighenti & Mathews 2003). Despite these modelling difficulties, both observational and theoretical studies have suggested that energy feedback from transient AGNs must be important (e.g., Binney & Tabor 1995; Ciotti & Ostriker 1997, 2001; Bîrzan et al. 2004; Best et al. 2005, 2006; Churazov et al. 2005; Di Matteo et al. 2005; Scannapieco et al. 2005; Bower et al. 2006; Brighenti & Mathews 2006; Croton et al. 2006; Hopkins et al. 2006; McNamara et al. 2006); these studies maintain that AGN feedback plays a crucial role in regulating the growth of early-type galaxies and their central supermassive black holes. Observations of giant elliptical galaxies in the local universe have revealed significant X-ray cavities filled with radio lobes that are inferred to have been driven by nuclear AGN outbursts (e.g., Churazov et al. 2001, 2002; Jones et al. 2002, 2005; Forman et al. 2005; Nulsen et al. 2005a, 2005b; Allen et al. 2006); these observations suggest significant energy transfer and recurrence timescales much shorter than the average cooling time. One of the goals of this paper is to characterize the evolution of the hot X-ray-emitting gas in normal early-type galaxies and to place constraints on the role of feedback by transient AGNs.
LMXBs provide another important contribution to the X-ray emission from early-type galaxies (both optically luminous and faint), and many investigations have been dedicated to understanding their nature. Observations in the optical band, most notably from the Hubble Space Telescope (HST), have shown that many of the LMXBs in early-type galaxies are coincident with globular clusters (e.g., Sarazin et al. 2003), and the number of LMXBs observed in a given galaxy appears to be linearly correlated with the globular-cluster specific frequency, (i.e., the number of globular clusters per unit optical luminosity; e.g., White et al. 2002; Kim & Fabbiano 2004; Irwin 2005; Juett 2005). White et al. (2002) examined several optically luminous, LMXB-dominated early-type galaxies with stellar populations having ages ranging from 5–13 Gyr (as measured via spectroscopy), and found that their X-ray–to–optical luminosity ratios ([LMXB]) have no dependence on galaxy age; (LMXB) was observed to be linearly proportional to . Again using optically luminous early-type galaxies, Irwin (2005) found that details of the (LMXB)– relation imply that a significant number of LMXBs were formed in the fields of the early-type galaxies and that the field LMXB contribution to (LMXB) is most significant, and even dominates over the globular cluster LMXB emission, for galaxies with smaller values of . In the optically luminous galaxies studied by White et al. (2002) and Irwin (2005) is large, and LMXBs are mainly formed in the high-density central regions of globular clusters through tidal interactions between normal stars and either neutron stars or black holes. In optically faint low-mass systems, however, is typically small (e.g., Ashman & Zepf 1998), and it is therefore likely that LMXBs that formed within the galactic fields of these systems dominate (LMXB) (see, e.g., Fig. 3 of Irwin 2005); these LMXBs are thought to have formed via the evolution of primordial binaries on timescales of 1–10 Gyr following a star-formation event (e.g., Verbunt & van den Heuvel 1995). Furthermore, if the downsizing mass-assembly scenario discussed above is correct, field LMXBs within optically faint galaxies could evolve significantly over cosmic time, as LMXB populations emerge in the wake of relatively recent bursts of star formation and eventually fade after 1 Gyr (e.g., Ghosh & White 2001). Therefore, another goal of this paper is to measure the X-ray properties of normal optically faint early-type galaxies over a significant range of redshift to place constraints on the evolution of the LMXB activity in these systems.
1.3 Observations of the X-ray Emission from Distant Early-Type Galaxies
At present, there have been few investigations of the redshift evolution of the X-ray properties of isolated early-type galaxies, which contrasts with the case for late-type galaxies (e.g., Hornschemeier et al. 2002; Norman et al. 2004; Laird et al. 2005; Kim et al. 2006; Lehmer et al. 2006). Brand et al. (2005) used X-ray stacking analyses (see also, e.g., Brandt et al. 2001; Nandra et al. 2002; Lehmer et al. 2005a) to investigate the evolution of optically luminous red galaxies within the Boötes field of the NOAO Deep Wide-Field Survey (NDWFS) over the redshift range 0.3–0.9. The Chandra observations used in these analyses were 5 ks in duration (e.g., Murray et al. 2005) and covered an area of 1.4 deg2. Brand et al. (2005) found that the average X-ray luminosities of these galaxies mildly increase with redshift, which is primarily due to a rise in AGN activity with redshift. Due to its relatively large sample size (3316 red galaxies), the Brand et al. (2005) investigation provided useful statistical constraints on the X-ray activity from distant powerful AGNs; however, the X-ray sensitivity of this study was too low (i.e., the luminosity detection limit was ergs s-1 at ) to distinguish effectively galactic X-ray emission (i.e., hot interstellar gas and LMXBs) from that of luminous AGNs. Deep X-ray surveys, which utilize long X-ray exposures with Chandra or XMM-Newton (see, e.g., Brandt & Hasinger 2005 for a review), are required to investigate the X-ray emission from distant “normal” (i.e., not predominantly powered by luminous AGNs) early-type galaxies. An ideally suited field for such an investigation is the Extended Chandra Deep Field-South (E-CDF-S). The E-CDF-S is a 0.3 deg2, multiwavelength survey field composed of the central 1 Ms Chandra Deep Field-South (CDF-S; Giacconi et al. 2002; Alexander et al. 2003) and four flanking, contiguous 250 ks Chandra observations (Lehmer et al. 2005b). The 0.5–2.0 keV sensitivity limits (for detecting an individual unresolved X-ray point source) over the E-CDF-S are ergs cm-2 s-1 in the most sensitive regions and ergs cm-2 s-1 over the majority of the field; these levels correspond to 0.5–2.0 keV luminosity detection limits of and ergs s-1, respectively, at . Such sensitivity limits are sufficient to detect moderately-powerful AGNs and normal, X-ray luminous early-type galaxies (e.g., NGC 1600; Sivakoff et al. 2004) out to .
Recently, McIntosh et al. (2005; hereafter, M05) isolated a sample of 728 optically selected early-type galaxies within the E-CDF-S from the GEMS (Galaxy Evolution from Morphologies and SEDs; Rix et al. 2004) and COMBO-17 (Classifying Objects by Medium-Band Observations in 17 Filters; Wolf et al. 2004) surveys, which overlap with 0.23 deg2 (77%) of the E-CDF-S. The M05 sample spans a redshift range of 0.2–1.0, and due to its depth and relatively large comoving volume, it is ideal for investigating the evolution of early-type galaxies over the last half of cosmic history. In this paper, we utilize the M05 sample and a supplementary sample of 64 additional 0.1–0.2 early-type galaxies located within the E-CDF-S (selected using the same techniques discussed in M05) to characterize the redshift evolution of the X-ray properties of early-type galaxies. Our aim is to measure the average X-ray emission, via stacking techniques (applied to X-ray detected and X-ray undetected sources), from distant normal early-type galaxy populations. We investigate separately the cosmic-time evolution of (1) the hot interstellar gas content through optically luminous galaxy samples and (2) the LMXB populations through optically faint galaxy samples.
The Galactic column density is 8.8 1019 cm-2 for the E-CDF-S (Stark et al. 1992). All of the X-ray fluxes and luminosities quoted throughout this paper have been corrected for Galactic absorption. Unless stated otherwise, we make reference to optical magnitudes using the Vega magnitude system. = 70 km s-1 Mpc-1, = 0.3, and = 0.7 are adopted throughout this paper (e.g., Spergel et al. 2003), which imply a look-back time of 6.3 Gyr at .
2 Data Analysis
2.1 Sample Selection
We started with the M05 sample of 728, 0.2–1.0 early-type galaxies and a supplementary sample of 64 0.1–0.2 galaxies within the E-CDF-S field (i.e., 792 total galaxies), which were selected following the same methods outlined in M05 using the same data. The total sample was selected using (1) rest-frame red-sequence colors derived from COMBO-17 and (2) quantitative optical morphologies (via the Sérsic indices; ) as observed from HST imaging through GEMS (see 2.3 of M05 for details). The sample generated using these criteria is representative of the early-type galaxy population as a whole and is highly complete down to the selection limit of . Photometric redshifts for these early-type galaxies were provided by COMBO-17 and are used throughout this paper. Using secure redshifts from various spectroscopic surveys in the E-CDF-S region (e.g., Le Fevre et al. 2004; Szokoly et al. 2004; Mignoli et al. 2005; Vanzella et al. 2005, 2006; Silverman et al. 2006), which were available for 20% of the M05 sample, we confirmed that the photometric redshifts for our sample are highly accurate (i.e., 50% of the galaxies have and 75% have ). The selection of early-type galaxies via these quantitative methods isolates galaxies with visual morphologies ranging from E–Sa galaxies, and a large majority of these are E/S0 galaxies (Bell et al. 2004b). We note that the X-ray properties of E and S0 galaxies are observed to be similar (e.g., Forman et al. 1985; Blanton et al. 2001; Xu et al. 2005).
Our primary goal was to investigate the redshift evolution of the X-ray properties of normal early-type galaxies. To achieve this better, we filtered our original sample to include 539 galaxies within the redshift range 0.1–0.7. This range was chosen to optimize our use of the E-CDF-S X-ray sensitivity to allow for the detection and identification of low-luminosity AGNs over a broad range of cosmic look-back times ( Gyr). As discussed in 1.3, the Chandra observations of the E-CDF-S are sufficiently sensitive to detect AGNs with 0.5–2.0 keV luminosities ergs s-1 over this entire redshift range (). Furthermore, given that the X-ray luminosities of AGN-hosting optically luminous () early-type galaxies in the local universe span ergs s-1 (mean ergs s-1; O’Sullivan et al. 2001), this limit should adequately prevent powerful AGNs from dominating stacked photon counts (assuming the AGN activity is not widespread).
2.1.1 Removing AGN Contamination
We utilized multiwavelength observations of the E-CDF-S region to obtain a census of the X-ray-detected AGNs and normal galaxies within our sample. We matched galaxies in our sample to X-ray sources in the catalogs presented in Alexander et al. (2003)111See http://www.astro.psu.edu/users/niel/hdf/hdf-chandra.html for the relevant source catalogs and data products for the 1 Ms CDF-S. for the 1 Ms CDF-S observations and Lehmer et al. (2005b)222See http://www.astro.psu.edu/users/niel/ecdfs/ecdfs-chandra.html for the relevant source catalogs and data products for the 250 ks E-CDF-S. for the 250 ks E-CDF-S observations. For a successful match, we required that the optical and X-ray centroids be displaced from each other by less than 1.5 the radius of the Chandra positional error circles (80–90% confidence), which are given in each respective X-ray catalog. We note that investigations of luminous off-nuclear X-ray sources, which may lie outside our matching radius, have shown that there is a dearth of such sources within early-type galaxies (e.g., Irwin et al. 2004; Lehmer et al. 2006). The Chandra source catalogs were generated using wavdetect (Freeman et al. 2002) at false-positive probability thresholds of and for the 1 Ms CDF-S and the 250 ks E-CDF-S, respectively. However, as demonstrated in 3.4.2 of Alexander et al. (2003) and 3.3.2 of Lehmer et al. (2005b), legitimate lower significance X-ray sources, detected by running wavdetect at a false-positive probability threshold of , can be isolated by matching with relatively bright optical sources. Since the sky surface density of , early-type galaxies is relatively low (0.65 galaxies arcmin-2), we can effectively use this technique to isolate X-ray sources within our sample. We estimate that when using wavdetect at a false-positive probability threshold of , we expect 0.5 spurious sources. In total, we detected 49 early-type galaxies in at least one of the 0.5–2.0 keV, 2–8 keV, or 0.5–8.0 keV bandpasses.
We used the following criteria to identify candidate AGNs within our sample:
-
1.
Hard X-ray Emission: Our best discriminator of obscured ( cm-2) AGN activity is the presence of a hard X-ray spectrum, which is characterized by a relatively shallow effective X-ray spectral slope (i.e., ). We classified X-ray sources that were detected only in the 2–8 keV bandpass as potential AGN candidates. For sources detected in both the 0.5–2.0 keV and 2–8 keV bandpasses, we required that the hardness ratio measured using these bandpasses, (where is the observed count-rate in each respective bandpass), be greater than 0.5 (corresponding to an effective photon index of ); these sources would have spectral slopes shallower than those expected for a pure LMXB population (e.g., Church & Balucińska-Church 2001; Irwin et al. 2003). We found that all sources with 2–8 keV detections were classified as AGN candidates. Furthermore, there were a few sources that were detected in only the 0.5–8.0 keV bandpass. We argue that since these sources were not detected in the 0.5–2.0 keV bandpass, our most sensitive bandpass, then there must be a significant contribution from the 2–8 keV bandpass such that . These sources were flagged as AGN candidates and removed from our stacking analyses. Using criterion 1, we identified a total of 29 AGN candidates.
-
2.
X-ray–to–Optical Flux Ratio: Spectral hardness is a good indicator of obscured AGN activity; however, powerful unobscured AGNs with steep spectral slopes () could still be missed if this were our only means for identifying candidate AGNs. Another useful discriminator of AGN activity, which aids in the identification of luminous unobscured AGN candidates, is the 0.5–8.0 keV X-ray–to–optical flux ratio, (e.g., Maccacaro et al. 1988; Hornschemeier et al. 2000; Bauer et al. 2004). We use the criterion (see 4.1.1 of Bauer et al. 2004 for justification) to identify unobscured AGN candidates in our sample; two candidates, which were not identified by criterion 1 above, were found using this criterion. We note that 16 out of the 29 AGNs that satisfied criterion 1 (55%) also satisfied criterion 2.
-
3.
Radio–to–Optical Flux Ratio: We used radio maps (1.4 GHz; limiting 1 depth of 14Jy) from the Australia Telescope Compact Array (ATCA; PI: A. Koekemoer; Afonso et al. 2006), which cover the entire E-CDF-S region, to identify additional potential AGNs. We matched the positions of radio-detected sources to those of our early-type galaxies using a 20 matching radius and found 18 matches. Of the 18 radio-detected sources in our sample, we find that three are detected in the X-ray bandpass. Of the three X-ray-detected sources, only CXOECDFS J033228.81–274355.6 was not previously identified as an AGN candidate using criteria 1 and 2; however, visual inspection of the radio source coincident with CXOECDFS J033228.81–274355.6 reveals that it has a clear FR II radio morphology. We find that the three AGN-like X-ray-detected radio sources have relatively large radio–to–optical flux ratios, Å, as expected for AGNs (e.g., Kinney et al. 1996). Out of the remaining 15 radio-detected matches, 13 sources that were not detected in the X-ray bandpass were found to have uncharacteristically high radio–to–optical flux ratios for early-type galaxies, Å. These 13 sources were classified as potential AGNs and were excluded from our stacking analyses described below. We note that in addition to AGNs, star-forming galaxies (e.g., edge-on dusty galaxies) that were misclassified as early-type galaxies may also satisfy this criterion (see, e.g., Fig. 8 of Barger et al. 2006); therefore, this crierion also helps to guard against the inclusion of such sources.
To summarize, we have detected 49 early-type galaxies in the X-ray band and have identified 32 X-ray-detected AGN candidates: 29 from criterion 1, two additional sources from criterion 2, and one additional source from criterion 3. Finally, using criterion 3 we identified an additional 13 AGN candidates that were not detected in the X-ray band. Therefore, we identified a total of 45 AGN candidates from our sample of 539 early-type galaxies. The remaining 17 X-ray-detected sources that we do not classify as AGN candidates are considered to be normal early-type galaxies. These normal galaxies are included in our stacking analyses, and as we discuss in 2.2 below, including these galaxies does not significantly affect our results. A more detailed discussion of the X-ray properties of our X-ray-detected sources is presented in 3.1 below. We note that the three criteria discussed above may not be completely sufficient to classify all X-ray-detected sources that are truly AGNs as AGN candidates (see, e.g., Peterson et al. 2006). Such a misclassification is possible for low-luminosity AGNs that are only detected in the more sensitive 0.5–2.0 keV bandpass, which have 2–8 keV emission too weak for an accurate classification. Furthermore, we also expect there to be AGNs that lie below the X-ray detection threshold that are not identified here. However, in 3.2.2, we use the 2–8 keV AGN fraction as a function of X-ray luminosity to argue quantitatively that we do not expect misclassified AGNs (detected only in the 0.5–2.0 keV bandpass) and low-luminosity AGNs below the X-ray detection limit to have a serious impact on our results.
2.1.2 Normal Early-Type Galaxy Samples
A large majority of the normal galaxies in our sample were not detected individually in the deep Chandra observations over the E-CDF-S. We therefore implemented stacking analyses (see 2.2 for a description) of galaxy samples, which were constructed to cover two optical luminosity ranges in multiple redshift bins. We first divided the original sample of 539 early-type galaxies by luminosity into optically luminous ( ) and optically faint ( ) samples. The two luminosity ranges were motivated by the observed physical differences between local early-type galaxies within these two luminosity ranges (see discussion in 1.1) and optical completeness limitations of the M05 sample (i.e., the completeness limit). As mentioned in 1.1 and displayed in Figure 1, the optically luminous galaxies have soft X-ray spectra dominated by hot interstellar gas, while the optically faint early-type galaxies have X-ray spectra powered mainly by LMXBs with a small contribution from hot interstellar gas. Galaxies from both luminosity classes have hard X-ray emission dominated by LMXBs.
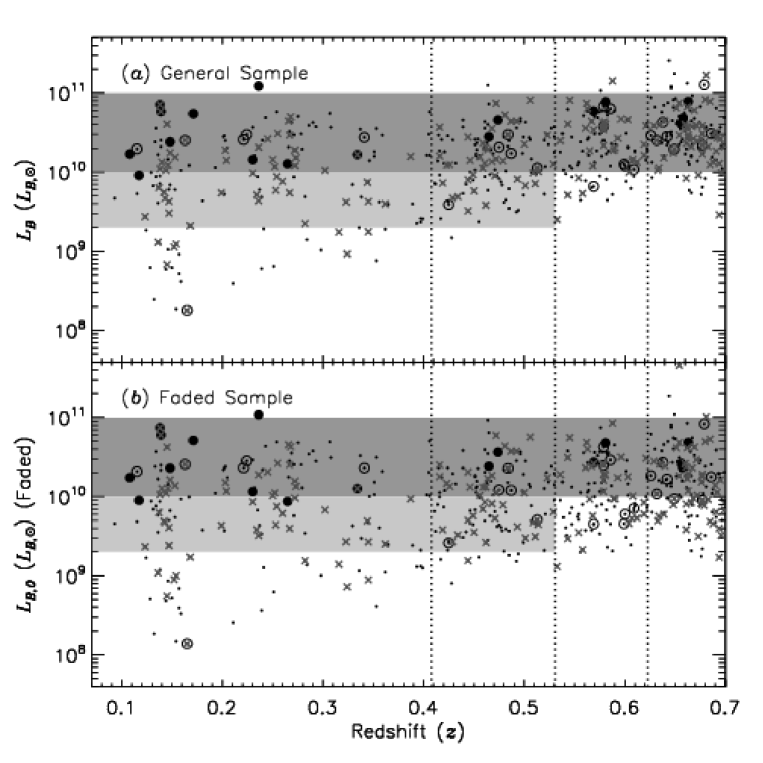
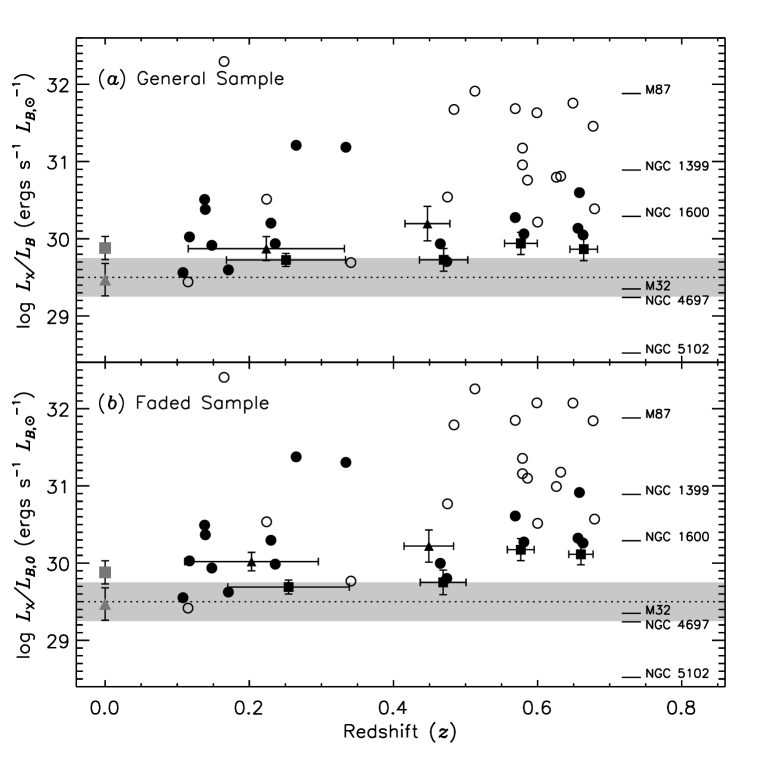
We divided the optically luminous sample into four redshift bins of equal comoving volume ( 0.10–0.41, 0.41–0.53, 0.53–0.62, and 0.62–0.70), and due to optical completeness limitations, we divided our optically faint sample into two redshift bins ( 0.10–0.41 and 0.41–0.53). Although the E-CDF-S subtends a relatively small solid angle, we note that each redshift bin has a radial depth that exceeds 500 Mpc, which is a factor of 5 times larger than the extent of the largest structures in the Universe (e.g., Springel et al. 2006). We created histograms of the galaxy luminosity-distance distributions on scales of 100 Mpc and did not observe any dominating density “spikes.” This suggests that our samples are not being significantly affected by cosmic variance. Furthermore, provided the physical properties of field early-type galaxies are not strongly affected by their environments in a systematic way, we suggest that cosmic variance should not affect our results even if present. In Figure 2a, we show rest-frame -band luminosity, (in solar units; ergs s-1), versus redshift for the 539 galaxies (dots and crosses) that make up our “general sample”; we indicate the divisions of the sample by optical luminosity (shaded regions) and redshift (vertical dotted lines). Sources highlighted by large circles (both open and filled) are those that are individually detected in X-rays; the open circles indicate X-ray-detected AGN candidates, and the filled circles indicate the remaining detected sources, which are classified as normal early-type galaxies.
In addition to the general sample, we have created “faded samples” of early-type galaxies. The faded samples were constructed using the general sample discussed above; however, we have corrected the rest-frame -band luminosities for passive evolution. These corrections take into account the fact that the optical power output of early-type galaxies has been fading with cosmic time due to stellar evolution (see 1). For each galaxy, we have computed an evolved, -band luminosity () following the best-fit optical-size-dependent solutions for optical fading presented in Tables 1 and 2 of M05. M05 present eight best-fit relations for (i.e., the difference between the absolute -band magnitude at redshifts and ) versus , which differ in their evolutionary scenarios (based upon formation scenarios and the PEGASE models of Fioc & Rocca-Volmerange 1997) and whether or not the fit is constrained to . Throughout this paper we quote results based upon the best-fit solution that assumes and a single-burst evolutionary model with a formation redshift of and a metallicity of [Fe/H] = 0.2 (see 3.2 of M05 for details). We converted the -band relation to the -band following . Additional X-ray analyses, using the seven alternative evolutionary scenarios presented in M05, were also performed, but no material differences were observed in our results. Figure 2b shows versus for our faded sample; symbols, lines, and shaded regions have the same meaning as in Figure 2a. In generating samples for stacking, we made the same sample divisions (of both luminosity and redshift) as we did for the general sample, except we used to discriminate between optically luminous and faint galaxies. This approach allows us to place constraints on the evolution of the X-ray activity from distant galaxies selected from the optical band as they would appear today. Furthermore, based on local estimates of stellar mass–to–light ratios, we can use to estimate the stellar masses of these systems. Using a Chabrier initial mass function (Chabrier 2003), we estimate that the luminosity ranges and correspond roughly to stellar-mass ranges of and , respectively. In the presentation below, we focus our attention on results drawn from the faded samples since these are expected to be the most physically meaningful.
2.2 X-ray Stacking Technique
In order to address the fact that the X-ray emission from early-type galaxies is dominated by different physical processes in different energy bands, we performed stacking analyses in three bandpasses: 0.5–1.0 keV (SB1),333The 0.5–1.0 keV bandpass was originally defined as SB1 in 3.1 of Alexander et al. (2003). 0.5–2.0 keV (soft band; SB), and 2–8 keV (hard band; HB). The shaded bars in the panels of Figure 1 show the spectral coverage of these bandpasses at the median redshifts of our optically luminous () and faint () samples for the X-ray spectral energy distributions (SEDs) of NGC 1600 (top panel) and NGC 4697 (bottom panel), respectively. For optically luminous galaxies, the SB1 and SB will effectively sample X-ray emission dominated by hot interstellar gas, which produces 80% and 70% of the total emission in each respective bandpass. In contrast, 90% of the HB flux originates from LMXB emission. For optically faint galaxies, SB and HB will effectively sample the X-ray emission from LMXBs; however, the X-ray emission observed in SB1 has roughly equal contributions from hot gas and LMXB emission. In our analyses, we used data products from Alexander et al. (2003) for the 1 Ms CDF-S and Lehmer et al. (2005b) for the 250 ks E-CDF-S (see footnotes 1 and 2). The data products are publicly available for all energy bands except for SB1 in the 250 ks E-CDF-S regions, which were generated specifically for the analyses here using the same methods described in Lehmer et al. (2005b). The methodology of our stacking procedure was similar to that outlined in Lehmer et al. (2005a); for completeness, we describe this procedure below.
We maximized our stacked signal by optimizing our choices of circular stacking aperture radius (from which we extract photon counts for both sources and their backgrounds) and inclusion radius (i.e., the maximum off-axis angle within which we include sources for stacking). This process is needed because the Chandra point spread function (PSF) increases in size with off-axis angle, which degrades the sensitivity for those sources that are far off-axis. For the optimization process, we stacked all early-type galaxies in our sample that were not detected individually in the X-ray band. In order to obtain a clean X-ray signal, we excluded galaxies that were located 10′′ from unrelated sources in the X-ray source catalogs and within the extent of extended X-ray sources, which are likely associated with galaxy groups or poor clusters (see 3.4 of Giacconi et al. 2002 and 6 of Lehmer et al. 2005b). Sources that lie within both the 1 Ms CDF-S and 250 ks E-CDF-S were stacked using both observations, as long as the off-axis angle for each observation was within our chosen inclusion radius.
Our optimization procedure was a two-step iterative process that was performed using the SB, the bandpass in which our signal was maximized. In the first step of the optimization process (step one) we held the inclusion radius () fixed and stacked sources using a variety of circular stacking apertures of constant radii (i.e., we did not vary the aperture radius as a function of off-axis angle). We used 15 different circular stacking apertures with radii in the range of 05–30 to obtain a relation for how the signal-to-noise ratio (S/N) varied as a function of aperture size. For a given aperture, we stacked the photon counts and effective exposure times from each galaxy position and summed them to obtain total source-plus-background counts, , and a total exposure time, , respectively. We estimated total background counts, , using Monte Carlo simulations and the background maps described in 4.2 of Alexander et al. (2003) for the 1 Ms CDF-S and 4 of Lehmer et al. (2005b) for the 250 ks E-CDF-S. We shifted our aperture from each galaxy position randomly within a circular region of radiud 25′′, extracted background counts from each relevant background map, and summed the counts to obtain an estimate of the total background counts. This procedure was repeated 10,000 times to obtain an estimate of the local background and its dispersion. Our best estimate of the total background counts, , was approximated by taking the mean background calculated from the 10,000 Monte Carlo trials. For each of the 15 circular apertures, we computed the relevant signal-to-noise ratio (S/N) using the equation, S/N . After performing the stacking procedure for all 15 different apertures, we identified the aperture radius that produced the maximal S/N. In the second step of the optimization process (step two), we held the optimized aperture determined from step one fixed, but this time we stacked sources using 15 different inclusion radii ranging from 15–110 to obtain S/N as a function of inclusion radius. After performing the stacking procedure for all 15 different inclusion radii, we identified the optimal inclusion radius. For a clean stacking signal, we expect that S/N will be proportional to the inclusion radius (i.e., S/N ), and therefore we chose the optimal inclusion radius based on where the S/N– relation appears to deviate significantly from linear. This method helps to guard against the inclusion of contaminating AGNs in the low-sensitivity regions at large off-axis angles. Using the optimal inclusion radius determined with this method, we repeated step one. This two-step process was run iteratively until a converged solution was obtained. We found that a stacking aperture of 15 and an inclusion radius of 70 produced the optimal signal; we note that this choice of optimized is somewhat smaller than that determined in Lehmer et al. (2005a) due to differing X-ray exposures and the more conservative approach that we have adopted for choosing the optimal . Hereafter, we utilize these values for stacking aperture and inclusion radius in our analyses. In Figure 3, we show S/N as a function of inclusion radius (Fig. 3a) and aperture size (Fig. 3b), which were obtained by holding the aperture radius constant at 15 and the inclusion radius constant at 70, respectively.
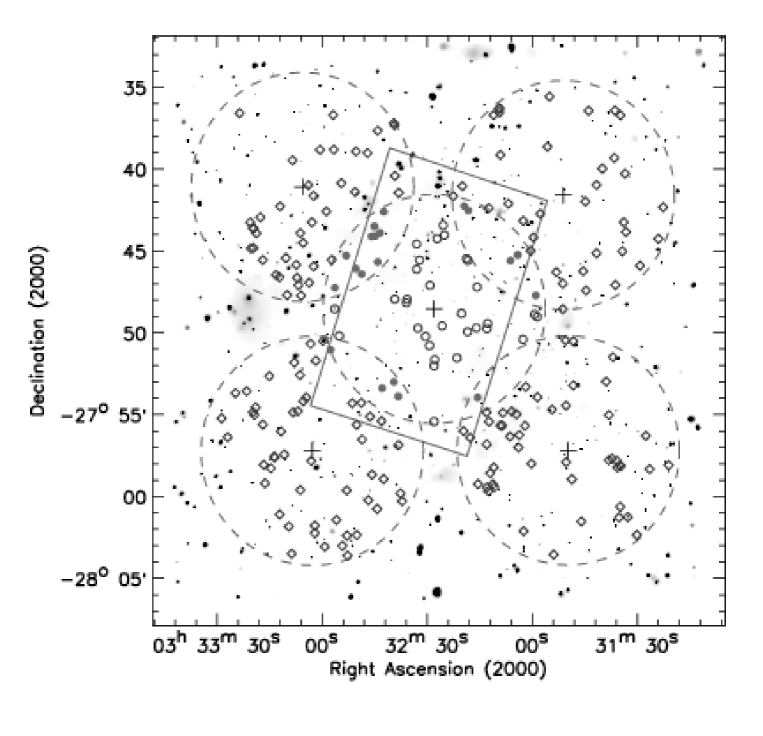
After excluding sources that were (1) classified as AGN candidates (via the three criteria outlined in 2.1.1), (2) located at off-axis angles greater than 70, (3) within regions of extended X-ray emission, and (4) within 10′′ of an unrelated X-ray-detected sources, we were left with general and faded samples of 276 and 229 galaxies, respectively; in both samples, 13 galaxies were X-ray-detected sources. Using these samples, we stacked the X-ray properties following the procedure described above. The sizes of the general and faded samples differ most notably because of the fading of high-redshift optically luminous galaxies out of the selected luminosity range. We stacked samples both with and without X-ray-detected normal galaxies included, and no material differences were observed in our results; therefore, X-ray-detected sources that were classified as normal galaxies were included in our stacking analyses. Figure 4 shows the spatial distribution of the 229 stacked sources in our faded sample over the E-CDF-S region. Sources stacked using the 1 Ms and 250 ks observations are shown as circles and diamonds, respectively; the sources indicated with filled circles were stacked using both observations. For each stacked sample, we required the S/N be greater than or equal to 3 (i.e., 99.9% confidence) for a detection. For stacked samples without significant detections, 3 upper-limits were placed on the source counts.
Using net counts (i.e., ) from our stacked samples and adopted X-ray SEDs (see below), we calculated absorption-corrected fluxes and rest-frame luminosities. Due to the fact that our 15 radius stacking aperture encircles only a fraction of the PSF444For SB and SB1, the encircled-energy fraction of a 15 radius circular aperture varies from 100% at off-axis angle to 45% at . For the HB, this fraction varies from 80% at to 40% at . for sources at relatively large off-axis angle, we calculated aperture corrections for each stacked source .
Since we are calculating average X-ray counts from the summed emission of many sources of differing backgrounds and exposure times, we used a single, representative exposure-time-weighted aperture correction, . This factor, which was determined for each stacked sample, was calculated following:
| (1) |
where is the effective exposure time for each stacked source. The average aperture corrections () for our samples were 1.5 and 1.8 for the 0.5–2.0 keV and 2–8 keV bands, respectively. We note that at the mean redshifts of our samples, the 15 radius aperture corresponds to projected physical radii in the range of 5.8–10.5 kpc. For early-type galaxies in the local universe, extended X-ray emission originating outside of these radii varies considerably among galaxies and generally represents only a small fraction (1–10%) of the total flux (e.g., Fukazawa et al. 2006). Therefore, we do not make additional aperture corrections to account for extended X-ray emission. We estimated mean observed count rates () using the following equation:
| (2) |
where , , and are defined above. To convert count rate to flux, we used the Galactic column density given in 1.3 and the best-fit X-ray spectral energy distribution (SED) for NGC 1600 for the optically luminous galaxies (see Fig. 1a) and a power-law SED with for the optically faint galaxies (see 1.1 for justification). We note that for a range of reasonable SED choices, we find systematic fractional uncertainties in the count-rate to flux conversion of 10% for SB and HB and 50% for SB1. Mean rest-frame X-ray luminosities were calculated following:
| (3) |
where is the luminosity distance, is the mean observed-frame X-ray flux, and is a unitless conversion factor, which relates the observed-frame X-ray flux to the rest-frame luminosity using our adopted SEDs. The fractional errors on due to uncertainties in range from 10% to 1% for our optically luminous 0.10–0.41 and 0.62–0.70 samples, respectively. Due to the relatively broad energy ranges our bandpasses encompass and the relatively small spectral shifts observed over the redshifts of sources in our samples, we used observed-frame fluxes to compute rest-frame luminosities. For our adopted SEDs, we found that values of varied between 0.8 and 1.1, depending on the bandpass and redshift of the source. For all bandpasses, SED choice contributes small systematic uncertainties in , which range from 10–20% depending on redshift. We note that the mean X-ray luminosity is expected to be closely representative of a typical galaxy within the confined optical luminosity ranges used here. Moreover, using the O’Sullivan et al. (2001) sample of local early-type galaxies, we find that and 1.2 for optically luminous and faint samples respectively. Since we are only able to calculate mean quantities via the X-ray stacking used here, we utilize mean quantities throughout. Results from our stacking analyses are presented below in 3.2.
3 Results
3.1 Individually Detected X-ray Sources
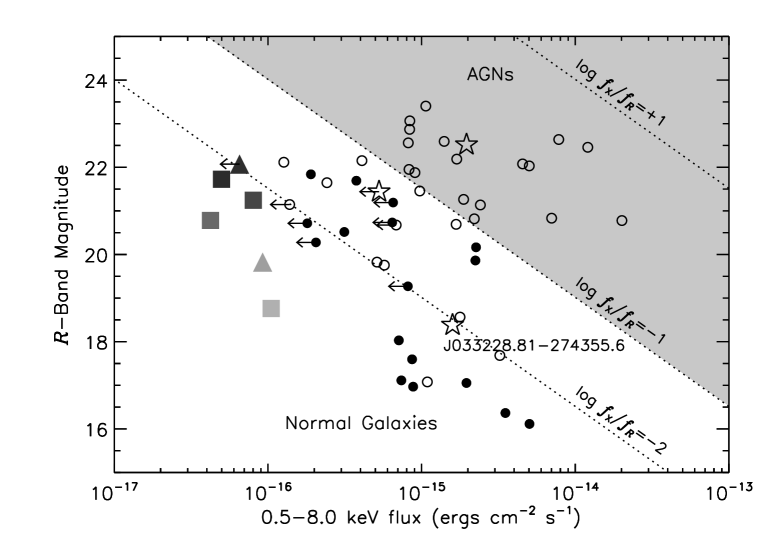
In Table 1, we present the properties of the X-ray-detected early-type galaxies. X-ray source properties were determined following the methods outlined in Alexander et al. (2003) and Lehmer et al. (2005b) for the CDF-S and E-CDF-S, respectively. Using the matching criterion discussed in 2.1.1, we matched 39 of our early-type galaxies to sources that were included in the main Chandra catalogs of either Alexander et al. (2003) or Lehmer et al. (2005b), and an additional ten matches were identified using X-ray sources detected using wavdetect at a false-positive probability threshold of (i.e., 49 total detected sources). Figure 5 shows the -band magnitude (from COMBO-17) versus 0.5–8.0 keV flux for all 49 X-ray detected early-type galaxies in our sample; normal galaxies and AGN candidates are indicated as filled and open circles, respectively. As discussed in 2.1.1, we classified 32 (65%) X-ray-detected sources as AGN candidates. We note that the majority of the AGN candidates have ; however, a few of these candidates have , including the FR II source CXOECDFS J033228.81–274355.6. AGNs with are either significantly obscured or relatively X-ray-weak AGNs.
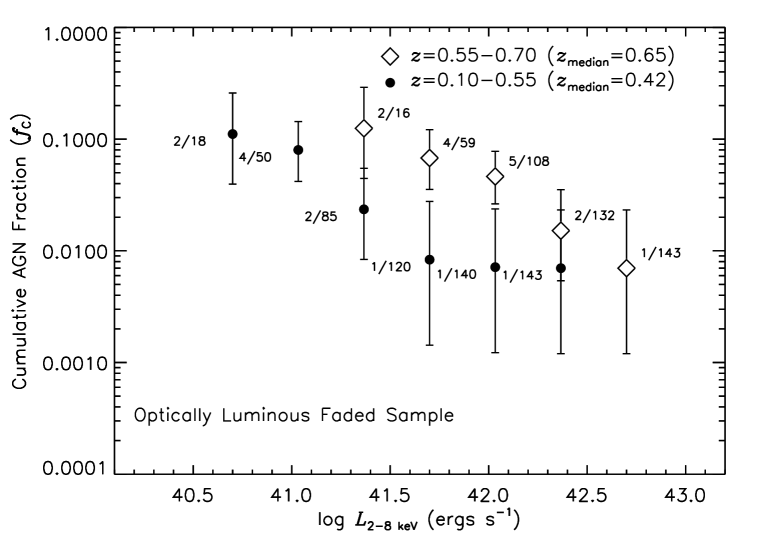
As discussed in 1.2, transient AGN feedback may play an important role in heating the hot gas in normal early-type galaxies. In order to understand and constrain the influence of transient AGN activity within early-type galaxies, we computed the X-ray-luminosity-dependent cumulative AGN fraction, (i.e., the fraction of early-type galaxies harboring an AGN with a 2–8 keV luminosity of or greater). We made use of the 2–8 keV bandpass because of its ability to probe relatively unattenuated X-ray emission in a regime of the X-ray spectrum where we expect there to be minimal emission from normal galaxies (see also 2.1.1 for more details). Figure 2 illustrates that the majority of the AGNs in our samples (open circles) originate within optically luminous ( ) early-type galaxies, and therefore when computing , we used only optically luminous galaxies; we note that the number of AGNs within our optically faint samples is too low to obtain a respectable constraint on . In order to quantify the redshift evolution of , we split our optically luminous samples into two redshift intervals of roughly equal size ( 0.10–0.55 [] and 0.55–0.70 []). Only two redshift intervals were chosen due to statistical limitations on the number of detected AGNs. We computed by taking the number of candidate AGNs with a 2–8 keV luminosity of or greater and dividing it by the number of early-type galaxies in which we could have detected an AGN with luminosity . The latter number was computed by considering the redshift of each galaxy and its corresponding sensitivity limit, as obtained from spatially dependent sensitivity maps (see 4.2 of Alexander et al. 2003 and 4 of Lehmer et al. 2005b); these sensitivity maps were calibrated empirically using sources detected by wavdetect at a false-positive probability threshold of . Figure 6 shows as a function of for the two redshift bins considered here. We find suggestive evidence for evolution in between 0.42 and 0.65, which is consistent with the global trend observed for luminous AGNs in general (e.g., Brandt & Hasinger 2005). At ergs s-1, where is most tightly constrained, we find that . We note that although this value is poorly constrained, it is consistent with the evolution observed for X-ray luminosity functions of X-ray-selected AGNs (e.g., Ueda et al. 2003; Barger et al. 2005; Hasinger et al. 2005), and is in agreement with the stacked constraints on optically-selected early-type galaxies set by Brand et al. (2005). We return to the discussion of X-ray-detected AGNs in 3.2.2 when discussing the undetected AGN contribution to our stacked samples and in 4.1 when discussing the transient AGN contribution to heating the hot interstellar gas in optically luminous early-type galaxies.
3.2 X-ray Stacking Results
3.2.1 Stacked Properties
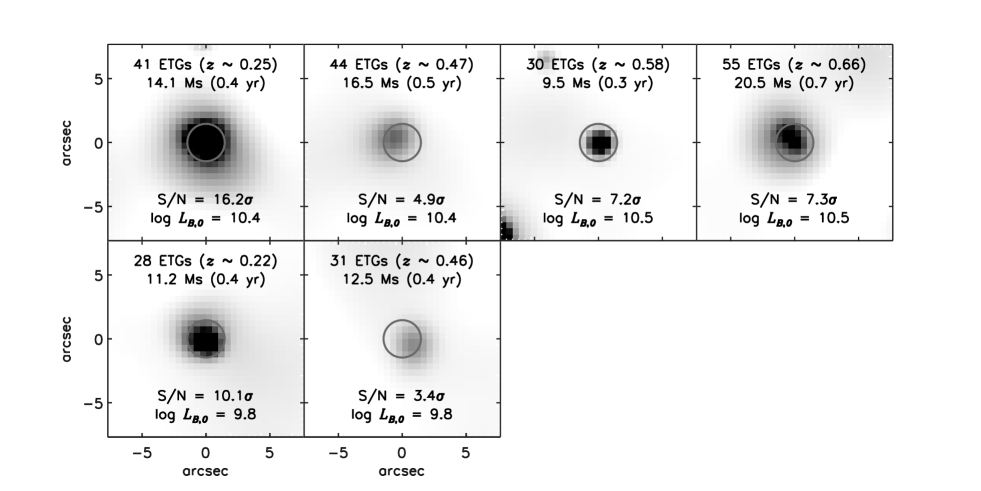
In Tables 2 and 3, we summarize the average properties of our stacked samples of normal early-type galaxies. For illustrative purposes, we created Figure 7, which shows 0.5–2.0 keV (SB) adaptively-smoothed stacked images of our faded samples. We detect the average X-ray emission from all of our samples in SB, several in SB1, and only two in HB. The two samples from which we detect HB emission (the optically luminous general sample and the optically luminous faded sample) have HB–to–SB1 and HB–to–SB count-rate ratios (i.e., and ) that are broadly consistent with our adopted X-ray SED. Furthermore, all of our stacked samples have mean X-ray–to–optical flux ratios () that are consistent with those expected for normal galaxies (see col.[5] of Table 3 and Fig. 5). In Figure 5, we have plotted mean quantities from our samples as large filled squares and triangles, which represent our optically luminous and faint faded samples, respectively; these symbols have been shaded with varying grayscale levels to indicate redshift, such that darker shading represents higher redshift samples.
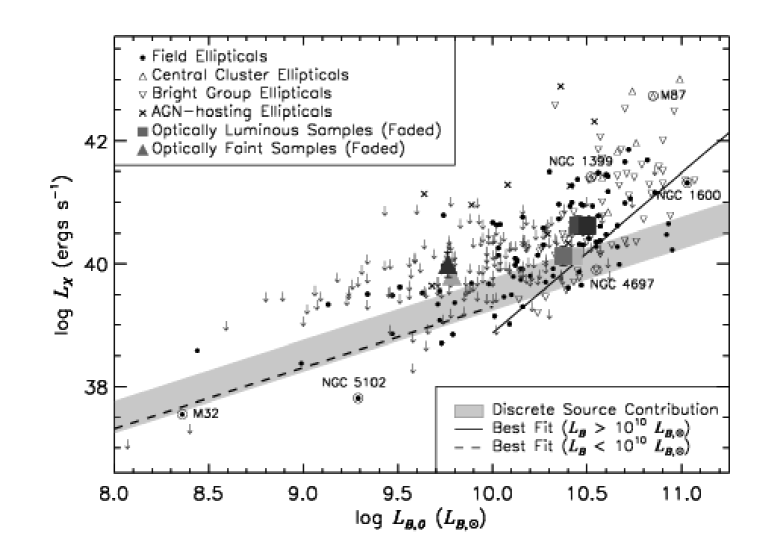
For the purpose of comparing our results with local early-type galaxies, we utilize the O’Sullivan et al. (2001; hereafter OS01) sample. The OS01 sample was selected from the Lyon-Meudon Extragalactic Data Archive (LEDA) using morphological type (; E–S0 Hubble types), distance ( km s-1), and apparent magnitude (). The LEDA catalog is known to be 90% complete down to . X-ray observations of these galaxies were available mainly from the ROSAT PSPC with a significant minority of the data originating from the Einstein IPC. We also utilized Chandra data from David et al. (2006) for six of the OS01 galaxies having only X-ray upper limits. Figure 8 shows the 0.5–2.0 keV luminosity versus -band luminosity for galaxies included in the OS01 sample with kpc; X-ray luminosities have been normalized to the 0.5–2.0 keV bandpass using the X-ray SED adopted in OS01 (i.e., a MEKAL plasma SED with solar metallicity and a plasma temperature of 1 keV). We have denoted field, central-cluster, brightest-group, and AGN-hosting early-type galaxies as identified from the OS01 sample; several well-studied examples have been highlighted (M32, M87, NGC 1399, NGC 1600, NGC 4697, and NGC 5102) for reference.
As noted in 1.1, the X-ray and -band luminosities of local early-type galaxies are observed to be correlated, and these correlations follow a power law:
| (4) |
where and are fitting constants. Using the OS01 sample, we performed linear-regression analyses for galaxies with and separately to determine and for each luminosity regime. When doing these calculations, we excluded (1) sources at kpc, (2) sources with X-ray emission that may be significantly influenced by X-ray-emitting gas associated with galaxy clusters or groups such as central-cluster and brightest-group galaxies, (3) AGN-hosting galaxies, (4) NGC 5102, due to its anomalously low X-ray luminosity and evidently recent star-formation activity (e.g., OS01; Kraft et al. 2005; see Fig. 8), and (5) NGC 4782, which has an anomalously large that drives the correlation (i.e., ; see, e.g., OS01). We utilized Kendall’s tau (Kendall 1938) to measure the correlation strengths and Buckley-James regression (Buckley & James 1979; Isobe et al. 1986) to calculate the best-fit correlation parameters (i.e., and ) for each luminosity regime. These tools were available through the Astronomy SURVival Analysis software package (ASURV Rev. 1.2; Isobe & Feigelson 1990; LaValley et al. 1992). We found correlation significances of 6.8 and 2.8 for the and galaxy samples, respectively. We found that for the optically luminous sample and (solid line in Fig. 8), and for the optically faint sample and (dashed line in Fig. 8). We note that the – relation for optically faint galaxies is poorly constrained with 75% of the galaxies having only X-ray upper limits; however, since these galaxies are thought to be dominated by LMXBs, investigations of the LMXB luminosity per unit -band luminosity can offer a consistency check for this relation. Using Chandra observations of 14 E/S0 galaxies, Kim & Fabbiano (2004) found that for LMXBs with ergs s-1, using a fixed slope of . This value is the most tightly constrained (LMXB)– relation available at present and is consistent with other investigations of the discrete-source contribution (e.g., Sarazin 1997; OS01 and references therein; Gilfanov 2004) and our calculated – relation for local optically faint early-type galaxies. For reference, the expected discrete-source contribution from LMXBs is presented in Figure 8 as a shaded region, which represents the dispersion of the relation. We note that the – relation for local optically faint early-type galaxies (dashed line) is consistent with that expected for X-ray emission originating strictly from LMXBs.
In Figure 8, we have plotted mean quantities from our samples using the same symbols and symbol-shading schemes that were adopted in Figure 5. The plotted error bars for our stacked samples were computed by propagating (1) Poisson errors on the source counts (Gehrels 1986), (2) 1 errors on , and (3) systematic errors on the SED-dependent parameters (i.e., count-rate to flux conversion and ); these errors were propagated following the “numerical method” described in 1.7.3 of Lyons (1991). In an initial evaluation of these results, we find that the average X-ray properties of our optically luminous samples appear to follow the local relation at all redshifts. In contrast, our optically faint samples deviate from the local relation significantly (1.5 at ) over the redshift range 0.1–0.5, suggesting there may be some evolution in the LMXB populations within these galaxies.
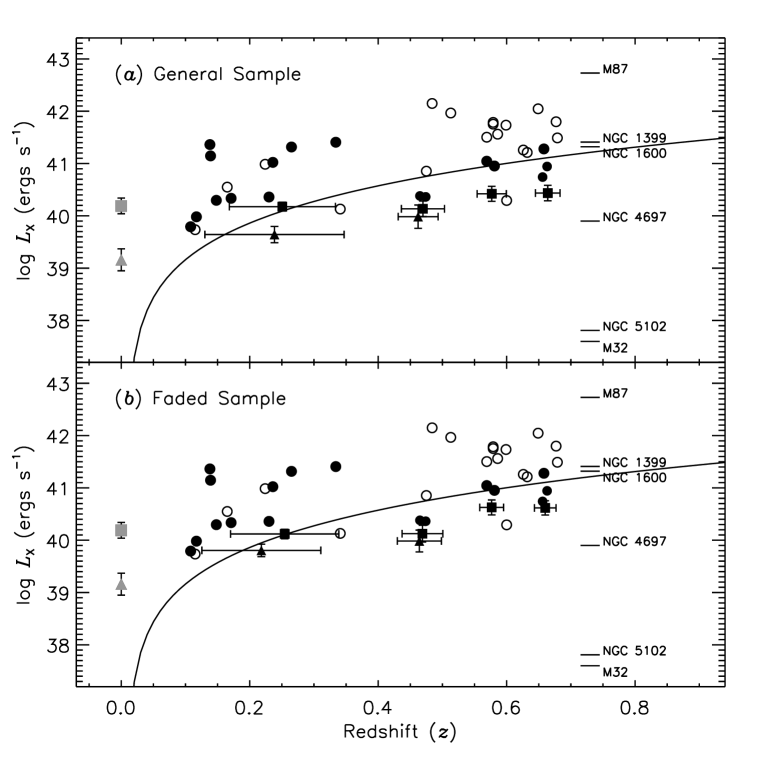
Figures 9a and 9b show the mean 0.5–2.0 keV luminosities () of our stacked general and faded samples, respectively; optically luminous and faint samples are indicated as dark filled squares and triangles, respectively. X-ray-detected sources are shown as circles, which represent both normal galaxies (filled circles) and AGN candidates (open circles). We have included the corresponding mean X-ray luminosities for local early-type galaxies from the OS01 optically luminous and faint samples in matched optical-luminosity ranges; as before, these samples were filtered to exclude galaxies classified as AGNs, central-cluster galaxies, brightest-group galaxies, NGC 5102, and NGC 4782. Mean optical and X-ray luminosities for the OS01 samples were computed using the Kaplan-Meier estimator (e.g., Feigelson & Nelson 1986) within ASURV, which appropriately handles censored data. When calculating these mean luminosities, we filtered the OS01 sample to include only sources with distances Mpc and Mpc for the optically luminous and faint samples, respectively; these distances represent approximate completeness limits for the optical-luminosity ranges used here. We calculated mean X-ray luminosities of and for the optically luminous and faint samples, respectively; error bars here represent 1 errors on the means (computed with ASURV). These calculations were made using 102 optically luminous galaxies (60 upper limits) and 48 optically faint galaxies (36 upper limits). We attempted to improve the X-ray-detection fractions of these samples by using subsamples of galaxies that were created with distance limits smaller than the completeness limits quoted above; however, we found no improvement in these fractions.
Figures 10a and 10b show the X-ray–to–-band mean luminosity ratio () for our general and faded samples, respectively (symbols have the same meaning as they did in Fig. 9); the expected local discrete-source contribution and its dispersion are shown as a horizontal dotted line and the surrounding shaded region, respectively. As observed in Figure 8, we find little evidence for evolution in our optically luminous samples (both general and faded). Using the available data, we find that and for our optically luminous general and faded samples, respectively. In order to constrain further the allowed redshift evolution of , we utilized the statistic and a simple evolutionary model, . For this single-parameter model, we constrained using 90% confidence errors (). We found best-fit parameters of ( for 4 degrees of freedom) and ( for 4 degrees of freedom) for our optically luminous general and faded samples, respectively. For the optically faint early-type samples, we observe suggestive redshift evolution in , and by it has increased above the local relation by a factor of and for our general and faded samples, respectively. Using the statistic and the same simple model for redshift evolution presented above, we find best-fit values of ( for 2 degrees of freedom) and ( for 2 degrees of freedom) for our optically faint general and faded samples, respectively. We note that the evolution observed for optically faint early-type galaxies is largely driven by the value of at . Due to the fact that the value for is based on 48 sources, with 36 (75%) having only X-ray upper limits, we cannot rule out the possibility that at is significantly affected by systematic errors. Moreover, the total X-ray emission from optically faint galaxies is expected to vary significantly between galaxies due to low numbers of LMXBs and variable amounts of hot gas, and therefore large fractional errors are expected for . We therefore consider this result to be only marginal at present.
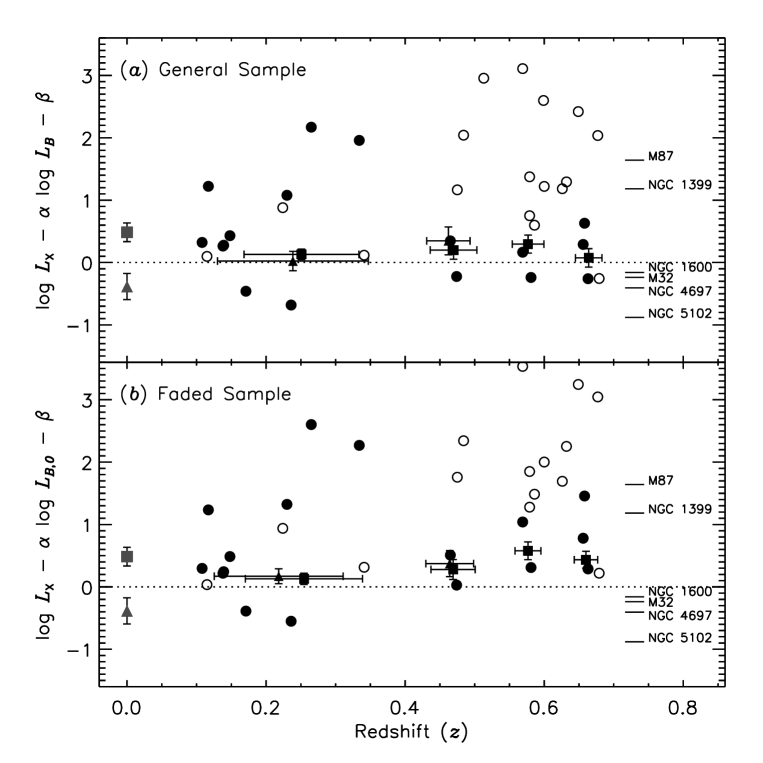
As noted above, the local relation between and is nonlinear for optically luminous early-type galaxies. In order to investigate whether such nonlinearities have an effect on our overall results, we created Figure 11, which illustrates residuals to the local best-fit relations, , for optically luminous (; ) and faint (; ) samples. Figure 11 shows that the nonlinearities observed in the local – relation do not affect our conclusions drawn from using as a proxy for evolution. Furthermore, due to the approximate equality of the mean values of for all samples of a given luminosity class, quantitative analyses that account for nonlinearities in the – relations yield roughly identical results to those quoted using simply .
3.2.2 Assessing Remaining AGN Contamination
In this section we assess whether the stacked properties presented above suffer from contamination by AGNs with 2–8 keV luminosities below our detection threshold. In 3.1 (see also Fig. 6), we presented the cumulative AGN fraction, , the fraction of early-type galaxies harboring an AGN with a 2–8 keV luminosity of or greater. To first order, we can use the functional form of to generate a census of the AGN population that we expect to be missing due to sensitivity limitations. As noted in 3.1, there is evidence that evolves with redshift. We modelled this redshift evolution of using the functional form, (see 3.1 for justification). We also assumed that the dependence of upon was similar at all redshifts over the range 0.1–0.7. Using our faded sample of optically luminous early-type galaxies we computed , the average cumulative AGN fraction over the redshift range 0.1–0.7 (), following the procedure outlined in 3.1; this was done to obtain a better understanding of the overall shape of the curve. Figure 12a (filled circles with error bars) shows our computed values of as a function of . We fit the data points using a quadratic relation (i.e., , where , , and ; thick solid curve in Fig. 12a) over the luminosity range 40–44; this covers the same luminosity range for AGNs as the OS01 local sample. Using our best-fit relation for and our model for the redshift evolution of , we calculated for each of our optically luminous faded samples following:
| (5) |
where is the median redshift of each sample, is the median redshift of our best-fit redshift-averaged relation, . In Figure 12a, we show our estimates of for each of our optically luminous faded samples; these curves are annotated on the figure. For comparison, we have shown the AGN fraction measured for DRGs (see 1) at by Rubin et al. (2004; open diamond) and have extrapolated our model for out to (dot-dashed curve). We note that even at our model agrees reasonably well with observations.
In order to estimate the amount of AGN contamination that may be contributing to our stacked signals, it is desirable to convert the cumulative AGN fractions to differential forms (i.e., the fraction of galaxies harboring AGNs within discrete X-ray luminosity bins). Using the model for presented above, we estimated the fractions of galaxies harboring an AGN within luminosity bins of width for each of our optically luminous faded samples; we refer to these as differential AGN fractions, . The histograms in Figure 12b show our estimates of . Due to the deep Chandra coverage in the E-CDF-S region, a large fraction of the luminous AGNs ( ergs s-1) would have been removed from our samples before stacking (see 2.1.1). We are therefore only interested in the fraction of galaxies falling below our sensitivity limit. Using the sensitivity maps described in 3.1, we determined the fraction of optically luminous galaxies within each of our stacked faded samples for which we could not have detected an AGN of luminosity if present; we refer to these fractions as (i.e., the fractions of galaxies below our sensitivity limit) and show them in Figure 12c. For each of our optically luminous faded samples we calculated the fraction of sources that harbor an undetected AGN with 2–8 keV luminosity (in bins of width ), , by multiplying by . In Figure 12d, we show as a function of . Using , we computed the approximate AGN contamination with the following summation:
| (6) |
where the summation is over all bins of . We find ergs s-1 for our samples. For our samples with , AGNs with ergs s-1 contribute 70% of the total estimate. Furthermore, when extrapolating our model for down to much lower values of , we find no significant difference in our estimates of . We note that this result is mildly dependent on our extrapolation of to values of ergs s-1. If there exists a large population of radiatively-inefficient low-luminosity AGNs in early-type galaxies that radiate within this X-ray luminosity range (e.g., advection-dominated accretion flows [ADAFs]), then we may be underestimating . However, Chandra observations of 50 early-type galaxies in the local universe have revealed that the majority of the central supermassive black holes in these galaxies are radiating at extremely low efficiencies and typically have observed ergs s-1 (e.g., Loewenstein et al. 2001; David et al. 2005; Pellegrini 2005). Therefore a change in the shape of at ergs s-1 is not expected.
We converted to a 0.5–2.0 keV luminosity assuming a power-law model with an effective photon index , which was determined by stacking all 24 AGN candidates in our optically luminous faded sample; in this calculation we purposely made no attempt to correct for intrinsic absorption. For these 24 AGN candidates, we find that the mean band ratio , which corresponds to an effective photon index of ; this effective photon index is in agreement with the effective photon indices measured for sources in the Chandra Deep Field-North (CDF-N; see Fig. 14 of Alexander et al. 2003) with similar fluxes. If we assume is a characteristic effective photon index for the AGNs we expect to be missing, then we find that AGN contamination can account for 4% and 11% of the observed 0.5–2.0 keV emission from our optically luminous faded samples at and , respectively; this amount does not significantly affect the results presented in 3.2.1 above. We note that the X-ray SED used in this calculation has an important effect on the overall estimate of the AGN contamination. Since our estimate for contamination decreases as decreases, the amount of contamination in our samples may be affected if our choice of is too flat. However, if we choose a steeper effective photon index such as (the observed spectrum of the X-ray background), we still find that the estimated AGN contribution to our 0.5–2.0 keV signal is too low (25% at ) to make a substantive difference to our results. Furthermore, as discussed in 2.1.1, we have taken additional precautions to eliminate several AGN candidates that were not detected in the 2–8 keV bandpass; these sources would not be taken into account in this estimate for AGN contamination. We also note that similar results are found when performing the above analyses using our optically luminous general samples.
Due to poor statistical constraints on AGN activity in optically faint early-type galaxies, an estimate of could not be determined reliably using the present data. Studies of the AGN fraction as a function of galactic stellar mass have found that AGNs are much more commonly observed in massive galaxies than lower-mass galaxies (e.g., Kauffmann et al. 2003). We therefore approximated a strict upper limit to the AGN contribution to the X-ray emission from our optically faint early-type samples by using the same model for presented above for the more massive optically luminous galaxies. Using this model, we estimate that AGNs contribute 20% and 40% of the X-ray emission from our optically faint samples (both general and faded) assuming and , respectively. These limits slightly reduce the significance of the quoted evolution for our optically faint faded samples such that is estimated to be [] and for and , respectively; however, we note that these limits should be regarded as very conservative.
4 Discussion
The above results suggest differing evolutionary histories for optically luminous and faint early-type galaxies. As shown in 3.2.2, our results are not expected to be significantly affected by an undetected population of AGNs. Therefore, changes in the X-ray emission with redshift are likely the result of global changes in the emission from hot interstellar gas and/or LMXBs. In the sections below, we discuss possible interpretations of the results for our optically luminous and faint early-type galaxies in turn.
4.1 Optically Luminous Early-Type Galaxies
As discussed in 2.2, we chose the SB for our stacking analyses to sample directly the X-ray emission from hot interstellar gas. Therefore, the near constancy of with redshift can be largely explained as a general balance between the energy losses from the hot gas () and the energy deposition from heating mechanisms () over each cooling time, . Here we investigate the relative contributions from feedback mechanisms to constrain physical models of the heating of the hot gas in early-type galaxies. As noted in 1.2, the typical inferred radiative cooling time for the central regions of an optically luminous early-type galaxy is yr. Since each of our optically luminous early-type galaxy redshift bins are larger than the cooling timescale (i.e., our redshift bins have temporal widths in the range of 0.5–4.4 yr), we can estimate the redshift-dependent energy components following:
| () |
| () |
Here, is the redshift-dependent globally-averaged power output from the gaseous component of our optically luminous early-type galaxies. The first two terms of equation 7b represent AGN heating from both radiative and mechanical feedback power, respectively. The radiative feedback power is represented as the product of the average 2–8 keV AGN luminosity per galaxy (), its bolometric correction factor (; e.g., Marconi et al. 2004; Barger et al. 2005), and the efficiency factor describing the coupling between radiation and the hot interstellar gas (). We note that in cases where the Compton temperature of the AGN SED falls below the temperature of the hot interstellar gas, radiation from the central AGN may effectively cool the gas and thereby drive to negative values (see, e.g., 6 of Nulsen & Fabian 2000; Ciotti & Ostriker 2001). Mechanical power (e.g., through AGN jets) is likely to be a very important feedback mechanism, and we have indicated its contribution as . Finally, represents additional energy input from alternative forms of heating over each cooling time (see below).
Using the hot-gas component of the X-ray SED for NGC 1600 (see dotted curve in Fig. 1a), we estimate ; for our optically luminous samples, this amounts to a mean value of ergs s-1. We measured using our redshift-dependent model for the differential fraction, , which was presented in 3.2.2 (see also Fig. 12b). Duty cycles for AGN activity in any given galaxy are expected to be shorter than the timescales represented by each of our redshift bins; however, since we are considering large populations of early-type galaxies, we do not expect significant variations in the AGN fraction (as measured from the E-CDF-S “snapshot”) at any given time within each redshift bin. Therefore using this model, we can calculate following:
| () |
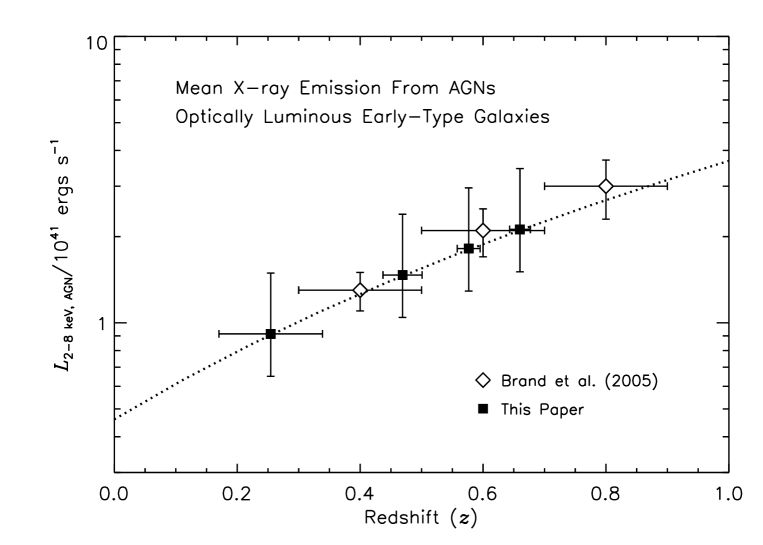
where the summation is over bins of and covers the luminosity range ergs s-1. We found and 21 ergs s-1 per galaxy at and , respectively. In Figure 13, we show as a function of redshift for our optically luminous faded samples (filled squares). For comparison, we also show stacking results from the Brand et al. (2005) samples of 0.4–0.9 early-type galaxies (open diamonds), which have mean -band absolute magnitudes that are well matched to those of our optically luminous faded samples; these mean luminosities are dominated by X-ray emission from AGNs and therefore provide a good estimate of (80–90% of the emission is from AGNs). Using these data and our model for the evolution of the X-ray emission from transient AGNs, , we found ergs s-1 (see the dotted curve in Fig. 13).
Using the above relations and the assumption that , we arrive at the following relation:
| () |
As discussed in 1.2, transient AGN feedback is expected to play a significant role in the heating of the hot interstellar gas. If we assume that AGN feedback is largely responsible for keeping the gas hot, then we can neglect the last term of equation 9 (i.e., ). With this assumption and the observed constancy of with redshift, we infer that the strongly-evolving radiative power must be poorly coupled to the hot interstellar gas, such that . This suggests that mechanical AGN power (i.e., ) dominates the feedback over the redshift range 0.0–0.7 and does not evolve in the same way as the radiative power. We note that it is also possible that may play some non-negligible role in the heating of the hot gas. Additional heating sources may include inward thermal conduction from the large reservoirs of hot gas found in the outer regions of early-type galaxies (e.g., Narayan & Medvedev 2001; Brighenti & Mathews 2003), Type Ia supernovae and stellar winds (e.g., Loewenstein & Mathews 1987, 1991), and infalling circumgalactic gas (e.g., Brighenti & Mathews 1998); however, the influence of these heating sources is presently not well constrained.
4.2 Optically Faint Early-Type Galaxies
For our optically faint early-type galaxy samples, we found suggestive evidence for redshift evolution in over the redshift range 0.0–0.5 (see 3.2.1 and Figs. 10 and 11). Although some of the observed emission may be due to AGN activity ( 3.2.2), there remains suggestive evidence that normal X-ray activity is evolving with redshift, and we discuss possible scenarios explaining this evolution below.
One possible driver of evolution may come from global changes in the LMXB populations within optically faint early-type galaxies. As discussed in 1.2, LMXBs from primordial binaries within the galactic field are expected to dominate the overall LMXB emission from optically faint early-type galaxies; this differs from the LMXB emission from optically luminous early-type galaxies, which originates primarily from globular clusters. LMXBs from primordial binaries emerge in the wake of star-formation epochs 1–10 Gyr following a major star-formation event. Therefore, changes in the mean early-type galaxy stellar age with redshift should result in observed changes in the mean X-ray emission from these systems. Furthermore, these changes are expected to be most conspicuous 1 Gyr after major star-formation events (e.g., White & Ghosh 1998; Ghosh & White 2001). Galaxy formation scenarios that favor a more recent emergence of the optically faint early-type galaxy population onto the red-sequence such as downsizing or mass-dependent merging histories (see discussion and references in 1) would predict significant evolution of the LMXB emission from these systems.
A second source of evolution of the X-ray emission from optically faint early-type galaxies could in principle come from cooling of the hot X-ray-emitting gas. However, studies of optically faint early-type galaxies in the local universe have shown that the hot gas emission generally makes up a minority fraction (typically 40%) of the total X-ray emission (e.g., David et al. 2006) and is therefore less likely to be completely responsible for the observed evolution than LMXBs.
4.3 Future Work
Understanding the evolution of the X-ray properties of early-type galaxies could be greatly improved by (1) constraining better the X-ray properties of local optically faint early-type galaxies and making a census of their AGN populations, (2) performing additional investigations using other deep Chandra fields that have complementary HST coverage, and (3) conducting deeper observations using Chandra or future X-ray missions. These possibilities are discussed in more detail below.
In Figure 8, we showed the values of and for local early-type galaxies from the OS01 sample, which is the largest, uniformly-selected sample available for studying the – correlations of local early-type galaxies. The majority (75%) of the isolated optically faint early-type galaxies have only X-ray upper limits, which has restricted our interpretation of the redshift evolution of these galaxies. New Chandra observations of the galaxies having only X-ray upper limits could not only improve the characterization of the – correlation at lower , but could also provide useful insight into the role of hot interstellar gas and LMXBs within the galactic field, which are presently not well constrained. Furthermore, stacking analyses of well-chosen samples of these galaxies could provide useful statistical insight into the mean X-ray properties of these galaxies and mitigate the effects of poor source statistics for individual galaxies.
Chandra stacking analyses using additional samples of early-type galaxies could effectively reduce the sizes of the errors on mean quantities and/or allow for the analyses of samples in more finely partitioned bins of redshift and optical luminosity. An important requirement for such studies is to obtain an adequate census of the underlying AGN population, which may significantly influence the stacking results. In order to remove effectively AGNs from stacked signals at , relatively deep Chandra observations are necessary. Using the luminosity-dependent AGN fractions determined in 3.2.2, we suggest that AGNs will provide significant contamination for Chandra exposures of 100 ks. Therefore, studies of distant early-type galaxies using multiwavelength data (including HST coverage) from already existing Chandra fields such as the 2 Ms CDF-N or the 200 ks All-wavelength Extended Groth Strip International Survey (AEGIS; Nandra et al. 2005; Davis et al. 2006) would improve the present situation.
Finally, deeper Chandra observations of already existing fields (most notably the CDF-N) would provide an improved census of the low-to-moderate luminosity AGN population at higher redshifts and connect the X-ray properties of these relatively passive early-type populations with those of their higher redshift progenitors (e.g., DRGs, EROs, and distant submillimeter-emitting galaxies; e.g., Alexander et al. 2005). In addition to the improvement that additional Chandra observations could provide, it is also worth noting that future X-ray missions such as XEUS and Generation-X555For further information regarding the future X-ray missions XEUS and Generation-X, see http://www.rssd.esa.int/XEUS/ and http://genx.cfa.harvard.edu, respectively. should allow the first investigations of the evolution of the normal early-type galaxy X-ray luminosity function with redshift.
5 Summary
Using X-ray stacking analyses, we have investigated the X-ray evolution of 539, 0.1–0.7 early-type galaxies located in the E-CDF-S. These galaxies were selected using a combination of red-sequence colors and Sérsic indices as a part of the COMBO-17 and GEMS surveys (M05). We classified our original early-type galaxy sample as the “general sample” and generated an additional “faded sample,” which was corrected for the passive fading of old stellar populations. Using these samples, we analyzed separately optically luminous ( ) and faint ( ) populations, which are expected to have soft X-ray spectra dominated by hot interstellar gas and LMXBs, respectively. Our primary goal was to use stacking analyses to measure and constrain the redshift evolution of the average X-ray emission from normal early-type galaxies. To achieve this, we used a variety of techniques to identify powerful AGNs, which we removed from our stacking analyses. Our key results are as follows:
-
1.
We detected 49 early-type galaxies in the X-ray band and classified 32 of these as AGN candidates based on their X-ray, optical, and radio properties (see 2.1.1 for details); the remaining 17 X-ray-detected sources had multiwavelength properties consistent with normal galaxies. In addition to the 32 X-ray-detected AGN candidates, we identified 13 galaxies with AGN-like radio–to–optical flux ratios, which we characterized as potential AGNs. We found that the majority of the AGN candidates were coincident with optically luminous early-type hosts. The inferred AGN fraction for our optically luminous galaxies shows evidence for evolution with redshift in a manner consistent with the evolution expected from other studies of AGN evolution.
-
2.
When stacking the X-ray counts from our normal optically luminous early-type galaxy samples, we found that the X-ray–to–optical mean luminosity ratio, , stays roughly constant over the redshift range 0.0–0.7, which indicates that the X-ray-emitting gas has not significantly evolved over the last 6.3 Gyr (i.e., since ). Using the data available, we found that = and for our general and faded samples, respectively. We interpret the lack of X-ray evolution of optically luminous early-type galaxies to be due to an energy balance between the heating and cooling of the hot gas over each cooling time. When assuming that the heating is largely due to transient AGN activity, we found that mechanical feedback dominates the heating out to versus radiative power, which we inferred to be very poorly coupled to the gas. Furthermore, this result suggests that the radiative and mechanical AGN power evolve differently with cosmic time.
-
3.
For our optically faint early-type galaxy samples, we found suggestive evidence that increases with redshift. By 0.5, is measured to be and times larger than that measured at for our general and faded samples, respectively; however, due to poor statistical constraints on the local relation and the undetected AGN population, we could not confidently rule out the null hypothesis. We hypothesized that evolution of the optically faint early-type galaxy X-ray emission may be due to the evolution of LMXBs in galaxies that have recently joined the red-sequence and/or the cooling of hot gas within these galaxies.
References
- Afonso et al. (2006) Afonso, J., Mobasher, B., Koekemoer, A., Norris, R. P., & Cram, L. 2006, AJ, 131, 1216
- Ashman & Zepf (1998) Ashman, K. M., & Zepf, S. E. 1998, Globular Cluster Systems (Cambridge: Cambrige University Press)
- Alexander et al. (2003) Alexander, D. M., et al. 2003, AJ, 126, 539
- Alexander et al. (2005) Alexander, D. M., Bauer, F. E., Chapman, S. C., Smail, I., Blain, A. W., Brandt, W. N., & Ivison, R. J. 2005, ApJ, 632, 736
- Allen et al. (2006) Allen, S. W., Dunn, R. J. H., Fabian, A. C., Taylor, G. B., & Reynolds, C. S. 2006, MNRAS, 372, 21
- Barger et al. (2005) Barger, A. J., et al. 2005, AJ, 129, 578
- Barger et al. (2006) Barger, A. J., Cowie, L. L., Wang, W.-H. 2007, ApJ, in-press (astro-ph/0609374)
- Bauer et al. (2004) Bauer, F. E., Alexander, D. M., Brandt, W. N., Schneider, D. P., Treister, E., Hornschemeier, A. E., & Garmire, G. P. 2004, AJ, 128, 2048
- Bell et al. (2004a) Bell, E. F., et al. 2004a, ApJ, 608, 752
- Bell et al. (2004b) Bell, E. F., et al. 2004b, ApJ, 600, L11
- Bell et al. (2005) Bell, E. F., et al. 2005, ApJ, 625, 23
- Best et al. (2005) Best, P. N., Kauffmann, G., Heckman, T. M., Brinchmann, J., Charlot, S., Ivezić, Ž., & White, S. D. M. 2005, MNRAS, 362, 25
- Best et al. (2006) Best, P. N., Kaiser, C. R., Heckman, T. M., & Kauffmann, G. 2006, MNRAS, 368, L67
- Binney & Tabor (1995) Binney, J., & Tabor, G. 1995, MNRAS, 276, 663
- Bîrzan et al. (2004) Bîrzan, L., Rafferty, D. A., McNamara, B. R., Wise, M. W., & Nulsen, P. E. J. 2004, ApJ, 607, 800
- Blanton et al. (2001) Blanton, E. L., Sarazin, C. L., & Irwin, J. A. 2001, ApJ, 552, 106
- Bower et al. (2006) Bower, R. G., et al. 2006, MNRAS, 370, 645
- Brand et al. (2005) Brand, K., et al. 2005, ApJ, 626, 723
- Brandt et al. (2001) Brandt, W. N., Hornschemeier, A. E., Schneider, D. P., Alexander, D. M., Bauer, F. E., Garmire, G. P., & Vignali, C. 2001, ApJ, 558, L5
- Brandt & Hasinger (2005) Brandt, W. N., & Hasinger, G. 2005, ARA&A, 43, 827
- Bregman et al. (2005) Bregman, J. N., Miller, E. D., Athey, A. E., & Irwin, J. A. 2005, ApJ, 635, 1031
- Brighenti & Mathews (1998) Brighenti, F., & Mathews, W. G. 1998, ApJ, 495, 239
- Brighenti & Mathews (2003) Brighenti, F., & Mathews, W. G. 2003, ApJ, 587, 580
- Brighenti & Mathews (2006) Brighenti, F., & Mathews, W. G. 2006, ApJ, 643, 120
- Brown & Bregman (1998) Brown, B. A., & Bregman, J. N. 1998, ApJ, 495, L75
- Buckley & James (1979) Buckley, J., & James, I. 1979, Biometrika, 66, 439
- Bundy et al. (2005) Bundy, K., et al. 2006, ApJ, in-press (astro-ph/0512465)
- Canizares et al. (1987) Canizares, C. R., Fabbiano, G., & Trinchieri, G. 1987, ApJ, 312, 503
- Chabrier (2003) Chabrier, G. 2003, PASP, 115, 763
- Chapman et al. (2005) Chapman, S. C., Blain, A. W., Smail, I., & Ivison, R. J. 2005, ApJ, 622, 772
- Churazov et al. (2001) Churazov, E., Brüggen, M., Kaiser, C. R., Böhringer, H., & Forman, W. 2001, ApJ, 554, 261
- Churazov et al. (2002) Churazov, E., Sunyaev, R., Forman, W., Böhringer, H. 2002, MNRAS, 332, 729
- Churazov et al. (2005) Churazov, E., et al. 2005, MNRAS, 363, L91
- Church & Balucińska-Church (2001) Church, M. J., & Balucińska-Church, M. 2001, A&A, 369, 915
- Cimatti et al. (2006) Cimatti, A., Daddi, E., & Renzini, A. 2006, A&A, 453, L29
- Ciotti & Ostriker (1997) Ciotti, L., & Ostriker, J. P. 1997, ApJ, 487, L105
- Ciotti & Ostriker (2001) Ciotti, L., & Ostriker, J. P. 2001, ApJ, 551, 131
- Cowie et al. (1996) Cowie, L. L., Songaila, A., Hu, E. M., & Cohen, J. G. 1996, AJ, 112, 839
- Croton et al. (2006) Croton, D. J., et al. 2006, MNRAS, 365, 11
- David et al. (2005) David, L. P., Jones, C., Forman, W., & Murray, S. S. 2005, ApJ, 635, 1053
- David et al. (2006) David, L. P., Jones, C., Forman, W., Vargas, I. M., Nulsen, P. 2006, ApJ, in-press (astro-ph/0609113)
- Davis et al. (2006) Davis, M., et al. 2006, ApJ, submitted (astro-ph/0607355)
- De Lucia et al. (2006) De Lucia, G., Springel, V., White, S. D. M., Croton, D., & Kauffmann, G. 2006, MNRAS, 366, 499
- Di Matteo et al. (2005) Di Matteo, T., Springel, V., & Hernquist, L. 2005, Nature, 433, 604
- Ellis & O’Sullivan (2006) Ellis, S. C., & O’Sullivan, E. 2006, MNRAS, 367, 627
- Faber et al. (2006) Faber, S. M., et al. 2006, ApJ, submitted (astro-ph/0506044)
- Feigelson & Nelson (1985) Feigelson, E. D., & Nelson, P. I. 1985, ApJ, 293, 192
- Feulner et al. (2006) Feulner, G., Hopp, U., & Botzler, C. S. 2006, A&A, 451, L13
- Fioc & Rocca-Volmerange (1997) Fioc, M., & Rocca-Volmerange, B. 1997, A&A, 326, 950
- Forman et al. (1985) Forman, W., Jones, C., & Tucker, W. 1985, ApJ, 293, 102
- Forman et al. (2005) Forman, W., et al. 2005, ApJ, 635, 894
- Förster Schreiber et al. (2004) Förster Schreiber, N. M., et al. 2004, ApJ, 616, 40
- (53) Freeman, P.E., Kashyap, V., Rosner, R., & Lamb, D.Q. 2002, ApJS, 138, 185
- Fukazawa et al. (2006) Fukazawa, Y., Botoya-Nonesa, J. G., Pu, J., Ohto, A., & Kawano, N. 2006, ApJ, 636, 698
- (55) Gehrels, N. 1986, ApJ, 303, 336
- Ghosh & White (2001) Ghosh, P., & White, N. E. 2001, ApJ, 559, L97
- (57) Giacconi, R., et al. 2002, ApJS, 139, 369
- (58) Giavalisco, M., et al. 2004, ApJ, 600, L93
- Gilfanov (2004) Gilfanov, M. 2004, MNRAS, 349, 146
- Grimm et al. (2002) Grimm, H.-J., Gilfanov, M., & Sunyaev, R. 2002, A&A, 391, 923
- Hasinger et al. (2005) Hasinger, G., Miyaji, T., & Schmidt, M. 2005, A&A, 441, 417
- Hopkins et al. (2006) Hopkins, P. F., Narayan, R., & Hernquist, L. 2006, ApJ, 643, 641
- Hornschemeier et al. (2000) Hornschemeier, A. E., et al. 2000, ApJ, 541, 49
- Hornschemeier et al. (2002) Hornschemeier, A. E. 2002, ApJ, 568, 82
- Irwin et al. (2003) Irwin, J. A., Athey, A. E., & Bregman, J. N. 2003, ApJ, 587, 356
- Irwin et al. (2004) Irwin, J. A., Bregman, J. N., & Athey, A. E. 2004, ApJ, 601, L143
- Irwin (2005) Irwin, J. A. 2005, ApJ, 631, 511
- Isobe et al. (1986) Isobe, T., Feigelson, E. D., & Nelson, P. I. 1986, ApJ, 306, 490
- Isobe & Feigelson (1990) Isobe, T., & Feigelson, E. 1990, BAAS, 22, 917
- Jones et al. (2002) Jones, C., et al. 2002, ApJ, 567, L115
- Jones et al. (2005) Jones, C., et al. 2005, Advances in Space Research, 36, 597
- Juett (2005) Juett, A. M. 2005, ApJ, 621, L25
- Kendall (1938) Kendall, M. G. 1938, Biometrika, 30, 81
- Khochfar & Burkert (2003) Khochfar, S., & Burkert, A. 2003, ApJ, 597, L117
- Kim & Fabbiano (2004) Kim, D.-W., & Fabbiano, G. 2004, ApJ, 611, 846
- Kim et al. (2006) Kim, D.-W., et al. 2006, ApJ, 644, 829
- Kinney et al. (1996) Kinney, A. L., Calzetti, D., Bohlin, R. C., McQuade, K., Storchi-Bergmann, T., & Schmitt, H. R. 1996, ApJ, 467, 38
- Kraft et al. (2005) Kraft, R. P., Nolan, L. A., Ponman, T. J., Jones, C., & Raychaudhury, S. 2005, ApJ, 625, 785
- Laird et al. (2005) Laird, E. S., Nandra, K., Adelberger, K. L., Steidel, C. C., & Reddy, N. A. 2005, MNRAS, 359, 47
- Lavalley et al. (1992) Lavalley, M., Isobe, T., & Feigelson, E. 1992, ASP Conf. Ser. 25: Astronomical Data Analysis Software and Systems I, 25, 245
- Lee et al. (2006) Lee, J. H., Lee, M. G., Hwang, H. S. 2006, AJ, in-press (astro-ph/0606608)
- Le Fèvre et al. (2004) Le Fèvre, O., et al. 2004, A&A, 428, 1043
- Lehmer et al. (2005a) Lehmer, B. D., et al. 2005a, AJ, 129, 1
- Lehmer et al. (2005b) Lehmer, B. D., et al. 2005b, ApJS, 161, 21
- Lehmer et al. (2006) Lehmer, B. D., et al. 2006, AJ, 131, 2394
- Loewenstein & Mathews (1987) Loewenstein, M., & Mathews, W. G. 1987, ApJ, 319, 614
- Loewenstein & Mathews (1991) Loewenstein, M., & Mathews, W. G. 1991, ApJ, 373, 445
- Loewenstein et al. (2001) Loewenstein, M., Mushotzky, R. F., Angelini, L., Arnaud, K. A., & Quataert, E. 2001, ApJ, 555, L21
- Lyons (1991) Lyons, L. 1991, Data Analysis for Physical Science Students. Cambridge University Press, Cambridge
- Maccacaro et al. (1988) Maccacaro, T., Gioia, I. M., Wolter, A., Zamorani, G., & Stocke, J. T. 1988, ApJ, 326, 680
- Mahdavi & Geller (2001) Mahdavi, A., & Geller, M. J. 2001, ApJ, 554, L129
- Marconi et al. (2004) Marconi, A., Risaliti, G., Gilli, R., Hunt, L. K., Maiolino, R., & Salvati, M. 2004, MNRAS, 351, 169
- Mathews & Brighenti (2003) Mathews, W. G., & Brighenti, F. 2003, ARA&A, 41, 191
- Matsumoto et al. (1997) Matsumoto, H., Koyama, K., Awaki, H., Tsuru, T., Loewenstein, M., & Matsushita, K. 1997, ApJ, 482, 133
- McCarthy (2004) McCarthy, P. J. 2004, ARA&A, 42, 477
- McIntosh et al. (2005) McIntosh, D. H., et al. 2005, ApJ, 632, 191 (M05)
- McNamara et al. (2006) McNamara, B. R., et al. 2006, ApJ, 648, 164
- Mignoli et al. (2005) Mignoli, M., et al. 2005, A&A, 437, 883
- Murray et al. (2005) Murray, S. S., et al. 2005, ApJS, 161, 1
- Nandra et al. (2002) Nandra, K., Mushotzky, R. F., Arnaud, K., Steidel, C. C., Adelberger, K. L., Gardner, J. P., Teplitz, H. I., & Windhorst, R. A. 2002, ApJ, 576, 625
- Nandra et al. (2005) Nandra, K., et al. 2005, MNRAS, 356, 568
- Narayan & Medvedev (2001) Narayan, R., & Medvedev, M. V. 2001, ApJ, 562, L129
- Norman et al. (2004) Norman, C., et al. 2004, ApJ, 607, 721
- Nulsen & Fabian (2000) Nulsen, P. E. J., & Fabian, A. C. 2000, MNRAS, 311, 346
- Nulsen et al. (2005a) Nulsen, P. E. J., Hambrick, D. C., McNamara, B. R., Rafferty, D., Birzan, L., Wise, M. W., & David, L. P. 2005a, ApJ, 625, L9
- Nulsen et al. (2005b) Nulsen, P. E. J., McNamara, B. R., Wise, M. W., & David, L. P. 2005b, ApJ, 628, 629
- O’Sullivan et al. (2001) O’Sullivan, E., Forbes, D. A., & Ponman, T. J. 2001, MNRAS, 328, 461 (OS01)
- Papovich et al. (2006) Papovich, C., et al. 2006, ApJ, 640, 92
- Pellegrini (2005) Pellegrini, S. 2005, ApJ, 624, 155
- Peterson et al. (2006) Peterson, K. C., Gallagher, S. C., Hornschemeier, A. E., Muno, M. P., & Bullard, E. C. 2006, AJ, 131, 133
- (111) Rix, H., et al. 2004, ApJS, 152, 163
- Rubin et al. (2004) Rubin, K. H. R., van Dokkum, P. G., Coppi, P., Johnson, O., Förster Schreiber, N. M., Franx, M., & van der Werf, P. 2004, ApJ, 613, L5
- Sarazin (1997) Sarazin, C. L. 1997, ASP Conf. Ser. 116: The Nature of Elliptical Galaxies; 2nd Stromlo Symposium, 116, 375
- Sarazin et al. (2001) Sarazin, C. L., Irwin, J. A., & Bregman, J. N. 2001, ApJ, 556, 533
- Sarazin et al. (2003) Sarazin, C. L., Kundu, A., Irwin, J. A., Sivakoff, G. R., Blanton, E. L., & Randall, S. W. 2003, ApJ, 595, 743
- Scannapieco et al. (2005) Scannapieco, E., Silk, J., & Bouwens, R. 2005, ApJ, 635, L13
- Silverman et al. (2006) Silverman, J. D., et al. 2006, in preparation
- Sivakoff et al. (2004) Sivakoff, G. R., Sarazin, C. L., & Carlin, J. L. 2004, ApJ, 617, 262
- Spergel et al. (2003) Spergel, D. N., et al. 2003, ApJS, 148, 175
- Springel et al. (2006) Springel, V., Frenk, C. S., & White, S. D. M. 2006, Nature, 440, 1137
- Stark et al. (1992) Stark, A. A., Gammie, C. F., Wilson, R. W., Bally, J., Linke, R. A., Heiles, C., & Hurwitz, M. 1992, ApJS, 79, 77
- Swinbank et al. (2006) Swinbank, A. M., et al. 2006, MNRAS, in-press (astro-ph/0606372)
- Szokoly et al. (2004) Szokoly, G. P., et al. 2004, ApJS, 155, 271
- Tamura et al. (2003) Tamura, T., Kaastra, J. S., Makishima, K., & Takahashi, I. 2003, A&A, 399, 497
- Thomas et al. (2005) Thomas, D., Maraston, C., Bender, R., & Mendes de Oliveira, C. 2005, ApJ, 621, 673
- Treu et al. (2005) Treu, T., et al. 2005, ApJ, 633, 174
- Treu et al. (2006) Treu, T., Koopmans, L. V., Bolton, A. S., Burles, S., & Moustakas, L. A. 2006, ApJ, 640, 662
- Trinchieri & Fabbiano (1985) Trinchieri, G., & Fabbiano, G. 1985, ApJ, 296, 447
- Ueda et al. (2003) Ueda, Y., Akiyama, M., Ohta, K., & Miyaji, T. 2003, ApJ, 598, 886
- van der Wel et al. (2004) van der Wel, A., Franx, M., van Dokkum, P. G., & Rix, H.-W. 2004, ApJ, 601, L5
- van der Wel et al. (2005) van der Wel, A., Franx, M., van Dokkum, P. G., Rix, H.-W., Illingworth, G. D., & Rosati, P. 2005, ApJ, 631, 145
- van Dokkum et al. (2004) van Dokkum, P. G., et al. 2004, ApJ, 611, 703
- Vanzella et al. (2005) Vanzella, E., et al. 2005, A&A, 434, 53
- Vanzella et al. (2006) Vanzella, E., et al. 2006, A&A, 454, 423
- Verbunt & van den Heuvel (1995) Verbunt, F., & van den Heuvel, E. P. J. 1995, in Lewin, W., van Paradijs, J., & van den Heuvel, E., eds., X-ray Binaries (Cambridge: Cambridge University Press), p. 457
- White & Ghosh (1998) White, N. E., & Ghosh, P. 1998, ApJ, 504, L31
- White et al. (2002) White, R. E., Sarazin, C. L., & Kulkarni, S. R. 2002, ApJ, 571, L23
- (138) Wolf, C., et al. 2004, A&A, 421, 913
- Xu et al. (2002) Xu, H., et al. 2002, ApJ, 579, 600
- Xu et al. (2005) Xu, Y., Xu, H., Zhang, Z., Kundu, A., Wang, Y., & Wu, X.-P. 2005, ApJ, 631, 809
| Chandra | Flux ( ergs cm-2 s-1) | Hardness Ratio | ||||||||
|---|---|---|---|---|---|---|---|---|---|---|
| Name (J2000.0) | SB | HB | HB/SB | () | ( ergs s-1) | Survey | Notes | |||
| (1) | (2) | (3) | (4) | (5) | (6) | (7) | (8) | (9) | (10) | (11) |
| J033121.17275857.7 | 0.68 | 15.5 | 14.7 | 1.26 | 0.94 | 0.7 | 11.1 | 42.3 | E-CDF-S 03 | A |
| J033132.81280115.9 | 0.15 | 15.4 | 14.9 | 0.78 | 2.63 | 1.4 | 10.4 | 40.8 | E-CDF-S 03 | N |
| J033137.72273843.3 | 0.22 | 15.5 | 14.6 | 1.46 | 1.93 | 1.4 | 10.4 | 41.4 | E-CDF-S 02 | A |
| J033138.05280312.2 | 0.49 | 15.6 | 14.9 | 1 | 1.04 | 1.4 | 10.2 | 42.0 | E-CDF-S 03 | A |
| J033143.42274248.6 | 0.47 | 15.8 | 14.6 | 2.31 | 0.77 | 0.1 | 10.3 | 42.0 | E-CDF-S 02 | A |
| J033151.15275051.5 | 0.68 | 15.3 | 14.9 | 0.57 | 0.31 | 1.2 | 10.3 | 42.3 | CDF-S | A,R |
| J033156.00273942.4 | 0.58 | 15.2 | 14.9 | 0.51 | 1.11 | 1.5 | 10.8 | 42.1 | E-CDF-S 02 | A |
| J033158.13274459.4 | 0.58 | 15.3 | 14.8 | 0.66 | 0.83 | 1.4 | 10.6 | 42.2 | E-CDF-S 02 | A |
| J033200.42275228.6 | 0.63 | 15.9 | 15.6 | 0.54 | 1.13 | 1.4 | 10.4 | 41.5 | CDF-S | A |
| J033200.83275954.6 | 0.43 | 15.6 | 14.9 | 1.07 | 0.67 | 1.4 | 9.6 | 41.8 | E-CDF-S 03 | A |
| J033202.13275621.6 | 0.61 | 15.6 | 14.8 | 1.49 | 0.54 | 1.4 | 10.0 | 42.2 | E-CDF-S 03 | A |
| J033203.65274603.7 | 0.59 | 15.1 | 13.7 | 3.74 | 0.01 | 0.3 | 10.8 | 43.0 | E-CDF-S 02 | A |
| J033205.90275449.7 | 0.66 | 16.2 | 15.0 | 3.18 | 1.32 | 1.4 | 10.9 | 42.1 | E-CDF-S 03 | N,S |
| J033206.27274536.7 | 0.66 | 15.9 | 15.3 | 0.67 | 1.35 | 1.4 | 10.7 | 41.8 | CDF-S | N |
| J033209.52273634.1 | 0.23 | 15.8 | 14.9 | 1.85 | 1.99 | 1.4 | 10.2 | 41.2 | E-CDF-S 02 | N |
| J033214.36274455.8 | 0.57 | 15.5 | 14.9 | 1.07 | 0.46 | 1.4 | 9.8 | 42.1 | E-CDF-S 02 | A |
| J033217.06274921.9 | 0.34 | 16.3 | 15.3 | 1.46 | 1.95 | 0.4 | 10.4 | 41.1 | CDF-S | A |
| J033218.44274536.6 | 0.47 | 16.4 | 15.6 | 1.50 | 2.06 | 1.4 | 10.4 | 41.2 | CDF-S | N,S |
| J033218.45274555.9 | 0.69 | 16.2 | 15.4 | 1 | 1.66 | 1.4 | 10.6 | 41.8 | CDF-S | A,S |
| J033220.48274732.3 | 0.60 | 16.2 | 14.1 | 11.80 | 0.34 | 1.4 | 10.1 | 42.4 | CDF-S | A |
| J033221.99274655.9 | 0.64 | 16.3 | 15.5 | 1.33 | 1.56 | 1.4 | 10.6 | 41.6 | CDF-S | A |
| J033224.26274126.4 | 0.48 | 14.7 | 14.3 | 0.60 | 0.43 | 1.3 | 10.5 | 42.5 | E-CDF-S 02 | A |
| J033225.74274936.4 | 0.58 | 16.1 | 15.2 | 1.37 | 1.90 | 1.4 | 10.9 | 41.8 | CDF-S | N |
| J033228.81274355.6 | 0.22 | 15.2 | 15.1 | 0.29 | 2.05 | 1.9 | 10.5 | 41.1 | CDF-S | A,R |
| J033229.22274707.6 | 0.66 | 16.4 | 15.5 | 1.68 | 1.59 | 1.4 | 10.6 | 41.7 | CDF-S | N,S |
| J033232.96274545.7 | 0.33 | 15.1 | 14.7 | 0.56 | 1.19 | 1.4 | 10.2 | 41.8 | E-CDF-S 01 | N |
| J033233.46274312.8 | 0.12 | 15.7 | 15.0 | 0.90 | 2.74 | 0.9 | 10.3 | 40.4 | CDF-S | A |
| J033234.32280018.0 | 0.66 | 15.5 | 14.8 | 1 | 0.91 | 1.4 | 10.5 | 42.4 | E-CDF-S 01 | A,S |
| J033234.34274350.1 | 0.63 | 15.8 | 15.2 | 0.72 | 0.90 | 1.0 | 10.5 | 41.9 | CDF-S | A |
| J033237.31274729.4 | 0.64 | 16.4 | 15.9 | 0.73 | 2.01 | 1.4 | 10.9 | 41.2 | CDF-S | A,S |
| J033239.05273456.4 | 0.17 | 15.3 | 14.8 | 0.69 | 0.22 | 1.4 | 8.3 | 41.0 | E-CDF-S 01 | A |
| J033244.09274541.5 | 0.47 | 16.5 | 15.5 | 1.90 | 2.18 | 1.4 | 10.7 | 41.3 | CDF-S | N,S |
| J033246.94273902.8 | 0.17 | 15.5 | 14.9 | 1.05 | 2.87 | 1.4 | 10.7 | 41.0 | E-CDF-S 01 | N |
| J033251.43280304.4 | 0.24 | 15.1 | 14.9 | 0.44 | 2.49 | 1.4 | 11.1 | 41.3 | E-CDF-S 04 | N |
| J033253.19273902.4 | 0.60 | 15.3 | 15.0 | 0.51 | 0.42 | 1.5 | 10.1 | 42.0 | E-CDF-S 01 | A |
| J033256.33274833.8 | 0.11 | 15.7 | 15.2 | 0.56 | 2.89 | 1.4 | 10.2 | 40.2 | CDF-S | N |
| J033257.13274534.3 | 0.12 | 15.5 | 15.0 | 0.86 | 2.54 | 1.4 | 10.0 | 40.5 | E-CDF-S 01 | N |
| J033258.69273738.3 | 0.56 | 15.6 | 15.3 | 0.45 | 1.50 | 1.4 | 10.8 | 41.7 | E-CDF-S 01 | A,S |
| J033259.68275030.3 | 0.26 | 15.0 | 14.8 | 0.39 | 1.31 | 1.4 | 10.1 | 41.5 | E-CDF-S 04 | N |
| J033306.85275448.7 | 0.57 | 16.0 | 15.3 | 1.24 | 1.50 | 1.4 | 10.8 | 41.7 | E-CDF-S 04 | N |
| J033311.55275721.6 | 0.16 | 15.8 | 15.4 | 0.65 | 1.31 | 1.4 | 9.0 | 40.4 | E-CDF-S 01 | A,R,S |
| J033312.63275231.7 | 0.64 | 15.7 | 14.2 | 4.15 | 0.09 | 1.4 | 10.4 | 42.5 | E-CDF-S 04 | A |
| J033312.88274219.8 | 0.69 | 15.8 | 14.6 | 2.60 | 0.50 | 1.4 | 10.5 | 42.2 | E-CDF-S 01 | A |
| J033319.58274950.8 | 0.65 | 14.9 | 13.9 | 1.57 | 0.46 | 0.5 | 10.3 | 43.0 | E-CDF-S 04 | A |
| J033320.60274910.3 | 0.14 | 14.6 | 14.8 | 0.19 | 2.52 | 1.4 | 10.8 | 40.9 | E-CDF-S 01 | N |
| J033320.85274755.3 | 0.14 | 14.4 | 14.9 | 0.11 | 2.46 | 1.4 | 10.9 | 40.8 | E-CDF-S 01 | N |
| J033324.22273455.6 | 0.51 | 14.9 | 14.5 | 0.66 | 0.12 | 1.3 | 10.1 | 42.4 | E-CDF-S 01 | A |
| J033326.39273521.8 | 0.16 | 15.6 | 14.4 | 2.40 | 2.02 | 1.4 | 10.4 | 41.3 | E-CDF-S 01 | A |
| J033328.86273731.4 | 0.36 | 15.5 | 14.9 | 1 | 1.97 | 1.4 | 10.5 | 41.7 | E-CDF-S 01 | A,S |
Note. — Col.(1): Chandra source name. Col.(2): Source redshift as determined by COMBO-17. Col.(3)–(4): Flux for the 0.5–2.0 keV and 2–8 keV bandpasses. Col.(5): Hardness ratio of the 2–8 keV and 0.5–2.0 keV count rates (). Col.(6): Logarithm of the 0.5–8.0 keV to -band flux ratio. Col.(7): Effective photon index (). Here a value of 1.4 was assumed when photon statistics were too limited to determine accurate values. Col.(8): Logarithm of the rest-frame -band luminosity. Col.(9): Logarithm of the rest-frame 2–8 keV luminosity. Col.(10): Survey field in which each source was identified. For E-CDF-S identifications, the associated field number (i.e., 01–04) indicates the Chandra pointing within which the source was detected (see Lehmer et al. 2005b for details). Col.(11): Source notes. Here an “N” denotes normal galaxies, an “A” denotes candidate AGNs, an “R” denotes sources with radio detections, and an “S” denotes sources that were detected in the supplementary catalogs (i.e., using wavdetect at a false-positive probability threshold of ).
| Net Counts () | Signal-to-Noise Ratio (S/N) | ||||||||
|---|---|---|---|---|---|---|---|---|---|
| (Ms) | 0.5–1.0 keV | 0.5–2.0 keV | 2–8 keV | 0.5–1.0 keV | 0.5–2.0 keV | 2–8 keV | |||
| (1) | (2) | (3) | (4) | (5) | (6) | (7) | (8) | (9) | (10) |
| General Sample; | |||||||||
| 0.25 0.08 | 45 | 5 | 15.0 | 30.5 7.4 | 94.5 11.9 | 27.0 | 9.8 | 19.7 | 0.9 |
| 0.47 0.03 | 52 | 2 | 20.4 | 15.6 6.6 | 31.4 9.1 | 32.4 | 4.1 | 5.5 | 2.1 |
| 0.58 0.02 | 51 | 2 | 18.2 | 12.9 6.2 | 33.5 9.0 | 31.2 | 3.6 | 6.2 | 2.2 |
| 0.66 0.02 | 74 | 3 | 30.0 | 16.6 7.3 | 40.7 10.6 | 34.4 13.4 | 3.5 | 5.7 | 3.2 |
| General Sample; | |||||||||
| 0.24 0.11 | 27 | 1 | 11.9 | 10.1 5.4 | 25.5 7.8 | 27.1 | 3.4 | 5.7 | 2.9 |
| 0.46 0.03 | 27 | 0 | 9.9 | 14.5 | 12.7 6.5 | 22.0 | 2.7 | 3.2 | 0.5 |
| Faded Sample; | |||||||||
| 0.25 0.08 | 41 | 4 | 14.1 | 26.3 7.0 | 75.3 10.9 | 26.2 | 8.7 | 16.2 | 1.0 |
| 0.47 0.03 | 44 | 2 | 16.5 | 17.0 | 25.4 8.3 | 30.0 | 2.9 | 4.9 | 2.3 |
| 0.58 0.02 | 30 | 2 | 9.5 | 12.5 5.5 | 28.0 7.6 | 21.9 8.8 | 4.9 | 7.2 | 3.6 |
| 0.66 0.02 | 55 | 3 | 20.5 | 17.6 6.7 | 42.2 9.8 | 33.5 | 4.6 | 7.3 | 2.9 |
| Faded Sample; | |||||||||
| 0.22 0.09 | 28 | 2 | 11.2 | 14.3 5.8 | 43.5 8.9 | 26.3 | 4.9 | 10.1 | 2.6 |
| 0.46 0.03 | 31 | 0 | 12.5 | 11.9 5.7 | 15.3 7.1 | 24.2 | 3.9 | 3.4 | 0.3 |
Note. — Col.(1): Mean redshift and standard deviation of the redshift for each stacked sample. Col.(2): Number of sources being stacked. Col.(3): Number of stacked sources that were detected individually in the X-ray bandpass. Col.(4): Total vignetting-corrected effective exposure time measured from the 0.5–2.0 keV exposure maps. Col.(5)–(7): Net 0.5–1.0 keV, 0.5–2.0 keV, and 2–8 keV source counts. Col.(8)–(10): S/N for the 0.5–1.0 keV, 0.5–2.0 keV, and 2–8 keV bandpasses.
| ( cgs) | ( cgs) | ( cgs) | ( ergs s-1) | ( ergs s-1) | ( ergs s-1) | ( ) | ( ergs s-1 -1) | ||
|---|---|---|---|---|---|---|---|---|---|
| (1) | (2) | (3) | (4) | (5) | (6) | (7) | (8) | (9) | (10) |
| General Sample; | |||||||||
| 0.25 0.08 | 16.5 0.6 | 16.2 0.2 | 16.0 | 3.00 | 39.7 0.6 | 40.2 0.2 | 40.4 | 10.5 | 29.7 0.1 |
| 0.47 0.03 | 16.9 0.7 | 16.8 0.4 | 16.1 | 2.63 | 39.9 0.8 | 40.1 0.4 | 40.8 | 10.4 | 29.7 0.1 |
| 0.58 0.02 | 17.0 0.8 | 16.8 0.3 | 16.1 | 2.29 | 40.1 0.8 | 40.4 0.4 | 41.1 | 10.5 | 29.9 0.1 |
| 0.66 0.02 | 17.1 0.8 | 16.9 0.3 | 16.4 0.5 | 2.21 | 40.1 0.8 | 40.4 0.4 | 40.8 0.6 | 10.6 | 29.9 0.1 |
| General Sample; | |||||||||
| 0.24 0.11 | 17.1 0.9 | 16.7 0.4 | 15.9 | 2.70 | 39.4 0.9 | 39.6 0.4 | 40.5 | 9.8 | 29.9 0.2 |
| 0.46 0.03 | 16.8 | 17.0 0.7 | 16.0 | 1.79 | 40.5 | 40.0 0.7 | 41.0 | 9.6 | 30.4 0.2 |
| Faded Sample; | |||||||||
| 0.25 0.08 | 16.5 0.6 | 16.3 0.2 | 16.0 | 3.08 | 39.7 0.6 | 40.1 0.2 | 40.4 | 10.4 | 29.7 0.1 |
| 0.47 0.03 | 16.6 | 16.8 0.4 | 16.1 | 2.67 | 40.2 | 40.1 0.4 | 40.9 | 10.4 | 29.8 0.2 |
| 0.58 0.02 | 16.7 0.7 | 16.5 0.3 | 16.1 0.5 | 2.21 | 40.3 0.8 | 40.6 0.4 | 41.0 0.6 | 10.5 | 30.2 0.1 |
| 0.66 0.02 | 16.9 0.7 | 16.7 0.3 | 16.1 | 2.22 | 40.3 0.7 | 40.6 0.4 | 41.2 | 10.5 | 30.1 0.1 |
| Faded Sample; | |||||||||
| 0.22 0.09 | 17.0 0.7 | 16.4 0.3 | 15.9 | 2.71 | 39.5 0.7 | 39.8 0.3 | 40.4 | 9.8 | 30.0 0.1 |
| 0.46 0.03 | 17.1 0.8 | 17.0 0.6 | 16.0 | 1.96 | 40.1 0.8 | 40.0 0.6 | 40.9 | 9.8 | 30.2 0.2 |
Note. — Col.(1): Mean redshift and standard deviation of the redshift for each stacked sample. Col.(2)–(4): Logarithm of the mean 0.5–1.0 keV, 0.5–2.0 keV, and 2–8 keV flux in units of ergs cm-2 s-1. Col.(5): Logarithm of the 0.5–8.0 keV to -band flux ratio. Col.(6)–(8): Logarithm of the mean 0.5–1.0 keV, 0.5–2.0 keV, and 2–8 keV rest-frame luminosity. Col.(9): Logarithm of the mean rest-frame -band luminosity. Col.(10): Logarithm of the 0.5–2.0 keV–to–-band mean luminosity ratio.