The Density and Spectral Energy Distributions of Red Galaxies at
Abstract
We use the deep NIR imaging of the FIRES survey to investigate trends with redshift of the properties of galaxies selected to have strong Balmer/4000 Å breaks at . Analagous to the (AB) color criterion designed to select red galaxies at , we propose two color criteria, and , to select red galaxies in two redshift bins at and , respectively. From the FIRES catalogs of the HDF-S (4.7 arcmin2) and MS 1054-03 (26.3 arcmin2) fields, we find 18 galaxies with that satisfy and 23 galaxies with that satisfy , where the flux limits are chosen to match the limiting rest-frame luminosities at the different median redshifts of the two samples. The space densities of the and samples are and , respectively. The rest-frame colors of galaxies in both samples are similarly red (as expected from the definition of the color criteria), but the rest-frame UV properties are different: galaxies in the higher-redshift selected sample have blue NUV-optical colors and UV slopes similar to those of Lyman Break Galaxies, while the galaxies are generally red over the entire wavelength range observed. Synthetic template fits indicate that the distinct rest-NUV properties of the two samples are primarily a result of dust: we find mag and mag. The median stellar mass determined from the template fits decreases by a factor of from to , which, coupled with the fact that the space density of such galaxies remains roughly constant, may imply that the stellar mass density in red galaxies decreases by a similar factor over this redshift range.
Subject headings:
cosmology: observations — galaxies: evolution — galaxies: formation1. Introduction
Over the last few years, the study of galaxies with red rest-frame optical colors has been extended to ever-increasing redshifts. While the selection of galaxies based on their rest-frame UV emission (e.g. the Lyman break technique; Steidel & Hamilton, 1993) has enabled the detailed study of young galaxies at high redshift for some time, it is only with the more recent advent of efficient, large-scale detectors in the near-IR that large numbers of galaxies with redder rest-frame colors have been discovered at early cosmic epochs (Franx et al., 2003; van Dokkum et al., 2003). Red galaxies with typically very low UV fluxes make up 80% of the mass contained in the most massive galaxies (van Dokkum et al., 2006) and 25-75% of the total mass in galaxies at (Papovich et al., 2006; Marchesini et al., 2006), and thus provide critical constraints on theoretical models of galaxy formation and evolution (Somerville et al., 2004; Nagamine et al., 2005).
A proven technique for selecting galaxies with red rest-frame optical colors is the criterion (; Franx et al., 2003), which relies on the Balmer/4000 Å break redshifted into the band for redshifts . Galaxies selected using this technique comprise a heterogeneous population showing a broad range in dust properties, luminosity-weighted ages, and star-formation rates (Förster-Schreiber et al., 2004; Labbé et al., 2005; Papovich et al., 2006; Kriek et al., 2006b).
In this Letter, we extend the study of red galaxies to redshifts , and we compare the number and properties of red galaxies at to those at using uniform color selection criteria based on the Balmer/4000 Å break redshifted into the and bands, respectively. While there is typically a tail of sources extending beyond in selected samples (e.g. Förster-Schreiber et al., 2004), there have been no systematic studies comparing the numbers and properties of red galaxies at the extremes of the broad redshift selection window. We adopt km/s, , and . All magnitudes are given in the AB system.
2. Color Selection of Red Galaxies
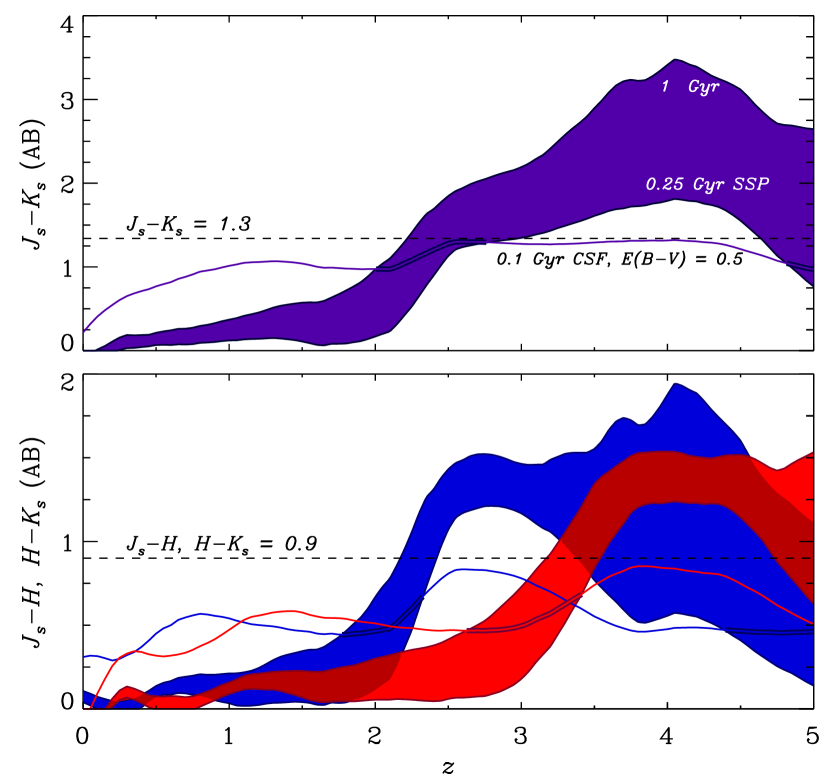
The top panel of Fig. 1 shows the observed color of Bruzual & Charlot (2003) template spectra over . At a given redshift, is reddest for the oldest template because the strength of the Balmer/4000 Å break increases as a stellar population ages. Based on the figure, should select galaxies at that are either dominated by an evolved stellar population or are highly reddened by dust—the so-called “distant red galaxies”, or DRGs (Franx et al., 2003). A number of DRGs have been spectroscopically confirmed (van Dokkum et al., 2003; Kriek et al., 2006a, b) at , and large photometric samples of DRGs are found to have (Förster-Schreiber et al., 2004; Papovich et al., 2006; Quadri et al., 2006).
Because DRGs have a fairly broad redshift distribution, the rest-frame properties of galaxies satisfying the color criterion to a given magnitude limit in a particular selection band change with redshift in three important ways. First, the limiting absolute magnitude in the selection band becomes brighter with increasing redshift for a fixed survey depth, probing sharply decreasing source densities at the bright end of the steep luminosity function. Second, the rest wavelength of the selection band decreases with increasing redshift, probing wavelengths where the scatter in is large. Finally, the rest-frame color—essentially the type of galaxy selected—changes with redshift because the Balmer/4000 Å break is narrow in wavelength compared to the spacing between the and filters and because the spectral slope is not the same on both sides of the break for galaxies older than Myr. Together, these effects make it very difficult to compare DRG properties at different redshifts.
The bottom panel of Fig. 1 demonstrates how splitting the criterion into two should divide DRGs into two redshift bins,
| (1) |
mitigating the problems described above that prevent direct analysis of the variation of red galaxy properties with redshift. The wavelength baselines of the two NIR colors are similar enough that the same color limit can be used for both criteria to select identical rest-frame powerlaw spectral slopes. The criteria of Equation 1 are adopted analagous to to select against low- interlopers, while the selection efficiency of the and criteria may be further enhanced by the fact that those colors are steeper functions of redshift at the low- selection boundaries than .
Alternatively, one could select samples of galaxies based on their rest-frame properties estimated using distances determined from the galaxies’ photometric redshifts. We note, however, that the – calibration is poorly determined at , and therefore relying on photometric redshifts alone introduces large uncertainties in the analysis at high redshift. Furthermore, by working in the observed frame, the results can be easily verified by others independent of photometric redshift or analysis techniques.
3. Data
We use the deep optical+NIR photometry of the FIRES survey (Franx et al., 2000) to select red galaxies at based on the two NIR color criteria described above. Details of the data reduction and -selected source catalogs of the two fields of the survey, HDF-S (4.7 arcmin2) and MS 1054-03 (26.3 arcmin2), can be found in Labbé et al. (2003) and Förster Schreiber et al. (2006), respectively. Briefly, the combined catalog of the two fields contains HST (HDFS-S), (both fields), ground-based (MS 1054-03) and ISAAC- (both fields) photometry, along with photometric redshifts determined following the procedure described by Rudnick et al. (2001, 2003). Details of the accuracy of the photometric redshifts in these fields are given in Labbé et al. (2003) and Förster Schreiber et al. (2006). The combined catalog depth is limited by the shallower MS 1054-03 observations. At , the combined catalog is complete and sources in the MS 1054-03 catalog have . The FIRES dataset provides a unique opportunity to select red galaxies at —even the brightest of which should still be quite faint in —since there are no other currently available surveys of comparable depth in all three NIR filters.
4. Densities
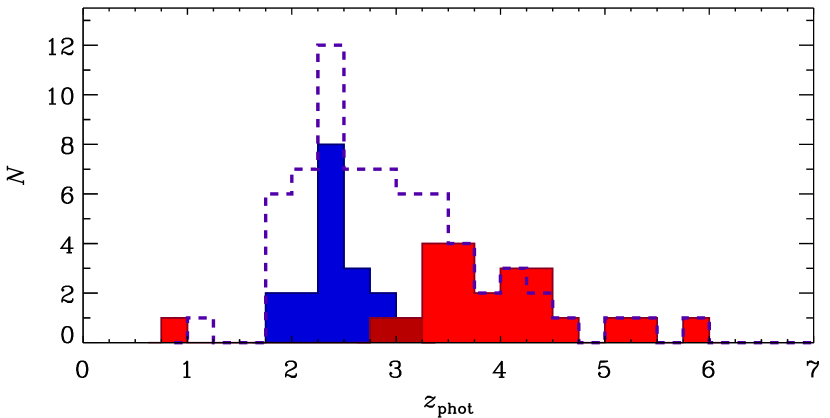
From the combined FIRES catalog we find 18 sources that satisfy and 23 sources with . The limiting magnitude in was chosen such that the rest-frame limiting magnitude redward of the Balmer/4000 Å break is the same for both samples, and its value was determined based on the ratio of the luminosity distances at the median redshifts of the two samples. The number of selected sources correspond to combined (HDF-S-only) surface densities and Poisson errors of and arcmin-2 for the and selected samples, respectively. The photometric redshift distributions of the NIR selected sources are shown in Fig. 2. The sample has (1- range) and 16/18 galaxies also satisfy . For the sample, and 15/23 galaxies satisfy .
If we consider comoving volumes bounded by tophat redshift distributions of and , the area-weighted space densities and associated Poisson errors of the and samples are and , respectively. Therefore, the space density of a flux-limited sample of red galaxies remains constant within the errors from to . We note that the total survey area discussed here is relatively small and that our result is likely subject to cosmic variance, especially in light of recent studies that show that red galaxies at are strongly clustered (Daddi et al., 2003; Quadri et al., 2006).
5. Rest Frame SEDs
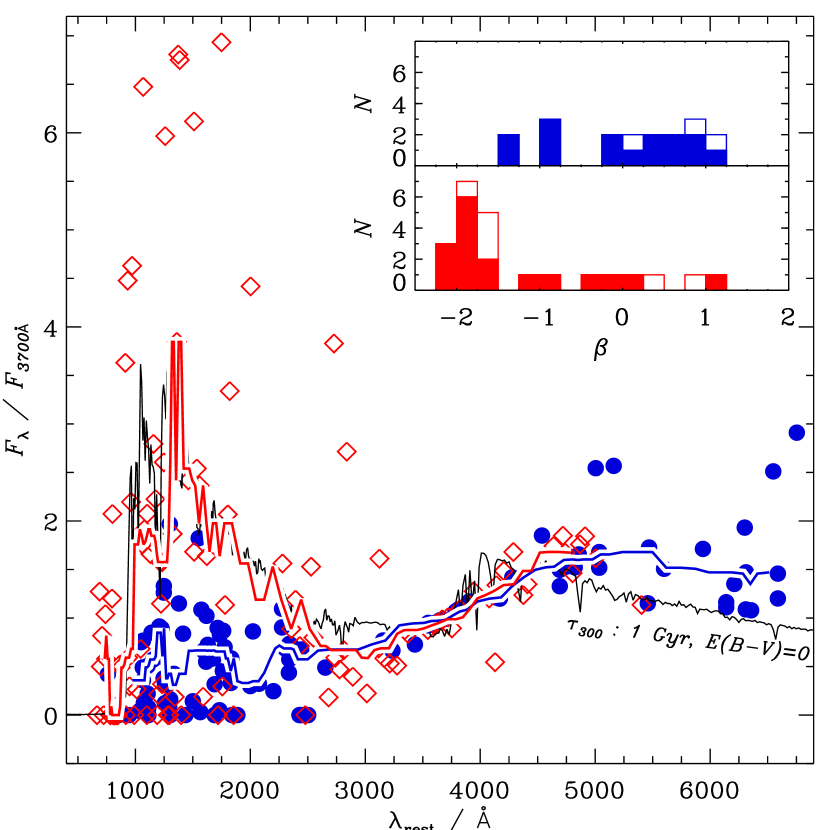
Athough there is no appreciable change in the number of galaxies selected to have strong Balmer/4000 Å breaks from to , their properties are quite different. Fig. 3 shows the spectral energy distributions (SEDs) of the two galaxy samples shifted to the rest-frame. The galaxies typically have red rest-frame UV-optical colors and a fairly flat rest-UV spectrum, consistent with previous studies of DRGs in the redshift range (Förster-Schreiber et al., 2004). In contrast, the higher-redshift galaxies generally have blue UV-optical colors. The spectral slopes of the two samples through the Balmer/4000 Å break are similar for the two samples, confirming that the NIR color criteria proposed here select galaxies with similar colors over .
We quantify the spectral shapes of the SEDs using the rest-frame UV power-law slope, (Calzetti et al., 1994), measured from a best-fit Bruzual & Charlot (2003) template with an exponentially decaying star formation rate ( Myr) and solar metallicity. The template fits to the broadband photometry hold the redshift fixed to the catalog values, allow ages between 0.1 Myr and the age of the universe at and allow mag following the extinction law of Calzetti et al. (2000). Corrections for Ly forest absorption are applied following Madau (1995). The distributions of for the two galaxy samples are shown in Fig. 3. The distribution is quite flat for the sample—similar to the distribution seen for a large sample of massive DRGs by van Dokkum et al. (2006). In contrast, the distribution of for the sample shows a peak at , values similar to those found by Adelberger & Steidel (2000) for UV-selected galaxies and to the sample of massive Lyman break galaxies (LBGs) discussed by van Dokkum et al. (2006).
Of the 12 galaxies in the sample that have in the range or , 10 have synthetic colors integrated from the best-fit templates that satisfy the or dropout LBG color criteria at those redshifts proposed by Steidel et al. (1999). However, 8 of those 10 galaxies with LBG colors have , too faint to be included in typical spectroscopic samples of LBGs.
6. Discussion
We have shown that we can efficiently select galaxies in the near-IR with the simple color criterion . The samples described here indicate that the rest-frame UV-optical SEDs of galaxies selected to have strong Balmer/4000 Å breaks are significantly different at and : galaxies in the higher redshift sample have a median NUV/optical flux ratio times greater than that of the galaxies at . Finding evolution in the properties of galaxies over the Gyr between , which at the distant end is only 1.7 Gyr after the Big Bang, is in itself not surprising, as the spectral evolution is rapid at these redshifts for galaxies with a broad range of formation redshifts and subsequent star formation histories. What is interesting is that the galaxies in both samples were selected to have similarly strong Balmer/4000 Å breaks, indicating the presence of an evolved stellar population that itself would not be a likely source for the strong NUV component of the SEDs. A two-burst model whose optical SED is dominated by an evolved stellar population but that also contains a young component that supplies the UV flux could explain the SEDs. Though two-component model fits are beyond the scope of this Letter, there have been other observations of red galaxies at high- suggesting that composite populations are appropriate, both from SED modelling (Yan et al., 2004) and from observations of distinct UV and optical galaxy morphologies (Toft et al., 2005) of such galaxies.
Our template fits suggest that dust is the primary source of the difference in spectral shape shown in Fig.3. Both samples have a median template age of Gyr, while the median dust extinction decreases from to 0.2 mag going from the to the sample. In general one expects the dust content of galaxies, along with the metal content, to increase with time, qualitatively consistent with the analysis presented here. It is difficult to quantitatively compare our results to theoretical models of galaxy formation since such models typically rely on ad hoc treatments of dust absorption (e.g. Croton et al., 2006). Interestingly, our results may be qualitatively consistent with the redshift distribution of submillimeter-selected galaxies. Although still quite uncertain, there is evidence that the number of very dusty, luminous galaxies drops significantly from to (Chapman et al., 2005).
The normalization of our population synthesis fits provides a rough estimate of the stellar mass of each galaxy in the sample. With our photometry sampling only the rest-frame UV-optical light of the galaxies in our sample at , the stellar mass fits are uncertain to factors of due to uncertainties in and in the IMF and to model degeneracies between age, dust, metallicity, and star formation history. With those caveats in mind, our template fits imply that the median stellar mass of red galaxies decreases by a factor of from to . While the uncertainties are large for the masses of individual galaxies, a Mann-Whitney test on the distribution of masses suggests that the difference in the median masses of the two samples is significant at the 99% confidence level. Erb et al. (2006) observe a similar trend in the mass of LBGs: the average dynamical and stellar masses of LBGs are a factor of 2 smaller than for LBGs at . We note here that the galaxies are not necessarily direct progenitors of the galaxies, just as LBGs at are not necessarily progenitors of LBGs at . Many of the galaxies could fade below our magnitude limit after Gyr; conversely, many of the galaxies could have been much bluer 1 Gyr previously.
Since the space densities of the and samples are statistically equivalent, a decrease in the median stellar mass in the higher redshift sample, if real, would indicate a decrease in the stellar mass density of galaxies with evolved stellar populations. This may be consistent with the results of Kriek et al. (2006b), who find that the ages of apparently passive galaxies at (which make up 45% of their -selected sample) are typically Gyr. It seems unlikely that many of the progenitors of these galaxies were already “red and dead”. On the other hand, this result may be difficult to reconcile with the existence of a significant population of galaxies at , as may be implied by the source described by Mobasher et al. (2005). Furthermore, the best fit Bruzual & Charlot (2003) template of the Mobasher et al. (2005) source has and would be an outlier even at compared to the sources in our sample.
Clearly, much further work is required to fully understand how the properties of red galaxies change with time at . The differences shown in Fig. 3 are model independent, to the extent that the photometric redshifts approximate the true redshifts, but the results above based on template fits are quite uncertain. The addition of photometry would better constrain the stellar mass contained in these galaxies (Wuyts et al., 2006). The brightest galaxies in the sample may be within reach of NIR spectroscopy that could precisely determine redshifts and model stellar populations based on the prominent Balmer/4000 Å breaks, as has been done quite effectively for DRGs at (Kriek et al., 2006a). Finally we note that the UKIDSS Ultra Deep Survey is planned to be 0.2 mag deeper than our adopted limit over an area times that of FIRES, which would vastly increase the sample sizes of galaxies selected as described here.
References
- Adelberger & Steidel (2000) Adelberger, K. L., & Steidel, C. C. 2000, ApJ, 544, 218
- Bruzual & Charlot (2003) Bruzual, G. & Charlot, S. 2003, MNRAS, 344, 1000
- Calzetti et al. (1994) Calzetti, D., Kinney, A. L., & Storchi-Bergmann, T. 1994, ApJ, 429, 582
- Calzetti et al. (2000) Calzetti, D., Armus, L., Bohlin, R. C., Kinney, A. L., Koornneef, J., & Storchi-Bergmann, T. 2000, ApJ, 533, 682
- Chapman et al. (2005) Chapman, S. C., Blain, A. W., Smail, I., & Ivison, R. J. 2005, ApJ, 622, 772
- Croton et al. (2006) Croton, D. J., et al. 2006, MNRAS, 365, 11
- Daddi et al. (2003) Daddi, E., et al. 2003, ApJ, 588, 50
- Erb et al. (2006) Erb, D. K., Steidel, C. C., Shapley, A. E., Pettini, M., Reddy, N. A., & Adelberger, K. L. 2006, ApJ, 646, 107
- Förster-Schreiber et al. (2004) Förster-Shreiber, N. M., et al. 2004, ApJ, 616, 40
- Förster Schreiber et al. (2006) Förster Shreiber, N. M., et al. 2006, AJ, 131, 1891
- Franx et al. (2000) Franx, M., et al. 2000, The Messenger, 99, 20
- Franx et al. (2003) Franx, M., et al. 2003, ApJ, 587, L79
- Kriek et al. (2006a) Kriek, M., et al. 2006, ApJ, 645, 44
- Kriek et al. (2006b) Kriek, M., et al. 2006, ApJ, 649, L71
- Labbé et al. (2003) Labbé, I., et al. 2003, AJ, 125, 1107
- Labbé et al. (2005) Labbé, I., et al. 2005, ApJ, 624, L81
- Madau (1995) Madau, P. 1995, ApJ, 441, 18
- Marchesini et al. (2006) Marchesini, D., et al. 2006, ApJ, submitted (astro-ph/0610484)
- Mobasher et al. (2005) Mobasher, B., et al. 2005, ApJ, 635, 832
- Nagamine et al. (2005) Nagamine, K., Cen, R., Hernquist, L., Ostriker, J. P. & Springel, V. 2005, ApJ, 618, 23
- Papovich et al. (2006) Papovich, C., et al. 2006, ApJ, 640, 92
- Quadri et al. (2006) Quadri, R., et al. 2006, ApJ, submitted (astro-ph/0606330)
- Rudnick et al. (2001) Rudnick, G. et al. 2001, AJ, 122, 2205
- Rudnick et al. (2003) Rudnick, G. et al. 2003, ApJ, 599, 847
- Somerville et al. (2004) Somerville, R. S. et al. 2004, ApJ, 600, L135
- Steidel & Hamilton (1993) Steidel, C. C. & Hamilton, D. 1993, AJ, 105, 2017
- Steidel et al. (1999) Steidel, C. C., Adelberger, K. L., Giavalisco, M., Dickinson, M. & Pettini, M. 1999, ApJ,519,1
- Steidel et al. (2004) Steidel, C. C., Shapley, A. E., Pettini, M., Adelberger, K. L., Erb, D. K., Reddy, N. A., & Hunt, M. P. 2004, ApJ, 604, 534
- Toft et al. (2005) Toft, S., van Dokkum, P., Franx, M., Thompson, R. I., Illingworth, G. D., Bouwens, R. J., & Kriek, M. 2005, ApJ, 624, L9
- van Dokkum et al. (2003) van Dokkum, P. G., et al. 2003, ApJ, 587, L83
- van Dokkum et al. (2006) van Dokkum, P. G., et al. 2006, ApJ, 638, L59
- Wuyts et al. (2006) Wuyts, S., et al. 2006, ApJ, in press (astro-ph/0609548)
- Yan et al. (2004) Yan, H., et al. 2004, ApJ, 616, 63