Radiative transfer effects on Doppler measurements as sources of surface effects in sunspot seismology
Abstract
We show that the use of Doppler shifts of Zeeman sensitive spectral lines to observe waves in sunspots is subject to measurement specific phase shifts arising from, (i) altered height range of spectral line formation and the propagating character of p mode waves in penumbrae, and (ii) Zeeman broadening and splitting. We also show that these phase shifts depend on wave frequencies, strengths and line of sight inclination of magnetic field, and the polarization state used for Doppler measurements. We discuss how these phase shifts could contribute to local helioseismic measurements of ’surface effects’ in sunspot seismology.
1 Introduction
The solar oscillations are measured with better signal-to-noise from Doppler shifts of a spectral line than intensity fluctuations. Existence of reliable algorithms to estimate Doppler shifts from line intensities (filtergrams) scanned over a few locations across a line (MDI; Scherrer et al. (1995)), or a fast Fourier tachometric scanning of a line (GONG; Harvey et al. (1994)), makes possible deriving velocity images of solar surface frequent enough to study the solar oscillations. Above methods of estimating line of sight velocities from Doppler shifts assume rigid displacements of a spectral line in wavelength in response to material motions. However, gradients along line of sight in solar velocity and other physical quantities introduce asymmetries in line profile leading to Doppler cross-talk of signals from different layers in the atmosphere. In quiet Sun, the five minute band p mode oscillation signals are evanescent at observation heights and hence oscillation phases are only minimally affected by height gradients. In active regions, not only the vastly different thermal and magnetic structure complicate Doppler shift measurements through changes in line profile shapes but also altered character of waves in line forming layers.
In this Letter, using a temporal sequence of spectropolarimetric observations of a sunspot we demonstrate: (i) propagating character of p modes in the penumbra and extended height range of spectral line formation cause phases of waves to depend strongly on intensity level within a line from where Doppler velocities are measured, (ii) sampling Zeeman split portions near the line core causes filtergraph (MDI/SOHO) or bisector methods for Doppler velocity estimation to introduce spurious phase shifts in the waves measured. Wave propagation signatures, in the first case above, which have recently been studied in chromospheric lines (Finsterle et al., 2004), are also shown to differ in the Doppler shifts of Stokes I and polarized components (circular and linear). We discuss how the above findings are related to recent local helioseismic measurements of ’surface effects’ (Schunker et al., 2005; Zhao et al., 2006).
2 Data and Analysis Methods
The observations were carried out using the Advanced Stokes Polarimeter (ASP) at the Dunn Solar Telescope of the National Solar Observatory at Sacramento Peak, Sunspot, New Mexico. A medium sized sunspot (NOAA AR0750, diameter 16 Mm) located close to disk center was observed on April 12, 2005, in mid-photospheric spectral line Ni i (=6768 Å, used by MDI/SOHO and GONG). We have made a temporal sequence of Stokes vectors of this line by scanning the sunspot over consecutive (in -direction) 14 slit positions oriented N-S (-direction) in one minute and repeating it for about 100 minutes (with a solar image tracker fixing the field of view). The N-S extent of slit covers about 64 Mm with a resolution of 0.375" with the spot at the center and, with a slit width of 0.6", the 14 slit positions (x-direction) cover mainly umbral region.
We do Milne-Eddington (M-E) inversions of Stokes vectors (’s) to obtain line of sight velocities , total magnetic field strengths , line of sight inclination and azimuth of magnetic field among other standard inverted quantities (Skumanich & Lites, 1987). The M-E inversion procedure is weighted towards polarized component within magnetic field and provides velocity estimates from the line core position which is used as a free parameter (Skumanich & Lites, 1987; Jefferies et al., 1989). Since we want to examine how wave phases change with height within line formation layers, how they are seen in polarized and unpolarized light, and how they contribute to local helioseismology measurements of ’surface magnetic effects’, we also obtain line of sight velocities from the following methods: (i) Doppler shifts of bisector points at different intensity levels within (Keil & Yackovich, 1981; Cavallini et al., 1985; Rimmele, 1995), and those within circular (average of and velocities, hereafter denoted CP) and linear (, denoted LP1) polarized components (Sankarasubramanian & Rimmele, 2002; del Toro Iniesta, 2003), and (ii) the two Doppler filtergram measurements in circular (CP) and linear (LP1) polarized components employed by MDI/SOHO (Scherrer et al., 1995).
Phase shifts between any two velocity signals, and , are calculated according to,
| (1) |
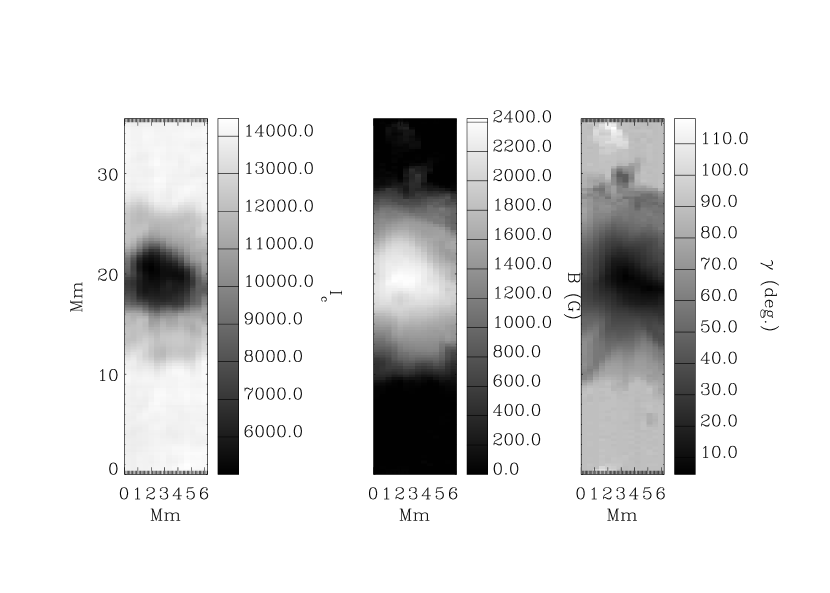
where and are the Fourier transforms of the two time series. In the above convention, positive values for at positive mean is advanced in phase with respect to . Our aim here is to study how between velocities from different bisector levels as well as that between different measurements vary over the sunspot as a function of position and , i.e. , due to propagating waves and altered line profile shapes (Zeeman splitting). The vertical co-ordinate represents height within line forming layers and we use intensity levels (i.e., bisector points) within the line to scan it. Based on the plane-parallel VAL-C model of quiet solar atmosphere, the Ni i line formation is reported to span a height range of 18 km (continuum) – 288 km (line core) (=0 being referenced to continuum optical depth =1) (Norton et al., 2006; Bruls, 1993). We do not attempt full Stokes profiles inversions to determine dependences of ; this is not only computationaly expensive (as we have too many profiles from the scans of Stokes vector) but also lead to noisier signals than those from direct bisector analyses. In quiet-Sun region the main p mode band acoustic waves (5.3 mHz, the acoustic cut-off frequency) are largely reflected down into the solar interior, and hence constant = 0; at , however, because of wave propagation, 0. Within the sunspot, we study and dependences of using temporal averages of M-E inverted and shown in Figure 1.
3 Surface magnetism effects due to propagating waves and Zeeman splitting
In order to analyse phase shifts due to the propagating nature of waves, we calculate bisector velocities from 9 equally spaced intensity levels within and CP profiles, =0.1, =0.2,…, =0.9, where is the continuum level. Using the time series of velocities from different bisector levels, we calculate phase shifts between them using Equation 1. When the line is Zeeman split, formation heights of bisector levels of profiles near the core are significantly altered and any asymmetries in depths of Zeeman components further corrupt the velocity signals. Bisector points of individual CP components are largely free of the above uncertainties. In view of the above, we use M-E inverted velocities as representative of the highest layer within line formation region, and we show that this is indeed the case by comparing them with CP bisector velocities from near the core for the Ni i line.
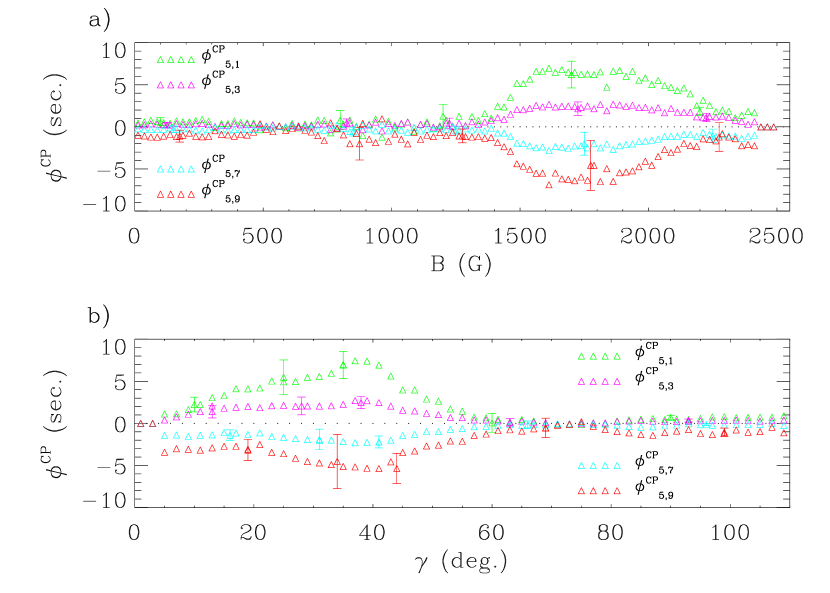
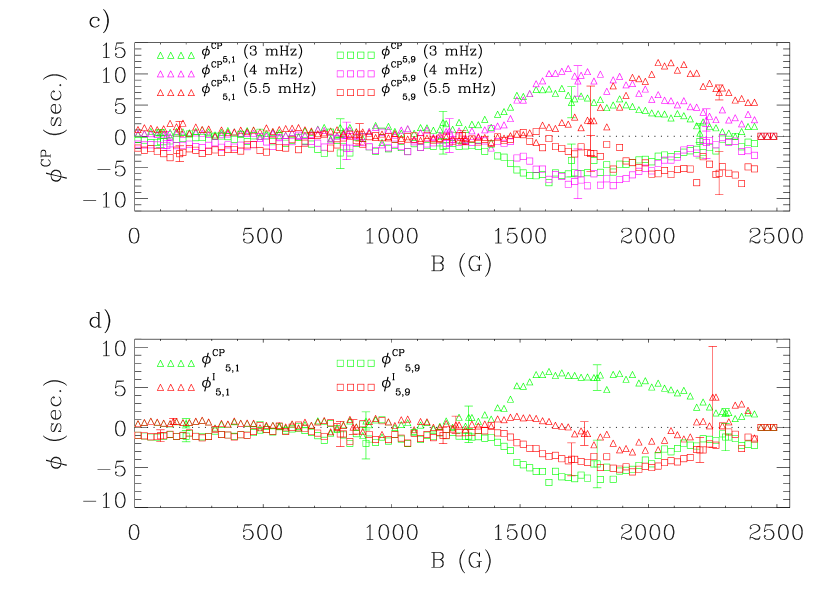
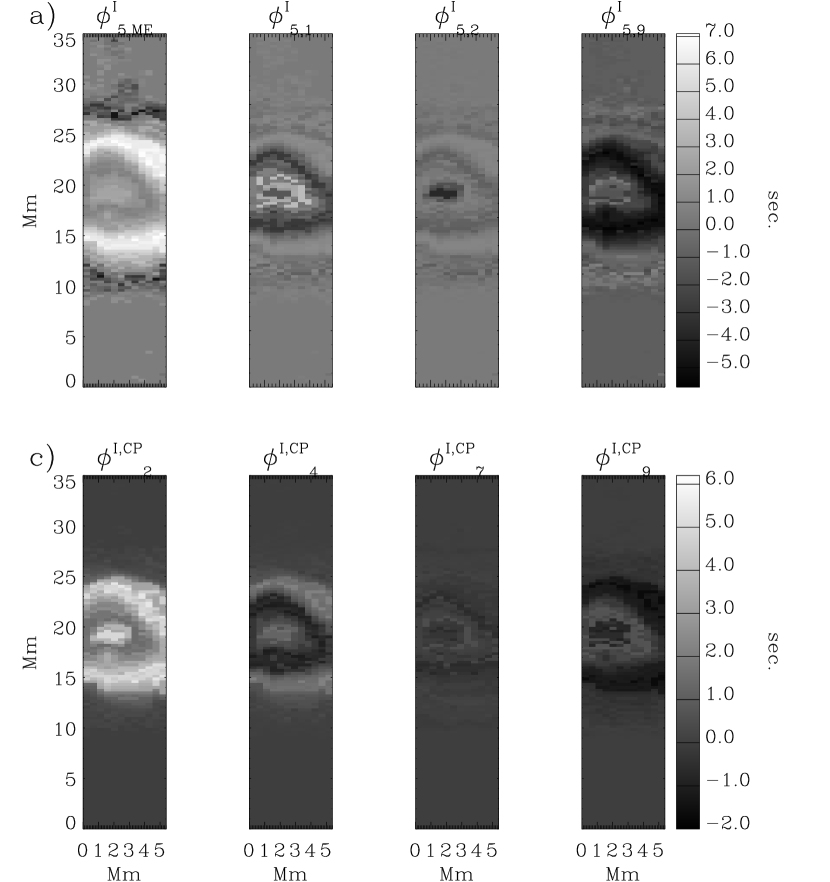
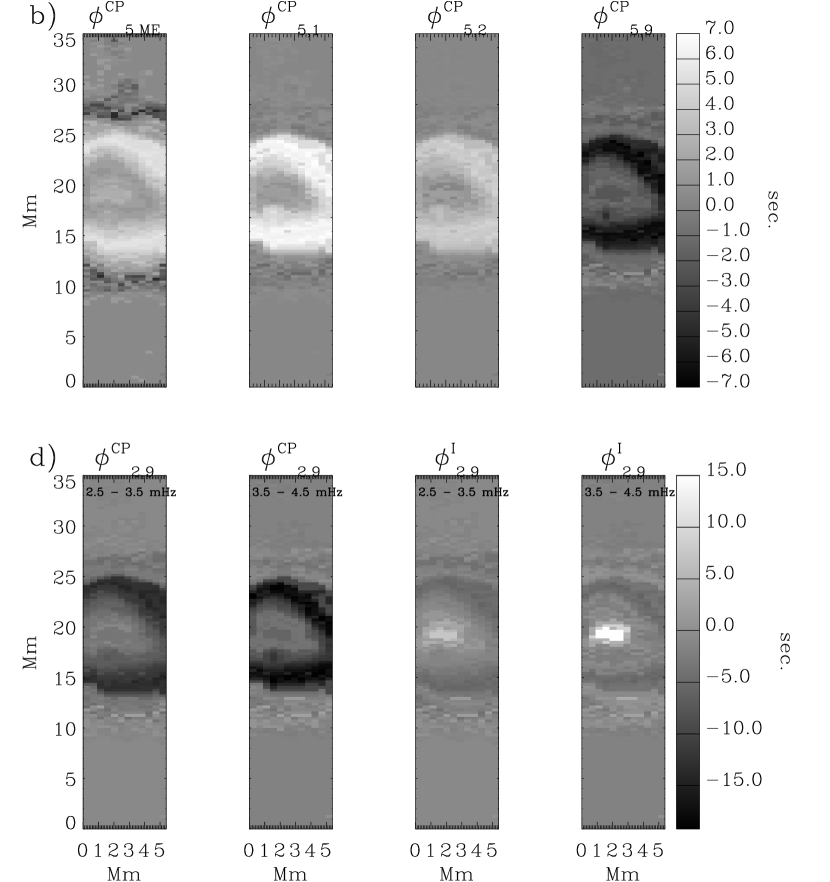
The phase shifts exhibit random fluctuations over space as well as in due to the inherent stochastic nature of the solar velocity field and due to noise from various sources. Fluctuations over are reduced by taking median values of over the p mode band (2 - 5 mHz) or over bands of 1 mHz width centered at 3, 4 and 5 mHz (to study any frequency dependence). Signals over space are studied using the temporal averages and (Figure 1): we average the phase shifts over all pixels that fall within a 25 G window of or 2∘ of and assign the average to all those pixels (spatially) and to the central values of and . The resulting spatial maps of are essentially one dimensional functions of or with any azimuthal variations due to such variations in or averaged out. In Figure 2, we plot between mid-level () bisector velocities and those from other levels: panels and show median (i=1,3,7,9) (superscripts identify the profiles used and subscripts the pair of levels that the phase shifts come from) over the full p mode band as a function of and , respectively, panel shows and as a function of for different frequency bands, and panel compares and between levels (5,1) and (5,9) as a function of for the full p mode band. For clarity, we have plotted error bars only at representative values of or . The error bars correspond to standard deviations of over the pixels that fall within the bin sizes of or . The spatial maps that are obtained after binning over 25 G windows in line of sight magnetic field are shown in Figure 3: in panels and , respectively, are and , where M-E,1,2 and 9, in panel are that are between same level bisector velocities from CP and profiles, and in panel are and in the 2.5 - 3.5 mHz and 3.5 - 4.5 mHz frequency bands. Changes in against or and the bisector intensity levels, in Figures 2 and 3, clearly show that these are due to propagating waves, even within the main p mode band, and that propagation is mainly confined to penumbral region. In quiet Sun pixels ( 200 G), due to wave propagation into higher layers at , though much smaller than that seen in the penumbra, is noticeable in panels and of Figure 2. Both Stokes and CP profiles’ velocities show propagating waves but the signals are larger in CP bisector velocities indicating that propagation is mostly in magnetized channels (panel of Figure 2 and panels and of Figure 3). Phase shifts between same level bisector velocities from and CP profiles, shown in panel of Figure 3, further substantiates the above inference. The from wing level (7 and 9, the right two panels in panel of Figure 3) bisector velocities are very small, suggesting that differences in formation heights of wings of and CP profiles is small.
The above results show that if we have to minimize contributions from propagating waves we should restrict Doppler measurements to wings. In panel of Figure 2 and panel of Figure 3, it is seen that the Stokes velocities introduce spurious advanced phases within the umbral and umbral - penumbral boundary region, when bisector velocities from near the core are involved: the fallen or collapsed plotted as red triangles in panel of Figure 2, and the scrambled phase signals seen in the middle two maps of panel in Figure 3. We attribute the above to changes in profile shapes due to Zeeman splitting, as these signals are not present or weak in CP measurements. We confirm this using the M-E inverted velocities, which model the Zeeman splitting and retrieve velocities; the left most map in panel of Figure 3 show that is free of the above discussed artifacts, and also matches well with map of in panel of Figure 3. The similar values and structure of and to that of further clarifies that wave propagation is confined to magnetized medium. Interestingly, the M-E velocities show negative changes for and in the outer penumbra (panels , of Figure 3), which we identify as a possible signature of downward propagating waves along field lines that return back to the photosphere.
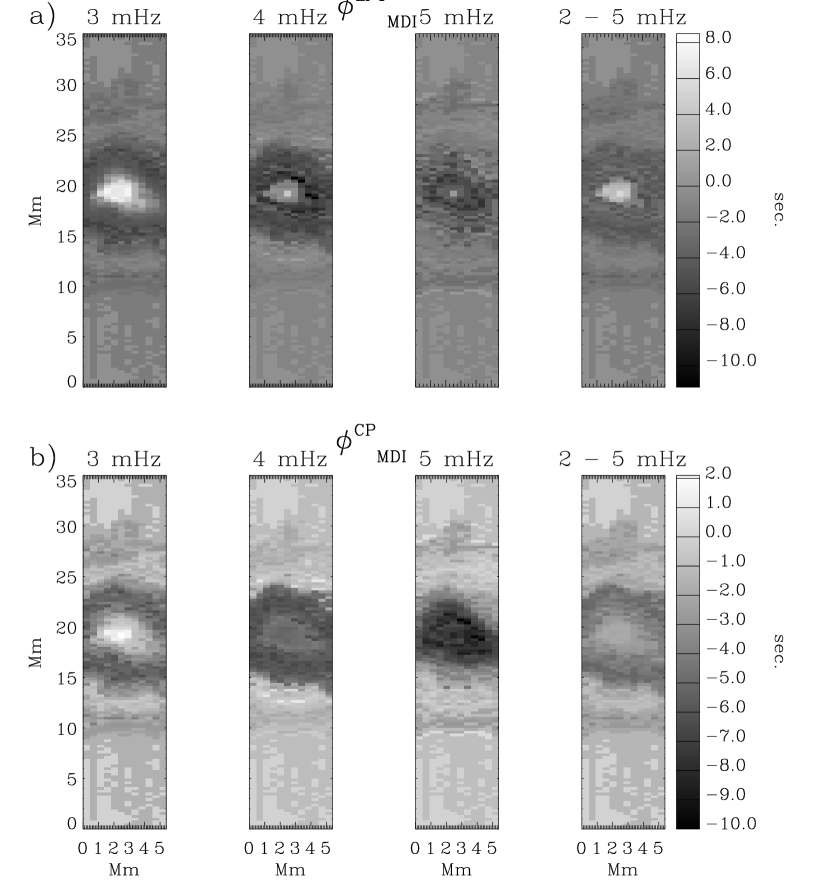
The MDI measurements (Scherrer et al., 1995) use CP and LP1 profiles: most full-disk observations are based on LP1 and almost all helioseismic holography results (Braun & Lindsey, 1999; Braun et al., 2004; Schunker et al., 2005; Lindsey & Braun, 2005a, b) on surface magnetism effects are based on these data; on the other hand, most time-distance helioseismology studies of sub-surface structure and flows (Kosovichev et al., 2000; Zhao et al., 2001) and the surface magnetism effects (Zhao et al., 2006) have used the MDI CP hi-res data. Here, we have derived Doppler velocities from both of these MDI measurements by executing the MDI algorithms (which the onboard processor of MDI uses). In quiet Sun, i.e. when there are no strong magnetic fields to modify the line profile through Zeeman effect, both of these MDI measurements reduce to deriving Doppler velocities from unpolarized Stokes and hence are the same. However, as demonstrated in Figures 2 and 3, propagating waves introduce phase shifts, and to estimate how much of these are present in MDI measurements we have calculated phase shifts between MDI CP and LP1 velocities and wing level (level 7) bisector velocities from , denoted respectively as and . The results are in Figure 4: panel shows and panel shows over bands of 1 mHz width centered at frequencies of 3, 4 and 5 mHz and also the full p mode band (2 - 5 mHz). We found from bisector velocities from near the core that Zeeman splitting causes an advancement of phases within umbra (panel and in Figure 3); since LP1 profile within umbra is the same as (because is close to zero), similar advanced phases are expected from MDI LP1 measurements. This is clear in panel of Figure 4. In summary, for the medium size spot observed, surface effects due to wave propagation in the penumbra cause a phase lag in the range of 5 - 10 seconds in both MDI LP1 and CP measurements and the Zeeman split profiles cause positive phase shifts of the order of 8 seconds in umbra in MDI LP1 measurements.
4 Discussions and conclusion
Recent studies in sunspot seismology (Schunker et al., 2005; Lindsey & Braun, 2005a, b; Zhao et al., 2006) have recognised the role of ’surface magnetic effects’ that contribute to seismically measured phases or travel times of acoustic waves. We have shown that phases of acoustic waves observed within sunspots using Doppler shifts of a spectral line have signatures of physical changes that waves undergo within line forming layers as well as of systematics in Doppler measurements induced by Zeeman split profiles. We have also shown that wave propagation effects and systematics from split portions of the line profiles are minimal when Doppler velocity measurements are restricted to wings of a spectral line. Since a seismologically correct determination of phase shifts require separating the above surface effects in the measurements, our latter results above show that such a correction can be carried out in the observation procedure itself: within sunspots, the Doppler shift measurements could be restricted to wings of spectral lines. In the case of MDI/SOHO, the onboard algorithm combines all the filtergrams to determine Doppler velocities. Since the filter positions are fixed with respect to the central wavelength, when the line is wider due to Zeeman splitting, there is a systematic sampling of split core region of the profiles and hence higher atmospheric layers. This causes phase lags in waves from penumbral region and spurious advanced phases within umbra when LP1 profile is used (most full-disk measurements). Correcting the MDI measurements for such surface effects, hence, requires maps such as the ones derived here (Figure 4). A detailed ’calibration’ of phase shifts due to surface effects against or require similar studies involving spots of various sizes.
We have not assessed how the surface effects studied here would depend on positions across the solar disk. However, the present finding that propagating waves in penumbra cause a phase shift depending on height of observation points to similar effects when there are line of sight changes in optical depth. Such changes are expected for sunspots located away from disk center, due to the Wilson depression, and this combined with the field line alligned wave propagation can introduce opposite changes, in measured phases, in the limb side (deeper level of observation) and center side (higher level of observation) penumbrae. We suggest that such effects on the phase shifts are a likely contributor to the azimuthally varying ’inclined magnetic field effect’ of Schunker et al. (2005) and Zhao et al. (2006). The magnitude of surface effect signal that we have, for the medium sized spot, falls in the range of 5 - 15 seconds (Figures 2, 3 and 4) and it points to larger phase shifts for larger spots. We note that, for fairly large sunspots, the magnitude of travel time perturbations measured in time-distance helioseismic measurements (Duvall et al., 1996; Kosovichev et al., 2000; Zhao et al., 2001), as well as the vantage dependent control correlation phases (Schunker et al., 2005), fall in the range of 30 - 60 seconds. Our results on surface effect signal due to Zeeman splitting in umbral region (Figures 3 and 4) call for a careful study of active regions in one or more magnetically insensitive photospheric lines.
References
- Braun & Lindsey (1999) Braun, D.C., & Lindsey, C. 1999, ApJ, 513, L79
- Braun et al. (2004) Braun, D.C., Lindsey, C., & Birch, A.C. 2004, BAAS, 204, 530
- Bruls (1993) Bruls, J.H.M.J. 1993, A&A, 269, 509
- Cavallini et al. (1985) Cavallini, F., Cepatelli, G., & Righini, A. 1985, A&A, 143, 116
- del Toro Iniesta (2003) del Toro Iniesta, J. C. 2003, Introduction to Spectropolarimetry, Cambridge Univ. Press, p.149-164, Cambridge
- Duvall et al. (1996) Duvall, T. L., Jr., D’Silva, S., Jefferies, S. M., Harvey, J. W., & Schou, J. 1996, Nature, 379, 235
- Finsterle et al. (2004) Finsterle, W., et al. 2004, Sol. Phys., 220, 317
- Harvey et al. (1994) Harvey, J., et al. 1988, in ESA proc. of ’Seismology of the Sun and sun-like stars’, p203
- Jefferies et al. (1989) Jefferies, J., Lites, B. W., & Skumanich, A. 1989, ApJ, 343, 920
- Keil & Yackovich (1981) Keil, S. L., & Yackovich, F. H. 1981, Sol. Phys., 69, 213
- Kosovichev et al. (2000) Kosovichev, A.G., Duvall, T.L., Jr., Scherrer, P.H. 2000, Sol. Phys., 192, 159
- Lindsey & Braun (2005a) Lindsey, C., & Braun, D.C. 2005a, ApJ, 620, 1107
- Lindsey & Braun (2005b) Lindsey, C., & Braun, D.C. 2005b, ApJ, 620, 1118
- Norton et al. (2006) Norton, A.A. et al. 2006, arXiv:astro-ph 0608124
- Rimmele (1995) Rimmele, T. 1995, A&A, 298, 260
- Sankarasubramanian & Rimmele (2002) Sankarasubramanian, K. & Rimmele, T. 2002, ApJ, 576, 1048
- Scherrer et al. (1995) Scherrer, P.H., et al. 1995, Sol. Phys., 162, 219
- Schunker et al. (2005) Schunker, H., Braun, D.C., Cally, P.S., & Lindsey, C. 2005, ApJ, 621, L149
- Skumanich & Lites (1987) Skumanich, A., & Lites, B. W. 1987, ApJ, 322, 473
- Zhao et al. (2001) Zhao, J., Kosovichev, A.G., & Duvall, T.L.,Jr. 2001, ApJ, 557, 384
- Zhao et al. (2006) Zhao, J., & Kosovichev, A.G. 2006, ApJ, 643, 1317