UNIVERSTITE LYON I – CLAUDE BERNARD
LOMONOSOV MOSCOW STATE UNIVERSITY
le type de doctorat : Arrêté du 06 janvier 2005
Igor CHILINGARIAN
date de soutenance: 23/Nov/2006
FORMATION ET EVOLUTION DES GALAXIES ELLIPTIQUES NAINES
directeurs de la thèse:
Philippe PRUGNIEL / Olga SIL’CHENKO
membres du jury:
Philippe PRUGNIEL (CRAL Observatoire de Lyon, FRANCE)
Georges PATUREL (CRAL Observatoire de Lyon, FRANCE)
prof. Jacques BERGEAT (CRAL Observatoire de Lyon, FRANCE)
Olga SIL’CHENKO (Sternberg Astronomical Institute, RUSSIA)
prof. Yuri EFREMOV (Sternberg Astronomical Institute, RUSSIA)– rapporteur
Dmitry MAKAROV (Special Astrophysical Observatory, RUSSIA)– rapporteur
prof. Boris SHUSTOV (Institute of Astronomy RAS, RUSSIA)– président
prof. Ariane LANCON (Observatoire de Strasbourg, FRANCE)– rapporteur
ABSTRACT
Cette thèse présente des études d’observation de l’évolution des galaxies elliptiques naines. Les dE sont population dominante dans les amas des galaxies, mais leur origine et évolution est une question de discussion. Plusieurs scénarios d’enlèvement de gaz des dE existent : vents galactiques, pression dynamique dépouillant, harassment gravitationnel. Nous présentons la nouvelle méthode d’évaluation des paramètres de population stellaires et de la cinématique interne, basés sur des spectres observés par ajustage de précision par les populations synthétiques de PEGASE.HR. Nous nous appliquons cette technique aux observations 3D-spectroscopic des galaxies dE dans l’ama Virgo et les groupes proches et la spectroscopie multiobject de plusieurs douzaines de dEs dans l’ama Abell 496. Nous présentons la découverte de jeunes noyaux dans les dE galaxies lumineuses dans l’ama Virgo. Basé sur l’analyse des données de nos observations nous concluons cela : (1) il y a une connection évolutionnaire entre les dEs et les dIrrs (2) le scénario le plus probable de l’enlévement de gaz est pression dynamique dépouillant par le matière intergalactique.
Mots-clés: galaxies: dwarf – galaxies: evolution – galaxies: elliptical and lenticular, dE – galaxies: stellar content
FORMATION AND EVOLUTION OF DWARF ELLIPTICAL GALAXIES
This thesis presents observational studies of evolution of dwarf elliptical galaxies. dE’s are numerically dominant population in clusters of galaxies, but their origin and evolution is a matter of debate. Several scenarios of gas removal from dE’s exist: galactic winds, ram pressure stripping, gravitaional harassment. We present new method to estimate stellar population parameters and internal kinematics, based on fitting observed spectra in the pixel space by PEGASE.HR synthetic populations. We apply this technique to 3D-spectroscopic observations of dE galaxies in the Virgo cluster and nearby groups and multiobject spectroscopy of several dozens of dE’s in the Abell 496 cluster. We present discovery of young nuclei in bright dE galaxies in the Virgo cluster. Based on the analysis of observational data we conclude that: (1) there is an evolutionary connection between dE’s and dIrr’s, (2) the most probable scenario of gas removal is ram pressure stripping by the intergalactic medium.
Keywords: galaxies: dwarf – galaxies: evolution – galaxies: elliptical and lenticular, dE – galaxies: stellar content
Centre de Recherche Astronomique de Lyon, Observatoire de Lyon, 9 avenue Charles André, F-69230 Saint-Genis Laval, France ; CNRS, UMR 5574
Sternberg Astronomical Institute of the Moscow State University, 13 Universitetski prospect, Moscow, 119992, Russia
Introduction
general characteristics of the work
This work is devoted to studies of formation and evolution of dwarf elliptical galaxies (diffuse elliptical galaxies, dE) – the most common type of galaxies in the present Universe. Though dwarf elliptical galaxies represent over 70 percent of the population in dense regions of the Universe (clusters and rich groups), their origin and evolution are not yet clarified, especially questions of gas loss, and consequently interruption of star formation. Presently considered possibilities include: (1) ram pressure stripping, (2) gas removal by galactic winds due to supernovae, (3) gas loss due to gravitational harassment.
Recent studies demonstrated great variety of observational appearances of diffuse elliptical galaxies: many of them rotate, but some do not (they might be supported by anisotropic velocity dispersions); many of them contain embedded structures: discs, bars; some of them show evidence for a presence of ISM; several objects exhibit kinematically-decoupled structures. All these phenomena comfort the origin of dE galaxies with late-type disc dwarf galaxies, experienced morphological transformation and lost their gas during lifetime in clusters or groups.
For the argued choice of the scenario of dE galaxy evolution we decided to investigate possible connections between stellar kinematics and parameters of the stellar population (age, metallicity, [/Fe] abundance ratios) exploiting integral field spectroscopy of nearby dE galaxies and multiobject spectroscopy of a larger sample of more distant objects.
Research work that has been conducted by the author during last 3 years results in original technique for extraction of the stellar kinematical parameters (radial velocity, velocity dispersion) and parameters of stellar population (age, metallicity) from the spectra, integrated along a line of sight. This method has been applied to the observations of dE galaxies obtained with the MPFS IFU spectrograph at the Russian 6-m telescope and FLAMES-Giraffe spectrograph at ESO VLT. Approach for data storage and access mechanisms for 3D spectroscopic data in a frame of the International Virtual Observatory has been developed.
actuality of the topic
Presently, studies of the galaxy evolution is one of them most popular topics of the modern astrophysics. While the mechanisms of evolution of giant galaxies (both: elliptical and spiral) are investigated quite well, the same cannot be said about dE galaxies, which are much more numerous, but also more difficult for studies. Taking into account recent data on the stellar populations in dE’s: relatively high metallicities and intermediate ages, the original idea considering dE’s as building blocks for larger systems is strongly criticized. Hence, question about formation and evolution of dE galaxies is a corner-stone for understanding processes of galaxy evolution in general.
Classical approach to determine stellar population parameters by measuring parametrized spectral line strength (Lick indices) was proposed as empirical over 20 years ago, but its first astrophysical justification was made in 1994 (Worthey et al., 1994). Since that time evolutionary synthesis techniques evolved dramatically, and it became possible to synthesize complete spectral energy distributions of stellar populations at high spectral resolution, but not only parameters of selected spectral features. Taking into account a progress in the instrumentation and observational techniques, creation of the qualitatively new approach of estimating parameters of stellar populations as a vital task for analysis of modern spectral data.
immediate goal
To create a new technique to analyse absorption-line spectra, including spectra with low signal-to-noise ratios, and to apply it to the IFU data for dE galaxies.
To analyse kinematics and stellar populations of dE galaxies in order to make argued choice of the scenario of their formation and evolution.
novelty of the research
-
1.
Original technique for extracting stellar population and internal kinematics by fitting integrated spectra in the pixel space has been developed
-
2.
Parameters of stellar population, its chemical composition and central velocity dispersion values are obtained for the statistically-significant sample of dE galaxies in the Abell 496 cluster
-
3.
Young nuclei discovered in dE galaxies in the Virgo cluster
-
4.
Based on the results obtained in this work, a conclusion of the most probable scenario of gas removal from dE, ram pressure stripping, is made
practical value
-
1.
Spectral fitting technique proposed in this thesis gives the same precision as existing approaches (e.g. Lick indices), but for the signal-to-noise values 2-5 times lower, which allows to reduce significantly exposure times during observations and makes possible to study low surface brightness objects
-
2.
Spectral fitting technique allowed to analyse observations of low surface brightness dE galaxies, and in the future will provide a possibility of re-processing existing absorption-line spectra on a qualitatively new level
-
3.
Method for storing and accessing 3D data in the Virtual Observatory gives opportunity to build science-ready data archives containing 3D spectra
approbation of results
Results presented in this thesis have been presented by the author on the seminars of INASAN (Russian Academy of Sciences), Sternberg Astronomical Institute of MSU, CRAL Observatoire de Lyon, GEPI Observatoire de Paris-Meudon, and international conferences listed below:
-
1.
Lomonosov-2003, physics-astronomy section (Moscow, Russia, 14 March 2003)
-
2.
ADASS-XIII (Strasbourg, France, 12-15 Oct 2003)
-
3.
Russian National Astronomical Conference VAK-2004 (Moscow, 24-28 May 2004)
-
4.
JENAM-2004 (Granada, Spain, 14-17 September 2004)
-
5.
ADASS-XIV (Pasadena, USA, 24-27 October 2004)
-
6.
International Astronomical Union Colloquium 198 (Les Diablerets, Switzerland, 14-18 March 2005)
-
7.
IVOA Interoperability Meeting (Kyoto, Japan, 14-18 May 2005)
-
8.
ADASS-XV (San Lorenzo de El Escorial, Spain, 2-5 Oct 2005)
-
9.
IVOA Interoperability Meeting (Villafranca del Castillo, Spain, 6-7 october 2005)
-
10.
ESO Workshop: Science Perspectives for 3D Spectroscopy (Garching, Germany 10-13 Oct 2005)
-
11.
IVOA Interoperability Meeting (Victoria, Canada, 15-18 May 2006)
-
12.
Mapping the Galaxy and Nearby Galaxies (Ishigaki, Japan, 26-30 Jun 2006)
-
13.
IVOA Interoperability Meeting (Moscow, Russia, 18-22 Sep 2006)
publications and author’s personal input
Main results of the thesis are presented in 10 papers, published in the refereed journals (2) and conference proceedings (8), and also in the Standard, proposed by the IVOA to be used in the astronomical data archives.
In the mentioned publications author has:
-
•
developed method for analysis of spectra, implemented it as a software package, applied to the spectral data and interpreted the results in [1-5,8,9,11];
-
•
provided method for analysis of spectra as a software package in [7];
-
•
applied Characterisation Data Model to the 3D data, created examples of characterisation metadata for real 3D datasets obtained with MPFS in [6];
-
•
applied Characterisation Data Model to the 3D and longslit spectra, scanning Fabry-Perot interferometer, and also edited the document in [10]
structure of dissertation
Dissertation consists of: introduction, four chapters, conclusions, and appendix. It includes 107 pages, 28 figures, 12 tables. Bibliography includes 134 references.
Chapter 1 starts with brief review of existing methods of estimating stellar population parameters. New technique for estimating stellar population parameters is presented and discussed there. Stability, precision, possible biases of the new approach are investigated.
Chapter 2 presents results of analysis of the integral field spectroscopy for four Virgo cluster dwarfs: IC 783, IC 3468, IC 3509, and IC 3653. Embedded rotating stellar disc is found in IC 3653. Young nuclei are revealed in IC 783, IC 3468, and IC 3509.
Chapter 3 includes analysis of the IFU data for two rather unusual low-luminosity galaxies in groups: NGC 770 (NGC 772 group), exhibiting counter-rotating core, and NGC 127 (NGC 128 group), showing evidences for ongoing cross-fueling from NGC 128.
Chapter 4 is devoted to the studies of a large sample of early-type galaxies in the Abell 496 cluster, based on multi-object spectroscopy and deep multicolour photometry. Fundamental properties of the objects are discussed.
Conclusions chapter includes major results of the thesis and brief discussion of them
Appendix includes application of the Characterisation Data Model to the 3D spectroscopic datasets. Method for accessing those data in the Virtual Observatory is proposed.
publication list:
-
1.
Chilingarian I. Object classification by SEDs. Moscow, MSU, Physics Department, Division of Astropysics and Stellar Astronomy, 2003. Master thesis. International conference for graduate, postgraduate students and young scientists on fundamental sciences ”Lomonosov-2003”. Section: Physics, proceedings of the conference, issued by Physics Department of MSU, 2003, pp.16-17.
-
2.
Chilingarian I., Prugniel P., Sil’chenko O., Afanasiev V. Diffuse elliptical galaxies, the first 3D spectroscopic observations. Proceedings of JENAM-2004 (in press). Preprint: astro-ph/0412293
-
3.
Prugniel P., Chilingarian I., Sil’chenko O., Afanasiev V. Internal kinematics and stellar populations of dE galaxies: clues to their formation/evolution. Proceedings of IAU Colloquium 198, edited by B. Binggeli, H. Jerjen, 2005, p. 73; preprint: astro-ph/0510398
-
4.
Chilingarian I., Prugniel P., Sil’chenko O., Afanasiev V. 3D Spectroscopic studies of dE galaxies. Proceedings of IAU Colloquium 198, edited by B. Binggeli, H. Jerjen, 2005, p. 105
-
5.
Prugniel P., Chilingarian I., Popovic L. The history and dynamics of the stellar population in the central kpc of active galaxies. Memorie della Societa Astronomica Italiana Supplement, 2005, v.7, p.42
-
6.
Chilingarian I., Bonnarel F., Louys M., McDowell J. Handling 3D data in the Virtual Observatory. Proceedings of ADASS XIV, ASP Conference Series, 2006, v. 351, p. 371
-
7.
Koleva M., Bavouzet N., Chilingarian I., Prugniel, P. Validation of stellar population and kinematical analysis of galaxies. Proceedings of ESO Workshop ”Scientific Perspectives of 3D Spectroscopy”, in press, preprint: astro-ph/0602362
-
8.
Chilingarian I., Ferraz Lagana T., Cayatte V., Durret F., Adami C., Balkowski C., Chemin L., Prugniel P. Evolution of dE galaxies in Abell 496. Kinematics and stellar populations of 46 galaxies. Proceedings of ”Mapping the Galaxy and Nearby Galaxies” (in press).
-
9.
Chilingarian I., Prugniel P., Sil’chenko O., Afanasiev V. Kinematics and stellar populations of the dwarf elliptical galaxy IC 3653. 2006, MNRAS, submitted.
-
10.
Data Model for Astronomical DataSet Characterisation, version 0.9, edited by J. McDowell, F. Bonnarel, I. Chilingarian, M. Louys, A. Micol, and A. Richards; IVOA Note from May 5, 2006 by IVOA Data Model Working Group.
-
11.
Chilingarian I., Sil’chenko O., Afanasiev V., Prugniel Ph. Young Nuclei in Dwarf Elliptical Galaxies. 2006, accepted for publication in ”Astronomy Letters”. Preprint: astro-ph/0611866
Chapter 1 Stellar population fitting technique
Strong starburst events or periods of quiescent star formation during lifetime of galaxies result in various generations of stars which we observe presently. Thus, present stellar populations contain a fossil record of a galaxy evolution in the past, and studies of them should help to bring additional constraints to the scenarios of evolution of galaxies.
Numerous methods exist to study stellar populations. For the nearest objects, which can be resolved into stars using deep ground-based observations or HST imagery (resolved stellar populations), the most efficient way is to build and analyse so called colour-magnitude diagrams (CMD, see e.g. Da Costa & Armandroff, 1990; Aparicio, 1994). Depending on the depth of CMD, different features can be used to estimate age and metallicity of the stellar populations: main sequence turn point(s), position and width of the red giant branch, asymptotic giant branch stars, etc. The complete star formation history over several Gyr can be reconstructed by fitting models based on stellar evolutionary tracks into CMD. In addition, this is a very precise method for estimating accurate distances to the nearby galaxies (Makarov & Makarova, 2004). Using CMD analysis it was shown that faint local group dwarf spheroidal galaxies exhibit great variety of star formation histories (Carraro et al. 2001), but all of them contain significant amount of relatively old stars.
For more distant galaxies, where distribution of the stars on the H-R diagram cannot be built directly (unresolved stellar populations), various techniques have been developed to recover SFH either from broad-, middle-, or narrow-band colours, or spectra, integrated along a line of sight. Photometry-based methods are dealing with colour-magnitude relations for particular sets of filters, or with larger sets of multicolour data represented as spectral energy distributions (SED). Individual colours in the optical band are demonstrated to be extremely degenerated with respect to age and metallicity, e.g. old metal-poor stellar population as in globular clusters will look nearly the same as intermediate-age metal-rich ones (as in many dE galaxies). On the other hand, SED may cover significant wavelength domains, from far-UV to mid-IR, providing opportunity to disentangle roles of metallicity and age.
Spectral data may contain considerably larger amount of information, and many attempts of its usage have been considered. In order to minimize the effects of possible errors in flux calibration and to deal with data having different spectral resolution, a concept of ”index” – parametrized representation of a line strength – was proposed yet in early 80th (Burstein et al. 1984). Methods exploiting spectral indices evolved quite significantly during last 20 years, and at present time they remain the most widely used.
All methods dealing with unresolved stellar populations are based on comparison of observations against models: empirical or theoretical. There are two main directions to construct these models: population and evolutionary synthesis. Compared to resolved stellar populations, normally it is not possible to reconstruct SFH in details, but only give some its parameters, usually, luminosity-weighted age, metallicity, and element abundance ratios (e.g. [Mg/Fe]).
In case of population synthesis, a model is a superposition of several ”populations”, for instance, spectrum of galaxy is modelled by a linear combination of several stellar spectra. In practice, an inverse problem needs to be solved: contribution of every subpopulation has to be restored. This problem is unstable with respect to the observational errors, so different astrophysical constraints are put on the contributions in order to find a solution having physical sense. First applications of population synthesis to analyse stellar population of galaxies were made by Wood (1966) and Faber (1972).
Evolutionary synthesis is an alternative approach, based on our knowledge of stellar evolution (Tinsley, 1968, 1972a,b). Spectrum (or colour) of a galaxy is computed as the double integral:
| (1.1) |
where is a luminosity of a galaxy at wavelength, is a luminosity of a star having mass and age at the same wavelength, is a number of such stars in a galaxy, is an age of stellar population – free parameter; and are minimal and maximal stellar masses. From the theory of stellar evolution we know various parameters of a star (e.g. and ) for a given mass at a given moment of time (evolutionary track). From a library of observed stellar spectra, where atmosphere parameters are measured, or set of theoretical spectra, is known. can be obtained assuming some initial mass function of stars, for instance, Salpeter IMF (Salpeter, 1955), and a star formation rate as function of time.
We are referring to the Full Doctor thesis of Olga Sil’chenko (1992) for a historical review of different population and evolutionary synthesis methods known at that time. Here we will emphasize only fundamental steps in the evolutionary synthesis, made the current work possible.
Study of Worthey et al. (1994) was one of the most successful attempts of applying evolutionary synthesis to the set of spectral indices (Lick indices). Grid of models for a wide set of ages and metallicities was presented. It was shown, that exploiting different sets of indices gave a possibility to disentangle age and metallicity effects (see next chapter for an example of application). Continuation of this work (Worthey & Ottaviani, 1997) defined several new indices and corrected definitions of some existing ones. It became clear (Worthey et al. 1992) that giant early-type galaxies usually exhibit super-solar [/Fe] abundance ratios. This stimulated construction of new models for non-solar abundance ratios. The most cited work of this kind is Thomas, Maraston & Bender (2003). In the 4th chapter we apply models published there to a large sample of early-type galaxies in order to study enrichment mechanisms in dE’s.
Another family of approaches was to synthesize whole spectral energy distribution, not only specific details, based on available libraries of stellar spectra (observational or theoretical): Fioc & Rocca-Volmerange, 1997; Vazdekis, 1999; Leitherer et al., 1999; Eisenstein et al., 2003; Bruzual & Charlot, 2003.
In this work we will be dealing with the evolutionary synthesis models, providing whole spectral energy distribution at high spectral resolution (R=10000), computed with the new PEAGSE.HR (Le Borgne et al. 2004) code. Hereafter we present a method of stellar population parameters determination based on fitting of the whole spectrum, not only specific spectral features in order to optimize usage of the information, contained in observations.
Several techniques exist for extracting internal kinematics from absorption-line spectra. Historically, the first method was Fourier Quotient (Sargent et al. 1977). A spectrum of galaxy is deconvolved with a spectrum of template star in the Fourier space. This method takes into account the instrumental broadening of the spectrograph, however it does not work very well for low signal-to-noise spectra (Bottema, 1988), and it is quite sensitive to the template mismatch (Bender, 1990).
The second method is a cross-correlation (Tonry & Davis, 1979), where cross-correlation function of two spectra: galaxy and template is built and then analysed in the pixel space. It works quite well for low signal-to-noise ratios and is less sensitive to the template mismatch than FQ technique. At the same time, in order to get high contrast of the correlation peak, it is necessary to remove continuum, which is not always straightforward. Another practical problem is that only a certain region around the peak has to be fitted, and changing this region might result in biased estimates of velocity dispersion.
The third method, proposed by Bender (1990) is a combination of first two. It is the Fourier Correlation Quotient, and its main idea is to deconvolve the correlation peak of template-galaxy correlation function with the peak of the autocorrelation function of the template.
In 1992-1994 there was a tendency toward development of methods for fitting line-of-sight velocity distribution (LOSVD) directly in the pixel space (Rix & White, 1992; Kuijken & Merrifield, 1993; van der Marel, 1994; Saha & Williams, 1994). The main reason was that in pixel space it became easy to exclude gas emission lines or bad pixels from the fit, and take continuum matching directly into account.
Van der Marel & Franx (1993) introduced deviations of the galaxy’s LOSVD from Gaussian by using Gauss-Hermite polynomials of the 3rd and 4th order, responsible for asymmetry of the profile (), and its symmetric deviations from Gaussian (narrower for positive or wider for negative respectively), and even higher order deviations (, ). From a mathematical definition, is correlated with the radial velocity, and is anticorrelated with velocity dispersion. This makes quite difficult to expect unbiased values of the kinematical parameters for the case of low signal-to-noise ratio, and undersampled LOVSD.
In order to improve the situation, penalization factor, depending on and was proposed to be applied to value during minimization (Cappellari & Emsellem, 2004), in order to fit and only if they are statistically significant. This dramatically improves the quality of fitting for low signal-to-noise ratios, that is demonstrated by the authors. Penalized pixel fitting (ppxf) method now is the most advanced technique for extracting internal kinematics and it is widely used in the community (e.g. Emsellem et al., 2004).
1.1 Description of the method
Various methods have been developed to determine the star formation history (SFH) directly from observed spectra (Ocvirk et al. 2003, Moultaka et al. 2004, de Bruyne et al. 2004, Ocvirk et al. 2006a, 2006b). The procedure that we are proposing here, population pixel fitting, is derived from penalized pixel fitting method developed by Cappellari & Emsellem (2004) to determine the LOSVD.
The observed spectrum is fitted in pixel space against the population model convolved with a parametric LOSVD. The population model consists of one or several star bursts, each of them parametrized by some of its characteristics, typically age and metallicity for a single burst while the other characteristics, like IMF, remain fixed. This method returns in a single minimization the parameters of LOSVD and those of the stellar population.
Ideally, we would like to reconstruct SFH, over all the life of the galaxy. This means, disentangle internal kinematics and distribution in the HR diagram from the integrated-light spectrum. This problem has been discussed in several places (e. g. de Bruyne et al. 2004, Ocvirck et al. 2006a,b), it is clearly extremely degenerated and solutions can be found only if a simplified model is fitted.
In this work we discuss only the simplest case of SSP characterised by two parameters: age and metallicity. We do not discuss complex SFH, because signal-to-noise ratios of our data are not sufficient for such elaborated studies.
The value (without penalization) is computed as follows:
| (1.2) |
where is LOSVD; and are observed flux and its uncertainty; is the flux from a SSP spectrum, convolved according to the line-spread function of the spectrograph (LSF, see next subsubsection); and are multiplicative and additive Legendre polynomial of orders and for correcting a continuum; is age, is metallicity, , , . and are radial velocity, velocity dispersion and Gauss-Hermite coefficients respectively (Van der Marel & Franx, 1993). Normally we used no additive polynomial continuum, and 5-th (for MPFS) or 9-th (for Giraffe) order multiplicative one, and since dwarf galaxies observed with MPFS had insufficient sampling of the LOSVD due to low velocity dispersion, and Giraffe fibers were pointed to the centres of galaxies, where one would not expect asymmetries of the LOSVD profiles, we did not fit and . There are two main reasons for including multiplicative polynomial continuum terms in the minimization: (1) internal extinction in the observed galaxy, (2) imperfections of the absolute flux calibration. Additive terms may be included to eliminate effects of improper subtraction of night sky emission or diffuse light in the spectrograph.
The problem can be partially linearized: in particular, fitting of additive polynomial continuum, and relative contributions of sub-populations constituting (in case it is not a SSP spectrum) is done linearly on each evaluation of the non-linear functional. Thus we end up with the following parameters to be found by the minimization procedure: , , 6 or 10 coefficients for (), , and .
The main technical part of our method is a non-linear minimization procedure for difference between observed spectrum and template one, parametrized by LOSVD and SFH parameters. The parametric stellar population is made by interpolating a grid of high-resolution () synthetic SSP spectra, computed with the PEGASE.HR, with 25 steps in age (10 Myr to 20 Gyr, step increases from 5 Myr to 2 Gyr) and 10 steps in metallicity ([Fe/H] from -2.5 to 1.0). Minimization is done on the logarithm of age. Because the minimization procedure requires that the derivatives of the functions are continuous, we used a two-dimensional spline interpolation. For processing the non-linear minimization we exploit the MPFIT package (by Craig B. Markwardt, NASA 111http://cow.physics.wisc.edu/ craigm/idl/fitting.html) implementing constrained variant of the Levenberg-Marquardt minimization, thus we are able to fix any of the LOSVD/SFH parameters.
1.2 Line spread function of the spectrograph
Before comparing a synthetic spectrum to an observation, it is required to transform it as if it was observed with the same spectrograph and setup, i. e. to degrade its resolution to the actual resolution of the observations. Actually the spectral resolution changes both with the position in the field of view and with the wavelength (thus it is not a mere operation of convolving with the LSF). Taking into account these effects is particularly critical when, as it is the case here, the physical velocity dispersion is of the same order or smaller than the instrumental velocity dispersion.
The procedure for properly taking into account the LSF goes in two steps. First, determine the LSF as a function of the position in the field and of the wavelength. Second, inject this LSF in the grid of SSP.
Therefore we made an exhaustive analysis of the LSF of our observations. For MPFS spectrograph, where was a previous study of the change of the resolution over the field of view (Moiseev 2001), which qualitatively agrees with our results.
To measure the LSF change over the field of view of MPFS or across Giraffe fibers we use the spectra of standard stars (HD 135722 and HD 175743) and twilight sky (Solar spectrum). We analyse these spectra using penalized pixel fitting procedure. The high-resolution spectra () for the corresponding stars (the Sun for the twilight spectra) taken from the ELODIE.3 library (Prugniel & Soubiran 2001, 2004), were used as templates. Since these spectra have exactly the same resolution as the PEGASE.HR SSPs, the ’relative’ LSF that we determined in this way can be directly injected to the grid of SSP to make it consistent with observations. We parametrize LSF using and .
The whole wavelength range of the spectrograph is splitted into several parts, overlapping by 10 per cent, and the LSF parameters are extracted in each part independently in order to derive the wavelength dependence of the LSF.
Finally, to inject the LSF in the grid of SSPs, we applied the following steps to every spatial element (IFU fiber of MPFS, MEDUSA fiber of FLAMES-Giraffe, or segment of the slit):
-
•
Several convolved SSP grids were created using the LSF measured for all wavelength subsegments.
-
•
The final grid was generated by linear interpolation at each wavelength point between the five grids of SSPs.
It produces one grid of SSP for each spatial element of the spectrograph having exactly the same LSF as the observations.
1.3 Validation and error analysis
In this section we address questions concerning error analysis, stability of the solutions, and possible biases for the MPFS and Giraffe data for galaxies with relatively old stellar population (about 5 Gyr). Full description of these aspects extended to any instrument and much wider range of parameters will be described in details in the forthcoming paper. Here we give only essential error analysis required for validation of the results presented in this thesis and in the forthcoming papers based on MPFS and Giraffe data for dwarf galaxies.
1.3.1 Error analysis
Error estimations for stellar population constraints for such a non-linear procedure as we are following is a non-trivial task. A complete and detailed description of one of the possible approaches to locate the alternate solutions using for a allied inversion technique is given in Moultaka & Pelat (2000).
We performed some Monte-Carlo simulations (about 10000 per spectrum for the 3-points binning for IC 3653, see next chapter) to demonstrate the consistency between uncertainties on the parameters reported by the minimization procedure and real error distributions. We have used best-fitting template spectra and added Poisson noise to the fluxes, corresponding to signal-to-noise ratios of the observed spectra. These simulations have demonstrated that in case of IC 3653 dataset, where there is neither significant template mismatch due to element abundance ratios, nor strong mistake with subtraction of additive terms (diffuse light and night sky), the uncertainties found from the Monte-Carlo simulations using scattering of solutions in the multidimensional parameter space coincide with values reported by the minimization procedure being multiplied by values. Deviation of from 1 might be caused either by poor quality of the fit (template-mismatch) or by wrong estimations of absolute flux uncertainties in the input data. We conclude that in some cases our estimations of absolute flux uncertainties based on the photon statistics are not ideal, that is not strange taking into account the complexity of the data reduction. However, values of between 0.7 and 1.3 suggest that our error estimations are relatively precise.
To estimate the errors more accurately, locate possible alternate solutions and search for degeneracies between kinematical and stellar population parameters we perform direct scan of the space for age, metallicity, and velocity dispersion. Here we present the procedure we followed for the analysis of MPFS data for IC 3653. For the Giraffe data, the analysis was made similarly. The procedure we followed includes the following steps:
-
•
We chose a grid of values for age, metallicity, and velocity dispersion, that was supposed to cover a reasonable region of the parameter space where we could expect to have solutions. In our case the grid was defined as: 2 Gyr t 14 Gyr with a step of 200 Myr, -0.45[Fe/H]0.40 with a step of 0.01 dex, 30 km s-1 100 km s-1 with a step of 0.5 km s-1
-
•
At every node of t-Z grid we ran the pixel fitting procedure in order to determine multiplicative polynomial continuum, and to have the best fit for a given SSP
-
•
Later was computed on a grid of values of by fixing all other components of the solution that had been found in the previous step
This way of scanning space is stipulated by frequency effects of the parameters (see Tab 1.1): polynomial continuum and stellar populations parameters have low-frequency effect on the template spectra, so we do need to make a fit of the polynomial continuum if we want to avoid additional dimensions of the space to scan for a case of th order multiplicative continuum. At the same time is a high-frequency parameter, thus we are safe when just computing values varying only and leaving other parameters fixed.
In other words using our procedure we compute a slice of the full by the hypersurface defined as a set of minimal values for multiplicative continuum terms and radial velocity values, and then reproject it onto ”t-Z” and ”t-Z-” hyperplanes. Result contains two arrays: 2D age-metallicity and 3D age-metallicity-velocity dispersion.
| Parameter | t | Z | |||
|---|---|---|---|---|---|
| Low-frequency | no | no | yes | yes | yes |
| High-frequency | yes | yes | yes | yes | no |
Values of line-of-sight radial velocity obtained during the fitting procedure on the t-Z grid are equal to each other within errors reported by the minimization procedure, suggesting that scanning of the hyperspace on is not necessary, though it is relatively easy to do by scanning the 2D (, ) grid instead of 1D on () on every point of the t-Z grid.
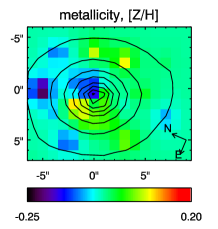
In Fig 1.1 (upper line) we present the maps of for the 3-points binning of the MPFS data for IC 3653 (see next Chapter) on the ”t-Z” plane (all other parameters are fitted). One can see elongated shapes of the minima, corresponding to well known age-metallicity degeneracy. Three plots on the bottom of Fig 1.1 represent slices of the 3D space scan (t-Z-) for the ”P1” bin. One can notice that the width of the minimum on ”t-Z” plane has decreased due to a correlation between metallicity and velocity dispersion, that is clearly seen on the ”Z-” slice. This degeneracy between velocity dispersion and metallicity can be clearly explained: higher metallicity in the template than in the observed spectrum increases depth of the absorption lines, that can be compensated by stronger widening, i.e. using higher velocity dispersion. This is a very important result. Thus, if one uses cross-correlation or pixel fitting with the template having a metallicity very different from observed spectrum, velocity dispersion measurements will be biased. This might also produce artificial features of velocity dispersion profiles/maps if the same template is used for regions of galaxy having different metallicities, e.g. metallicity gradient.

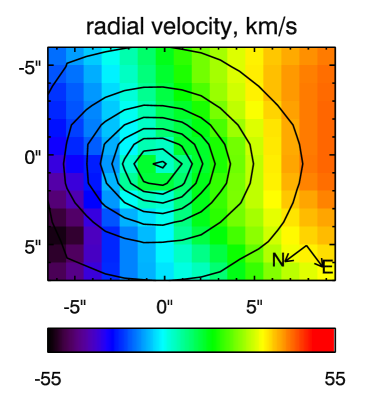
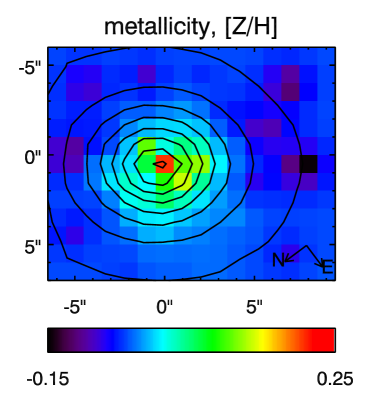
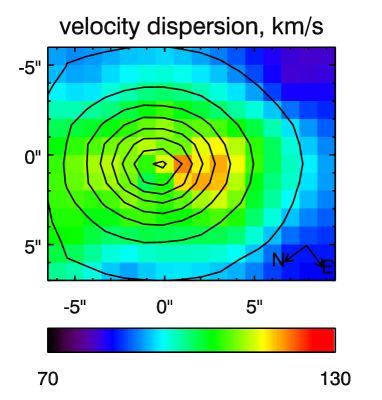
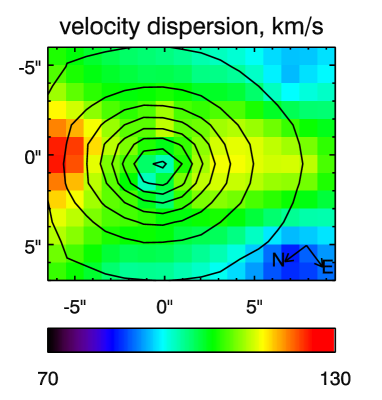
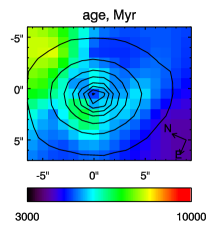
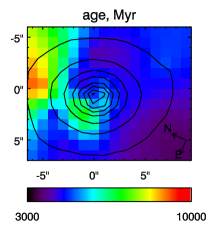
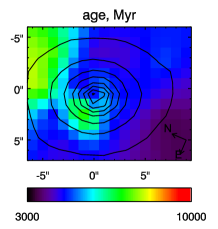
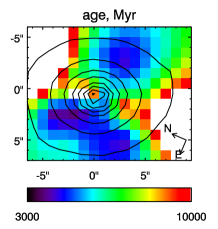
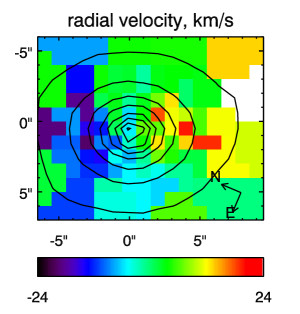
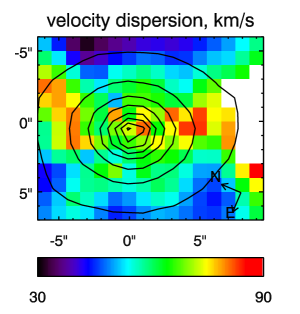
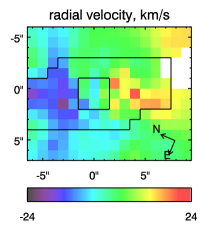
To illustrate how degeneracy can affect velocity dispersion maps, we are presenting 2D distributions of velocity dispersion for NGC 3412 obtained by the pixel fitting algorithm for two cases: (a) stellar population parameters are fixed ( Gyr, [Fe/H]=-0.05 dex) and only kinematical parameters () are fitted; (a) SSP-equivalent stellar population parameters is fitted together with kinematical ones. MPFS data for NGC 3412 were obtained in a frame of studies of nearby lenticular galaxies, P.I.: Olga Sil’chenko, and kindly provided by her.
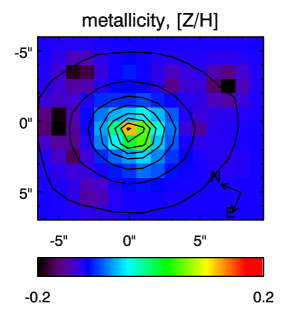
NGC 3412 is a giant lenticular galaxy, exhibiting relatively high central metallicity (up-to [Fe/H]=+0.2), and exactly solar [Mg/Fe] abundance ratio (Sil’chenko, 2006), so fitting PEGASE.HR template spectra is not expected to produce systematic errors due to template mismatch. The galaxy is known to contain a counter-rotating core (Aguerri et al. 2003). NGC 3412 was one of the first objects, where velocity dispersion dip in the central region was found. Age distribution across the galaxy is almost flat with a mean value of 4.5 Gyr. However, there is a sharp gradient in the metallicity in the inner 3 arcsec, where it changes from -0.05 to +0.21.
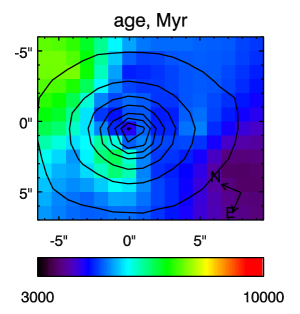
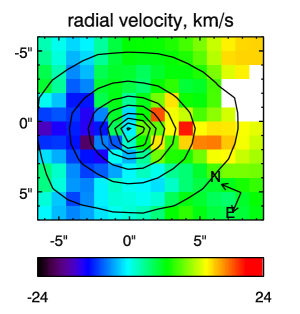
In Fig. 1.2 2-dimensional radial velocity field (Fig. 1.2a), metallicity distribution (Fig. 1.2b), and two velocity dispersion fields for variable (Fig. 1.2c) and fixed (Fig. 1.2d) stellar population parameters are shown. All fits are made for the adaptively binned data using Voronoi tessellation for a target S/N=40 (see next chapter for details). One can notice a valuable central dip in the velocity dispersion distribution (down to 95 km s-1) obtained when fitting fixed stellar population, whereas it remains above 110 km s-1 when stellar population parameters are fitted together with kinematics.
| (a) | (b) |
 |
 |
| (c) | (d) |
 |
 |
We have checked three galaxies, included in the SAURON sample, exhibiting velocity dispersion dips (Emsellem et al. 2004): NGC 2768, NGC 3384 (observations with MPFS at 6-m telescope), and NGC 4150 (GMOS-N at Gemini, archival data). In all three cases velocity dispersion dips either disappeared completely (NGC 3384 and NGC 4150), or became less significant in case of NGC 2768 – 70 km s-1 compared to 120 km s-1. In NGC 2768 central metallicity exceeds +0.5 dex. For such high metallicities, quality of synthetic spectra if far from ideal due to lack of metal-rich stars in the stellar libraries, used to construct them. Thus, we might expect further increase of the velocity dispersion values in the central part of NGC 2768, whenever quality of spectral synthesis gets improved.
1.3.2 Stability of solutions
Stability of solutions is a crucial point for every method dealing with multiparametric non-linear minimization. We studied the stability with respect to initial guess, wavelength range being used, and degree of the multiplicative polynomial continuum.
Initial guess
We have made several dozens of experiments with different initial guesses in order to inspect the stability of convergence. We found no problems with starting guess of age, metallicity and velocity dispersions in quite a wide range of values. The only critical parameter is radial velocity – the initial guess needs to be within 2 values of velocity dispersion from the solution that is around 100-150 km s-1 in case of MPFS data for IC 3653 (see next chapter).
For the 3-points binning solutions do not converge to exactly the same point of the parameter space, but scattering of values (standard deviation) is negligible: around 3 Myr for age, 0.0003 dex for metallicity, 0.02 km s-1 for velocity dispersion, and 0.002 km s-1 for radial velocity.
Wavelength range
We ran two series of experiments: one with Å, and another one with the full wavelength range, but regions of Balmer lines (H and H) masked. The reasons for the first experiment is: a region between ÅÅ contains a lot of strong absorption features related to metals, thus one might expect to have metallicity estimations biased in case of unknown problems with the algorithm and/or presence of additive continuum (for instance, due to incorrect subtraction of night sky, or diffuse light) varying with wavelength. There is a similar reason for the second experiment because of age: Balmer lines are known to be good age estimators (Worthey at al. 1994, Vazdekis& Arimoto 1999).
| P1 | P2 | P3 | |
|---|---|---|---|
| , km s-1 | 601.8 1.0 | 603.4 1.4 | 603.8 3.0 |
| 600.9 1.0 | 603.1 1.7 | 603.7 3.4 | |
| , km s-1 | 70.9 1.6 | 67.3 2.2 | 52.1 5.0 |
| 71.8 1.6 | 65.3 2.6 | 52.1 5.7 | |
| t, Gyr | 4.855 0.218 | 4.728 0.289 | 4.629 0.694 |
| 4.714 0.235 | 4.448 0.403 | 4.238 0.930 | |
| Z, dex | 0.01 0.02 | -0.14 0.02 | -0.15 0.05 |
| 0.03 0.01 | -0.13 0.02 | -0.15 0.05 |
One may notice, that cutting the blue part of the spectrum does not affect the results, but increases uncertainties of the determination of parameters. The second set of experiments shows similar results. Errors of age are quite large and they become comparable to the precision of Lick indices (see next Chapter, Tab. 2.4). However, values themselves coincide with the results of the fit for full wavelength range within 1. It is quite a remarkable result, that demonstrates that even without Balmer lines it is possible to give estimations of age of the stellar population, because in case of pixel fitting the usage of the information contained in the spectrum is by far much more optimal than in case of Lick indices.
Order of multiplicative polynomial continuum
We also explored the stability of the method with respect to the order of the multiplicative polynomial continuum. The results (for MPFS data) are shown in Fig 1.3. One can see that for n5 there is neither significant changes of the estimations of kinematical and stellar population parameters, nor of value. Time of computation is growing with quite rapidly, because it is minimized non-linearly. Thus we chose for all our data analysis of MPFS datasets. Using similar technique we found as the optimal value for Giraffe data analysed in this work.

1.3.3 Possible biases
There are several possible sources of systematic errors on the parameters: (1) additive systematics of the flux calibration due to under- or oversubtraction of the night sky, (2) imperfections of the models, one of the most important among those is non-solar abundance ratios of chemical elements.
Additive terms
Accurate subtraction of the night sky emission is quite a challenging step of the data reduction for low-surface brightness objects. Basically, night sky emission consists of continuum emission, that might include scattered solar light as well, and several bright emission lines. Under- or oversubtraction of night sky brings additive component resulting in changing the depths of absorption spectral features (equivalent widths). This will affect results of the pixel fitting procedure, and conclusions based on measurements of Lick indices as well.
We have conducted two series of experiments: (1) adding a constant term or (2) heavily smoothed spectrum itself (smoothing window of 300 pixels) to emulate the diffuse light in the spectrograph. In every series the fraction of the additive term was between -20 and +50 per cent to model over- and undersubtraction. Additive polynomial terms were not included in the fit. Results appear to be virtually the same. The results for the constant term as a fraction of flux at 5000Å (for MPFS data) are shown in Fig 1.4. One may notice that reaches minimum on slightly negative (over-subtraction) values of the additive term. It is easily understandable taking into account that we did not change flux uncertainties during our experiments. The remarkable result is stability of age estimations on a wide range of additive components (-25 to 15 per cent). This is quite an important advantage of the pixel-fitting technique over Lick indices, because additive terms will always bias age estimations based on Lick indices, since all index measurements, including H, will be biased in the same way for obvious reasons. Metallicity and velocity dispersion exhibit expected behaviour: growth of and fall of Z. Indeed within a range of contribution between -5 and 5 per cent changes are quite small (8 per cent for , and 0.1 dex for Z) though significant.

In order to test the consequences of bad sky subtraction we made two additional experiments: we tried to fit the data (IC 3653 dataset), where the sky spectrum was represented by a low-order polynomial continuum and with no sky subtraction at all. We excluded four regions of the spectrum containing bright emission lines: HgI 4358Å, 5461Å, [NI] 5199Å, and [OI] 5577Å. The experiments were made for the 3-points binning of the data, demonstrating the effects for high, intermediate, and low surface brightness (see Tab 2.2). Basically we found no significant difference for the ”P1” and ”P2” bins between the parameters for the correct sky subtraction and subtraction of the low-order polynomial model of the sky (see Tab 1.3). ”P3” bin gives younger age and higher metallicity, but the estimations are in agreement with the normal sky subtraction within 2 However, as expected, when sky is not subtracted at all we find valuable bias on , age, and metallicity, and velocity dispersion estimations for the ”P2” bin, and even stronger effect for ”P3”. Due to additive continuum metallicities are found to be lower, ages older, and velocity dispersions higher than expected. These experiments demonstrate that for the surface brightness down to mag arcsec-2 features of the night sky spectrum do not affect the results of the pixel fitting procedure, and very rough sky subtraction is sufficient to obtain the realistic estimations of kinematical and stellar population parameters.
| P1 | P2 | P3 | |
|---|---|---|---|
| , km s-1 | 604.3 1.0 | 606.0 1.5 | 609.4 3.2 |
| 604.4 1.0 | 605.9 1.6 | 610.3 3.7 | |
| , km s-1 | 71.5 1.5 | 64.9 2.4 | 54.4 5.2 |
| 80.5 1.5 | 88.3 2.2 | 105.5 4.6 | |
| t, Gyr | 4.868 0.210 | 4.547 0.310 | 3.956 0.731 |
| 4.972 0.185 | 7.203 0.390 | 12.982 1.641 | |
| Z, dex | 0.04 0.01 | -0.10 0.02 | -0.06 0.04 |
| -0.08 0.01 | -0.50 0.02 | -0.94 0.03 |
Non-solar [/Fe] ratios
In order to assess reliability and precision of the stellar population parameters found by the pixel fitting procedure under different circumstances, we have conducted a number of tests using Monte-Carlo simulations and real published datasets. Taking into account quite a high fraction of massive objects exhibiting supersolar values of [Mg/Fe] in the sample of early-type galaxies in Abell 496 cluster, the most principle questions for the validation of results are: does our technique produces biased estimations of SSP-equivalent ages and metallicities in case of non-solar [Mg/Fe] abundance ratio? do they depend on the presence of H? If there are biases, is it still possible to apply some empirical corrections?
Up to now there was no attempts to model spectral energy distribution of synthetic stellar populations for non-solar -element abundance ratios. Therefore we have to use published spectral data, where age and metallicity can be estimated using both: Lick indices and pixel fitting. Since there is a tight correlation between [Mg/Fe] abundance ratio and central velocity dispersion (and luminosity as well) of the galaxies: significantly positive [Mg/Fe] ratios are observed in galaxies with km s-1, spectral resolution of the dataset does not need to be very high. We decided to use spectral data from Nearby Field Galaxy Survey (Jansen et al. 2001) obtained with the FAST spectrograph at the F. L. Whipple Observatory’s 1.5 m Tillinghast telescope. Data have very wide spectral range: 3600Å to 7500Å, spectral resolution is about 6Åin the middle of the range ( km s at 5200Å). We have also used twilight spectra available through NOAO FAST archive observed with the same setup of the spectrograph and at the same periods, as the NFGS data were obtained. Our goal was to determine LSF of FAST and its variations along the wavelength range. Nearly all 200 galaxies observed in a frame of NFGS presented by two spectra: nuclear, representing inner part of a galaxy, and total spectrum integrated along the slit.
We have selected only spectra of early type galaxies (E, S0, Sa) with no visible emission lines.
To measure Lick indices we have degraded spectral resolution of the NFGS by convolving original spectra with the Gaussian countour having width , where is velocity dispersion of the galaxy (in a given spectrum), is a width of FAST LSF depending on a given Lick index, and is the resolution needed to measure Lick indices, also depending on a given index. If the value under the square root turned to be negative, no degradation was done. Instead, -correction according to Kuntschner (2004) was applied to the measurements of Lick indices using .
After having measured Lick indices, selection was restricted to objects having values of H index between 1.4 and 2.6Å, and MgFe index between 2.0 and 4.2Å: in this range models by Thomas et al. (2003) in a range of -0.5 … +0.5 dex, and 2 … 15 Gyr form unequivocally reversible grids for any [Mg/Fe]. Resulting sample contains 49 NFGS spectra: 25 nuclear and 24 integrated ones.
Every spectrum was fitted three times in different wavelength ranges: (1) between 4300 and 5600Å (full range of MPFS), (2) between 4800 and 5600Å(Giraffe spectral range for Abell 496 galaxies including H), (3) between 4880 and 5600Å(the same, but excluding H). Three tests were conducted in order to assess stability of age estimations for objects with non-solar [Mg/Fe] abundance ratios with respect to the wavelength range being used.
Values of ages and metallicities obtained by pixel fitting have been compared to the results obtained by inverting a grid of Lick indices: H and MgFe. For 38 of 49 spectra (77 percent) age estimations coincide within 1 confidence level. We found no correlation between [Mg/Fe] and . This is a strong argument for using pixel fitting technique with PEGASE.HR models to estimate ages of stellar populations even for non-solar [Mg/Fe] abundance ratios.
Chapter 2 dE galaxies in the Virgo cluster
In this chapter we present 3D spectroscopic observations of Virgo cluster dE galaxies in order to bring further observational constraints to the evolutionary scenarios of dE’s formation. Velocity fields and spatial distribution of the stellar population are most needed to check if counterparts of the observed kinematical sub-structures can be detected.
2.1 IC 3653
In this section we are presenting the first 3D observations of a dE. IC 3653 is a bright dE galaxy belonging to the Virgo cluster (Binggeli et al. 1985). In Tab 2.1 we summarize its main characteristics. IC 3653 was chosen because it is amongst the most luminous dE in Virgo and has a relatively high surface brightness. It is located 2.7 deg from the center of the cluster, i. e. 0.8 Mpc in projected distance. Its radial velocity 588 km s-1 (this work) confirms its membership to the Virgo cluster, the velocity difference from the mean velocity of Virgo (1054 km s-1, HyperLeda, Paturel et al. 2003 111http://leda.univ-lyon1.fr/) is nearly -470 km s-1. IC 3653 is located some 100 kpc in the projected distance from NGC 4621, a giant elliptical galaxy having a similar radial velocity value (410 km s-1, HyperLeda) With other low luminosity Virgo cluster members, in particular IC 809, IC 3652 for which the radial velocities have been measured, they may belong of a physical substructure of Virgo, crossing the cluster at 500 km s-1.
Velocity and velocity dispersion profiles from by Simien & Prugniel (2002) show some rotation. ACS/HST archival images from the Virgo cluster ACS survey (Côté et al.2004) are also available and will be discussed here.
| Name | IC3653, VCC1871 |
|---|---|
| Position | J124115.74+112314.0 |
| B | 14.55 |
| Distance modulus | 31.15 |
| A(B) | 0.13 |
| M(B)corr | -16.78 |
| Spatial scale | 82 pc arcsec-1 |
| Effective radius, | 6.7 arcsec 550 pc |
| , mag arcsec-2 | 20.77 |
| Ellipticity, | 0.12 |
| Sérsic exponent, | 1.2 |
| Heliocentric cz, km s-1 | 588 4 |
| , km s-1 | 80 3 |
| , km s-1 | 18 2 |
| 0.270.08 | |
| , Gyr (lum. weighted) | 5.20.2 |
| , dex (lum. weighted) | -0.060.02 |
2.1.1 Spectroscopic observations and data reduction
The spectral data we analyse were obtained with the MPFS integral-field spectrograph.
The Multi-Pupil Fiber Spectrograph (MPFS), operated on the 6-m telescope Bolshoi Teleskop Al’tazimutal’nij (BTA) of the Special Astrophysical Observatory of the Russian Academy of Sciences, is a fibre-lens spectrograph with a microlens raster containing square spatial elements together with 17 additional fibres transmitting the sky background light, taken four arcminutes away from the object. The size of each element is 1”1”. We used the grating 1200 gr mm-1 providing the reciprocal dispersion of 0.75 Å pixel-1 with a EEV CCD42-40 detector.
Observations of IC 3653 were made on 2004 May 24 under good atmosphere conditions (seeing 1.4”). The total integration time was 2 hours. The spectral resolution, as determined by analysing twilight spectra, varied from to over the field of view and the selected spectral range (4100Å– 5650Å). The resolution is lower in the centre of the field and it slightly increases toward top and bottom; there is also a smooth increase of the resolution in the red end of the wavelength range (Moiseev, 2001).
The following calibration frames were taken during the observations of IC 3653 with MPFS (as for any absorption line spectra):
-
1.
BIAS, DARK.
-
2.
”Etalon”: 17 night-sky fibres illuminated by the incandescent bulb. This frames are used to determine positions of spectra on the frame.
-
3.
”Neon” (arc lines): by exposing the spectral lamp filled with Ar-Ne-He to perform a wavelength calibration.
-
4.
The internal flat field lamp.
-
5.
A spectrophotometric standard ( for our observations), used to turn the spectra into absolute flux units.
-
6.
A standard for Lick indices and radial velocity ( and ), used also to measure instrumental response: asymmetry and width of the line-spread function.
-
7.
”SunSky”: twilight sky spectra for additional corrections of the systematic errors of the dispersion relation and transparency differences over the fibres.
Data reduction
The data reduction for integral-field spectroscopy (3D spectroscopy) is a quite elaborated procedure. We use the original IDL software package created and maintained by V. Afanasiev. We introduced some modifications in the package: error frames are created using photon statistics and then processed through all the stages to have realistic error estimates for the fluxes in the resulting spectrum. Besides we included an option to get spectra logarithmically rebinned in a wavelength, because it was necessary for the extraction of kinematics, and it allowed to avoid resampling the spectra twice.
The primary reduction process (up-to obtaining flux-calibrated data cube) consists of:
-
1.
Bias subtraction, cosmic ray cleaning. Cosmic ray cleaning implies the presence of several frames. Then they are normalized and combined into the cube (x,y,Num). The cube is then analysed in each pixel through ”Num” frames. All counts exceeding some level (5-) are replaced with the robust mean through the column. Then the cleaned cube is summed.
-
2.
Creation of the traces of spectra in the ”etalon” image. Accuracy of the traces is usually about 0.02 or 0.03 pixels.
-
3.
Flat field reduction and diffuse light subtraction. Flat field is applied to the CCD frames before extracting the spectra. The scattered light model is also constructed and subtracted from the frames during this step. It is made using parts of the frames not covered by spectra and then interpolated with low-order polynomials.
-
4.
Creation of the traces for every fibre. On this step the traces are determined for each fibre in the microlens block (presently 256 fibres) using the night sky fibres traces created on the 2-nd step and interpolation between them using the tabulated fibre positions.
-
5.
Spectra extraction. Using the fibre traces determined in the previous steps, spectra are extracted from science and calibration frames using fixed-width Gaussian (usually with FWHM=5 px for the present configuration of the spectrograph). The night sky spectra are also extracted from the science frames.
-
6.
Creation of dispersion relations. Spectral lines in the arc lines frame are identified and dispersion relations are computed independently for every fibre.
-
7.
Wavelength rebinning. All the spectra of night sky, object and standard stars are rebinned independently into logarithm of wavelength. The sampling on the CCD varies between 0.65 and 0.85 Å and we rebinned to a step of 40 km s-1, i. e. 0.55 to 0.75 Å, corresponding to the mean oversampling factor 1.2.
-
8.
Sky subtraction. Median vector of the night sky is computed using spectra of 17 night sky fibres. Then it is subtracted from each fibres after applying correction computed from dome flat and twilight sky flat. This is necessary because apertures of night sky fibers are twice the size of object fibres.
-
9.
Determination of the spectral sensitivity. Using the spectrophotometric standard star, the ratio between counts and absolute flux is calculated and then approximated with a high-order polynomial function over the whole wavelength range.
-
10.
Flux calibration of the data cube. The spectral sensitivity curve is used to perform the flux calibration. Finally, the values in the data cube correspond to the Å.
Spatial adaptive binning
Dwarf elliptical galaxies exhibit a decrease of surface brightness in peripheral parts, making difficult to obtain precise measurements of kinematics and Lick indices in every spatial element. In our data changes from 18.5 mag arcsec-2 in the centre down to 21.2 mag arcsec-2 in the outer parts of the field of view. At the same time, the signal-to-noise ratio at the central part is high enough () for detailed analysis, so smoothing the whole field spatially with the same window might destroy some important details there. To avoid these problems, the Voronoi adaptive binning procedure (Cappellari & Copin, 2003) can be applied. This technique was especially developed to work with the data coming from panoramic spectroscopy and its main idea is usage of variable bin size to achieve equal signal-to-noise ratio in every bin.
The result of Voronoi 2D binning procedure is a set of 1D spectra, for those all further steps of the analysis might be done independently. For the kinematical analysis we will use a target signal-to-noise ratio of 15, and for stellar population analysis we will use 30.
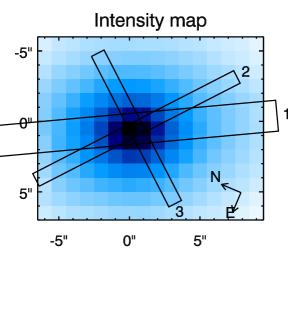
Besides we will be using a tessellation of the dataset containing only three bins (3-points binning hereafter): central condensation (3 by 3 arcsec region around the centre of the galaxy), elongated disky substructure (14 by 7 arcsec) oriented according to kinematics (see subsection 4, Fig 2.5, illustrating locations of bins and demonstrating spectra integrated in them) with the central region excluded, and the rest of the galaxy. Such a physically-stipulated tessellation allows to gain high signal-to-noise ratios in the bins in order to have high quality estimations of the stellar population parameters in the regions where populations are expected to differ. In Tab 2.2 we present the parameters of the resulting bins.
| Bin | Nspax | m(AB) | (AB) | S/N |
|---|---|---|---|---|
| P1 | 9 | 16.3 | 18.7 | 69 |
| P2 | 77 | 15.2 | 19.9 | 49 |
| P3 | 122 | 15.7 | 20.9 | 21 |
2.1.2 SSP age and metallicity derived from Lick indices
A classical and effective method of studying stellar population properties exploits diagrams for different pairs of Lick indices (Worthey et al., 1994). A grid of values, corresponding to different ages and metallicities of single stellar population models (instantaneous burst, SSP), is plotted together with the values computed from the observations. A proper choice of the pairs of indices, sensitive to mostly age or metallicity like H and Mg, allows to determine SSP-equivalent age and metallicity.
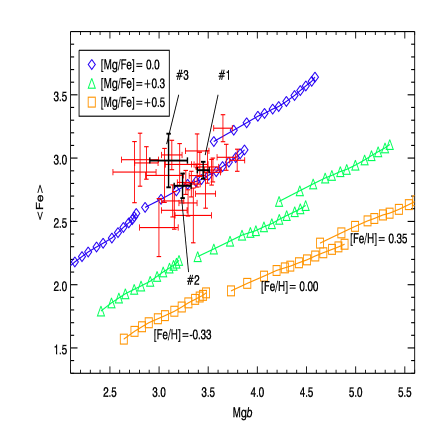
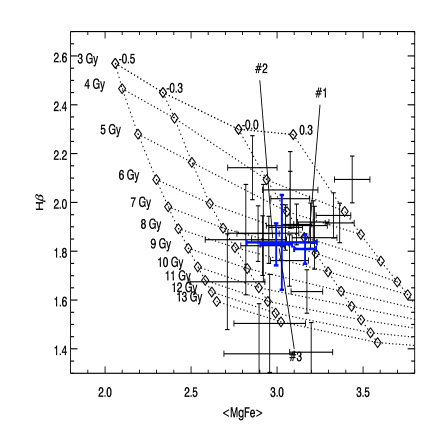
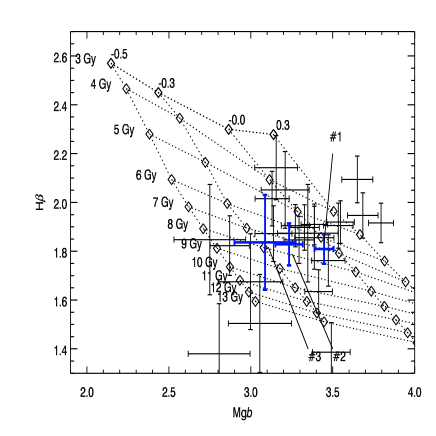
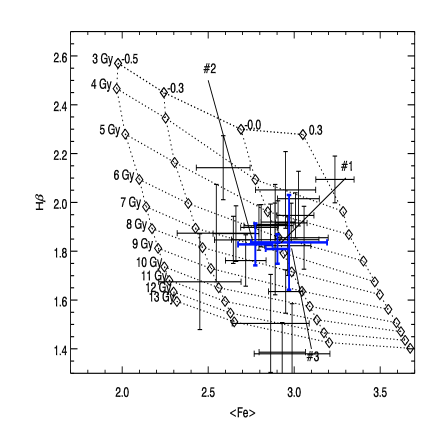
We use a grid of models computed with the evolutionary synthesis code: PEGASE.HR (Le Borgne et al., 2004). These models are based on the empirical stellar library ELODIE.3 (Prugniel & Soubiran 2001, 2004) and are therefore bound to the [Mg/Fe] abundance pattern of the solar neighborhood (see Chen et al. (2003) and references in it). To show that this limitation is not critical for our (low-mass) galaxies, Fig 2.1a presents the Mg versus Fe diagram with the models by Thomas et al. (2003) for different [Mg/Fe] ratios overplotted. These data allow to conclude that IC 3653 has solar [Mg/Fe] abundance ratio with a precision of about 0.05 dex.
We tried to use different metallicity tracers among the ”standard” set of Lick indices to see possible effects of abundance ratios: Mg, combined iron index FeFeFe5335, and ”abundance-insensitive” [MgFe] (Thomas et al. 2003). The statistical errors on the measurements of Lick indices were computed according to Cardiel et al. (1998).
| (a) | (b) |
 |
 |
| (c) | (d) |
 |
 |
On Fig 2.1c the popular pair, H-Mg is presented. The grid is constructed from the values of the corresponding indices measured on PEGASE.HR SSPs.
One of important disadvantages of Lick indices is their high sensitivity to missed/wrong values in the data, for example due to imperfections of the detector, or uncleared cosmic ray hits. A simple interpolation of the missed values (e.g. linear or spline) cannot be used, because if some important detail in the spectrum, e.g. absorption line, is affected, the final measurement of the index will be biased. Pseudo-continuum and index regions are defined as mean fluxes without possibility of weighting individual pixels (see equations 1, 2, and 3 in Worthey et al. 1994) Due to a defect of the detector, our data have a 3pixel wide bad region (hot pixels) in the middle of the blue continum of Mg. So, strictly speaking, we could not measure Mg at all, neither H on a significant part of the field of view.
As a workaround, we replaced all the missing or flaged values in the data cube by the corresponding values of the best-fitting model determined as explained in the next subsection.
In Tab 2.3 we present measurements of selected Lick indices for the 3-points binning. We see almost no population difference among three bins within the precision we reach. Age is around 6 Gyr, metallicity is about solar for ”P1”, and slightly subsolar for ”P2” and ”P3”.
| Name | bin 1 | bin 2 | bin 3 |
|---|---|---|---|
| Ca4227 | 1.062 0.080 | 0.874 0.190 | 0.689 0.700 |
| 1.096 | 1.020 | 1.092 | |
| G4300 | 5.106 0.135 | 5.042 0.313 | 6.923 1.040 |
| 4.995 | 4.820 | 4.979 | |
| Fe4383 | 5.794 0.176 | 4.940 0.389 | 6.251 1.243 |
| 4.861 | 4.458 | 4.696 | |
| Ca4455 | 1.187 0.089 | 1.096 0.186 | 0.750 0.561 |
| 1.336 | 1.235 | 1.313 | |
| Fe4531 | 2.858 0.125 | 2.326 0.260 | 1.595 0.777 |
| 3.499 | 3.367 | 3.457 | |
| Fe4668 | 6.070 0.181 | 5.776 0.361 | 5.685 1.025 |
| 5.114 | 4.602 | 4.808 | |
| H | 1.841 0.067 | 1.823 0.122 | 1.800 0.304 |
| 1.908 | 1.966 | 1.878 | |
| Fe5015 | 5.121 0.138 | 4.767 0.246 | 4.912 0.584 |
| (Ti) | 5.491 | 5.211 | 5.292 |
| Mg | 3.575 0.065 | 3.550 0.116 | 3.771 0.278 |
| 3.361 | 3.203 | 3.334 | |
| Fe5270 | 3.016 0.072 | 2.969 0.132 | 3.362 0.309 |
| 3.059 | 2.886 | 2.963 | |
| Fe5335 | 2.708 0.084 | 2.551 0.155 | 2.526 0.367 |
| 2.675 | 2.524 | 2.598 | |
| Fe5406 | 1.687 0.065 | 1.667 0.121 | 1.542 0.286 |
| 1.840 | 1.720 | 1.779 | |
| Fe | 2.930 0.075 | 2.852 0.138 | 3.128 0.325 |
| 2.952 | 2.785 | 2.861 | |
| MgFe | 3.236 0.070 | 3.182 0.127 | 3.435 0.301 |
| 3.150 | 2.987 | 3.089 |
| (a) | (b) | (c) | (d) |
|---|---|---|---|
 |
 |
 |
 |
 |
 |
 |
 |
There is no good age tracers in the MPFS spectral range, beside H and H. Good intermediate resolution age tracer, H+Mg+Fe125 (Vazdekis & Arimoto 1999) cannot be used in our case, because the required signal-to-noise ratio of about 100 at around Å cannot be achieved even after co-adding all the spectra in the data cube due to efficiency degradation of the spectrograph in the blue end of the spectral range.
Measurements of H are quite scattered (see Fig 2.1), resulting in age estimations in a wide range of values: from 4 Gyr to 13 Gyr.
One may notice also quite strong scattering of the points on the Mg - H diagram caused by the problems in the data (not all the spikes/dark pixels were marked as bad data and interpolated with the model).
One of the reasons (beside unmasked bad values in the data) might be presence of weak nebular emission lines in the spectrum of a galaxy: H index might be affected by emission in H, Mg – by [NI] (Å) laying on the red continuum definition region. Though we do not see significant emission line residuals when we subtract the best fitting model, we can not exclude completely this effect.
To improve the situation, we decided to measure Lick indices on the optimal templates fitted to the data. This approach may produce biased results in case of inconsistent abundance rations in the models and in the real stellar population, when Lick indices measurements will be bound to the model abundances. However, IC 3653 exhibits solar Mg/Fe abundance ratio (see Fig 2.1a), thus we do not expect biases.
We made inversions of the bi-index grids for three combinations of indices: Mg - H, [MgFe] - H, Fe - H. The results are presented in Fig 2.2. We used target signal-to-noise ratio of 30 at 5300Å for the tessellation procedure. The maps shown represent interpolated values of the parameters between intensity-weighted centres of the bins.
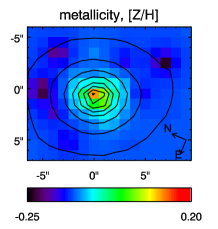
Metallicity distribution shows slight gradient from -0.15 dex at peripheral parts to +0.10 in the very centre (average error-bar on metallicity measurements using [MgFe] - H is 0.15 dex).
Age map contains no significant details, the median value for age using [MgFe] - H pair is Gyr. [MgFe] and Fe indices are not very age sensitive, thus age estimations depend mostly on values of H, and they are almost equal for all three inversions.
2.1.3 Stellar populations and internal kinematics using pixel fitting
Results: kinematics, age and metallicity maps
We applied Voronoi adaptive binning procedure to our data, setting the target signal-to-noise ratio to 15. Resulting tessellation includes 76 bins with sizes from 1 to 12 pupils. To get the better presentation one may interpolate the computed values of each parameter over the whole field of view using the intensity-weighted centroids of the bins as the nodes.
We measured the systemic radial velocity km s-1. The uncertainty includes possible systematic effects not exceeding 4 km s-1.
The fields of radial velocity and velocity dispersions are presented in Fig 2.3(d,e,f). The galaxy shows significant rotation and highly inclined disc-like structure. The uncertainties of the velocity measurements were estimated using Monte Carlo simulations and confirmed by a direct scan of the 3-dimensional space: fitting only multiplicative polynomial continuum on a grid of values of age, metallicity and velocity dispersion (see appendix for details). They depend on the signal-to-noise ratio and change from 2.5 km s-1 for the to 8 km s-1 for the .
The velocity dispersion distribution shows a gradient from 45-50 km s-1 near the maxima of rotation to 75 km s-1 in the core. Note a sharp peak of the velocity dispersion of 88 km s-1 slightly shifted to the south-west of the photometric core. The uncertainties of the velocity dispersion measurements are 3.8 km s-1 for the , 5.5 km s-1 for the , and 11 km s-1 for the .
The rotation velocity and velocity dispersion profiles are shown in Fig 2.4 (top pair).
The previous studies of IC 3653 were made using long-slit spectroscopy (Simien & Prugniel, 2002). No measurable rotation was found. This can be explained by poor atmosphere conditions during the observations (6 arcsec seeing). After the proper degrade of the spatial resolution of the MPFS data one could see a very good agreement with (Simien & Prugniel, 2002) both for radial velocity and velocity dispersion profiles (Fig 2.4, bottom pair).
 |
 |
 |
| (a) | (b) | (c) |
 |
 |
 |
| (d) | (e) | (f) |


 |
 |
| (a) | (b) |
| (c) |
 |
2.1.4 Photometry and morphology from ACS images
We have used ACS images from the HST archive, proposal 9401, ”The ACS Virgo Cluster Survey” by Patrick Côté. In Côté et al. 2004 the first analysis is given, but IC 3653 is not included. We have converted ACS counts into corresponding ST magnitudes according to the ACS Data Handbook, available on-line on the web-site of STScI.
We have fitted two-dimensional Sérsic profile using the GALFIT package (Peng et al. 2002). We can see significant positive residuals, representing the nucleus in the very centre (around 1.5 arcsec in size, central surface brightness ST mag arcsec2, slightly asymmetric and offcentered with respect to the centre of the Sérsic profile having n=1.88, =6.9 arcsec, and =0.11 (Sérsic index, effective radius, and ellipticity respectively; our values coincide with ones from Ferrarese et al. 2006). There are faint large-scale residuals as well, that can be explained by superposition of several components (at least two).
Then we have modeled images by elliptical isophotes with free center and orientation. We see some isophote twist and change of the ellipticity in the inner region of the galaxy. Main parameters of the model fitted are presented in Fig 2.6. The subtraction of the model from the original image does not reveal any internal feature.
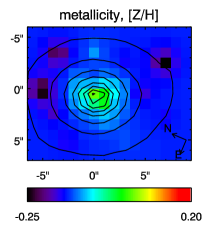
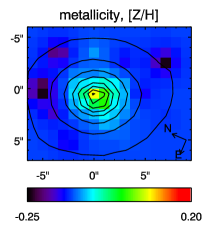
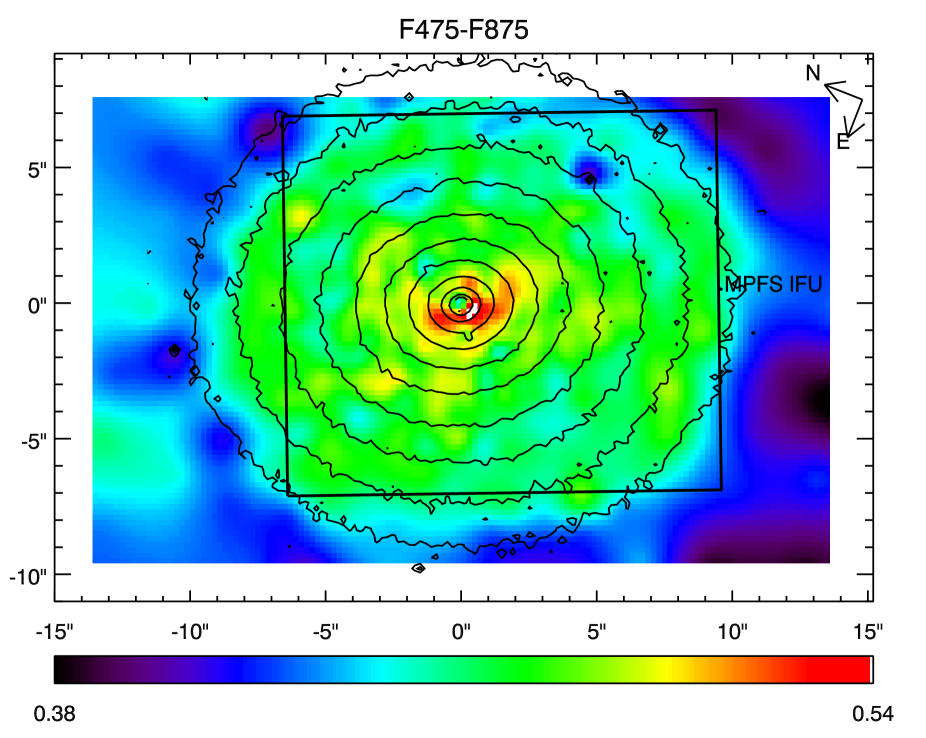
However, the F475-F875 colour map reveals the elongated structure (a/b 3.5) having size (major axis) of about 7 arcsec, and orientation coinciding with the kinematical disc-like feature. In Fig 2.7 the F475-F875 colour map is shown. It was obtained using Voronoi 2D binning technique applied to the F875 image in order to reach the signal-to-noise ratio of 80 per bin. Redder colour of the structure might be caused by slightly higher metallicity of the sub-population contained in it. However we do not see the elongated structure, but only metallicity gradient in maps obtained with MPFS, because of the bin size used to create stellar population maps, that is larger than for kinematics due to higher target S/N ratio used in the adaptive tessellation.
After that we re-fitted the surface brightness distribution with a Sérsic law with central region, corresponding to the disc-like structure, excluded. This fit leaves no significant residuals, and Sérsic exponent decreases to 1.22 – close to the exponential distribution. This value is given in Tab 2.1.
On the lower right plot in Fig 2.6 the light profile in F475 is shown with crosses. Solid line represents the best-fitting Sérsic profile for the whole galaxy excluding only very centre (inner 1 arcsec) with n=1.9, and dashed line gives the best-fitting (n=1.2) for the peripheral parts of the galaxy (beyond the disc found in the colour map).

2.1.5 Discussion
Both line-of-sight velocity field extracted from the MPFS data cube and colour map obtained from the HST imagery provide undoubted coinciding arguments for a presence of a faint internal co-rotating stellar disc embedded within a rotating spheroid. This is the main observational result from our study of IC 3653, which may be regarded as an edge-on counterpart of IC 3328, the dE with embedded spiral structure found by Jerjen et al. (2000). Authors stated there that spiral structure had low amplitude, about several per cent. However, estimating total mass of the small embedded stellar disc is much more complex and model-dependent task. If the similar stellar disc observed edge-on contains one to several tens of per cent of the stellar mass of the spheroid, it will be easily detected kinematically. At the same time, photometric appearance will strongly depend on the difference of stellar populations in disc and main spheroid.
In this subsection we will first compare the results of two methods for estimating stellar population parameters: Lick indices and pixel-fitting, then the characteristics of IC 3653 to other dE galaxies. Finally, we will review the different possible origins of the particular properties of this galaxy.
Comparison of two techniques for estimating stellar population characteristics
In Tab 2.4 we present comparison between SSP-equivalent age and metallicity obtained with the pixel fitting and inversion of bi-index grids for H-Mg, H-Fe, H-[MgFe] using index measurements on observed spectra and best-fitting templates.
One can notice particularly good agreement between the approaches. Ages derived from Lick indices appear to be slightly older, but the difference is not significant. The best agreement for both ages and metallicities is reached between pixel fitting and measurements of H and the combined [MgFe] index (Thomas et al. 2003). The internal precision of the parameters derived from pixel fitting is better those from Lick indices by a factor three to four, depending on the indices used. This can be explained by more optimal usage of the information, contained in the spectra, by the pixel fitting procedure. Though it is difficult to assess the reliability of these small error bars, the relative variations of age and metallicity can be trusted, even when the signal-to-noise ratio is as low as 10 per pixel (with MPFS spectral resolution and wavelength coverage).
| ”P1” | ”P2” | ”P3” | |
| tfit, Gyr | 4.93 0.20 | 4.95 0.30 | 4.97 0.70 |
| tHβ-Mgb | 7.04 1.56 | 6.97 1.47 | 11.25 6.02 |
| t | 7.02 1.33 | 7.28 2.20 | 6.08 3.94 |
| t | 7.11 1.65 | 6.88 1.89 | 6.70 5.11 |
| t | 5.27 1.56 | 5.13 1.47 | 4.85 6.02 |
| t | 5.15 1.33 | 4.30 2.20 | 4.23 3.94 |
| t | 5.22 1.65 | 4.12 1.89 | 4.15 5.11 |
| Zfit, dex | 0.03 0.01 | -0.14 0.02 | -0.17 0.05 |
| ZHβ-Mgb | -0.05 0.09 | -0.18 0.08 | -0.34 0.24 |
| Z | -0.02 0.04 | -0.10 0.05 | 0.03 0.13 |
| Z | -0.04 0.05 | -0.14 0.06 | -0.11 0.15 |
| Z | -0.02 0.09 | -0.14 0.08 | -0.16 0.24 |
| Z | 0.02 0.04 | -0.14 0.05 | -0.17 0.13 |
| Z | 0.00 0.05 | -0.13 0.06 | -0.16 0.15 |
Properties and nature of IC 3653
We computed the position of IC 3653 on the fundamental plane (FP, Djorgovski & Davis 1987). ”Vertical” deviation from FP (, Guzman et al. 1993) is . Such a deviation places IC 3653 into the centre of the cloud, representing dE galaxies in Fig 2 (left) in De Rijcke et al. 2005, and exactly on the theoretical predictions by Chiosi & Carraro (2002) and Yoshii & Arimoto (1987), overplotted on the same figure.
The mean age of the stellar population of IC 3653, Gyr, coincide with the mean age of dE galaxies in Virgo ( Gyr, Geha et al. (2003); Gyr, Van Zee et al. 2004b). However metallicity of the main body, is slightly higher (, Geha et al. (2003); , Van Zee et al. 2004b) that does not look strange keeping in mind that IC 3653 is more luminous than most of the galaxies in the samples of Geha et al. (2003), and Van Zee et al. (2004b).
We see that fundamental properties of IC 3653 do not differ from typical dE galaxies, though the effective radius is one of the smallest within the samples of Virgo dE’s presented in Simien & Prugniel (2002), Geha et al. (2003), and van Zee (2004a).
We derived the B-band mass-to-light ratio of IC 3653 following the method by Richstone & Tremaine (1986) as . Based on the model by Worthey (1994) the luminosity weighted age and metallicity we found can be translated into the stellar mass-to-light ratio assuming Salpeter initial mass function. This value is more than twice lower than the dynamical estimate, meaning that either the simple dynamical model overestimates mass by a factor of two, or IC 3653 has a dark matter halo.
Recent theoretical studies based on N-body modelling of the evolution of disc galaxies within a CDM cluster by Mastropietro et al. (2005) suggest that discs are never completely destroyed in cluster environment, even when the morphological transformation is quite significant. Our discovery of the faint stellar disc in IC 3653 comforts these results. Thus, one of the possible origins of IC 3653 is morphological transformation in the dense cluster environment from late-type disc galaxy (dIrr progenitor). Gas was removed by means of ram pressure stripping and star formation was stopped. This process must have finished at least 5 Gyr ago, otherwise we would have seen younger population in the galaxy. However, duration of the star formation period must have been longer than 1 Gyr, otherwise deficiency or iron (i.e. Mg/Fe overabundance) would have been observed. Within this scenario, metallicity excess in the disc can be explained by a slightly longer duration of the star formation episode compared to the spheroid. But we cannot see the difference in the star formation histories (even luminosity weighted age), because of insufficient resolution on the stellar population ages.
Another way to acquire a disc having higher metallicity than the rest of the galaxy is to experience a minor dissipative merger event (De Rijcke et al. 2004). This is rather improbable for a dwarf galaxy, but cannot be completely excluded. In particular, kinematically decoupled cores, recently discovered in dwarf and low-luminosity galaxies (De Rijcke et al. 2004, Geha et al. 2005, Prugniel et al. 2005, Thomas et al. 2006) can be explained by minor merger events.
The most popular scenario which is usually considered to explain formation of embedded stellar discs in giant early-type galaxies is star formation in situ after infall of cold gas onto existing rotating spheroid, e.g. from a gas-rich companion (cross-fueling). Just this scenario has been used by Geha et al. (2005) to explain counter-rotating core in NGC 770, a dwarf S0 which is more luminous than IC 3653 ( mag) and located close to a massive spiral companion NGC 772 ( mag) in a group. In NGC 127 ( mag), another galaxy, being a nearby satellite of a giant gas-rich NGC 128, we observe the process of cross-fueling at present (see Chapter 3). Group environment, where relative velocities of galaxies are rather low, favours of the interaction processes on large timescales, such as smooth gas accretion.
Our data on IC 3653 cannot provide a decisive choice between those alternatives. However, from a general point of view, dynamically hot environment of the Virgo cluster with high relative velocities of member galaxies does not conduce to the slow accretion of cold gas. IC 3653 is not a member of a subgroup including large galaxies, which can foster gaseous disc, so we believe that in this particular case the scenario of slow accretion is not applicable.
At present, the sample of objects where disc-like sub-structures were searched either from images or integral field spectroscopy is still too small to draw statistical conclusions. But it is quite probable that progenitors of the dE’s were disc galaxies (pre-dIrr or small spiral galaxies) and that they evolved due to feedback of the star formation and environmental effects. Present dIrr also experienced feedback but kept their gas, so it is unlikely that the feedback alone can remove the gas. Therefore environmental effects are probably the driver of the evolution of dE’s, and the discovery of stellar discs in dE’s is consistent with this hypothesis.
2.2 Young nuclei in Virgo dE’s
Young nuclei are a frequent phenomenon in the giant early-type galaxies (Sil’chenko 1997, Vlasyuk & Sil’chenko 2000) observed both in clusters and groups (Sil’chenko 2006). However, there were no detections of young circumnuclear structures in dwarf elliptical/lenticular galaxies, probably because of difficulties observing them due to low surface brightness. To reach high signal-to-noise ratios, sufficient for the stellar population analysis using classical approach by measuring Lick indices (Worthey et al. 1994), integration time must be order of several hours with large telescopes. In addition, integral field spectroscopy is an essential technique for reliable detections of such structures. However no attempts have been made so far to observe even small samples of dE galaxies with IFU spectrographs, but only individual objects (Geha et al. 2005).
We have started a project of observing a sample of dE galaxies in cluster and groups using the Multi-Pupil Fiber Spectrograph on the Russian 6-m telescope.
2.2.1 Observations and data reduction
The spectral data we analyse were obtained with the MPFS integral field spectrograph. We used the same setup of an instrument, as for observations of IC 3653. Parameters of the observations are summarized in the Table 2.5.
| Object | Dates | Total exp.time | Seeing |
|---|---|---|---|
| IC 783 | 21,23 May 2004 | 3.5h | 2” |
| IC 3468 | 20 March 2004 | 2.5h | 1.5” |
| IC 3509 | 10,12 May 2005 | 3.5h | 1.7” |
Data have been reduced and analysed using techniques, described in a section devoted to IC 3653. Target signal-to-noise ratios used in the Voronoi 2D binning procedure were between 15 and 20.
”2-bins” tesselation was also applied to all three galaxies. It contains two bins: central young embedded structure, and the rest of the galaxy.
For two galaxies: IC 3468 and IC 3509 we have used results of analysis of ACS images from the HST archive, proposal 9401, ”The ACS Virgo Cluster Survey” (P.I.: P. Côté), presented in Ferrarese et al. (2006). For IC 783 we have used light and colour profiles available through the GOLDMine database (Gavazzi et al. 2003).
2.2.2 Stellar population and internal kinematics
| Object | Gyr | dex | |
|---|---|---|---|
| IC 783 (core) | |||
| IC 783 (out.) | |||
| IC 3468 (disc) | |||
| IC 3468 (out.) | |||
| IC 3509 (core) | |||
| IC 3509 (out.) |
IC 783
This galaxy was found to have a remarkable spiral structure (Barazza et al. 2002). IC 783 exhibits rotation ( km s-1, see also Simien & Prugniel, 2002). Velocity dispersion field is flat ( km s-1) and does not show any significant features.
We discover a young nucleus in this galaxy, having luminosity-weighted stellar population parameters: Gyr, dex, compared to the main body (containing the spiral structure) Gyr, dex. Young nucleus in IC 783 remains spatially unresolved. The B-band mass-to-light ratio for the stellar populations according to Worthey (1994) are: for the core, and for the rest.
| (a) | (b) |
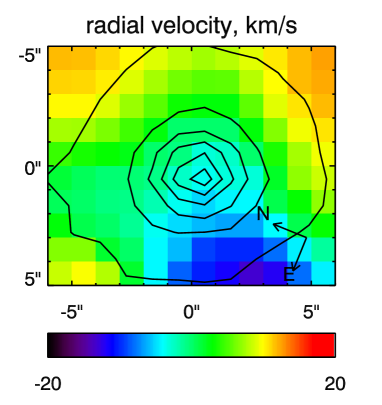 |
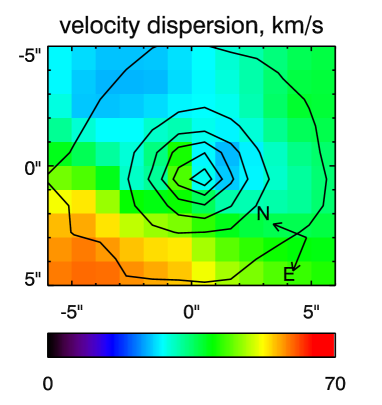 |
| (c) | (d) |
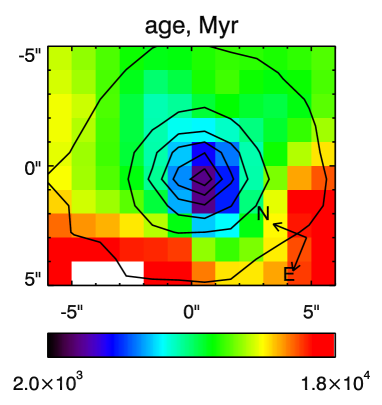 |
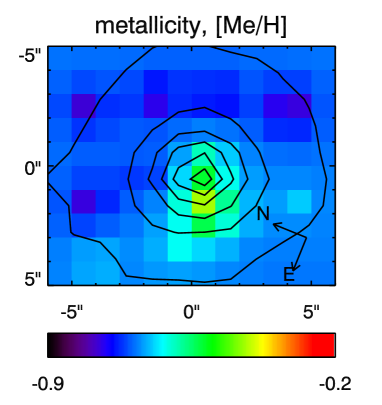 |
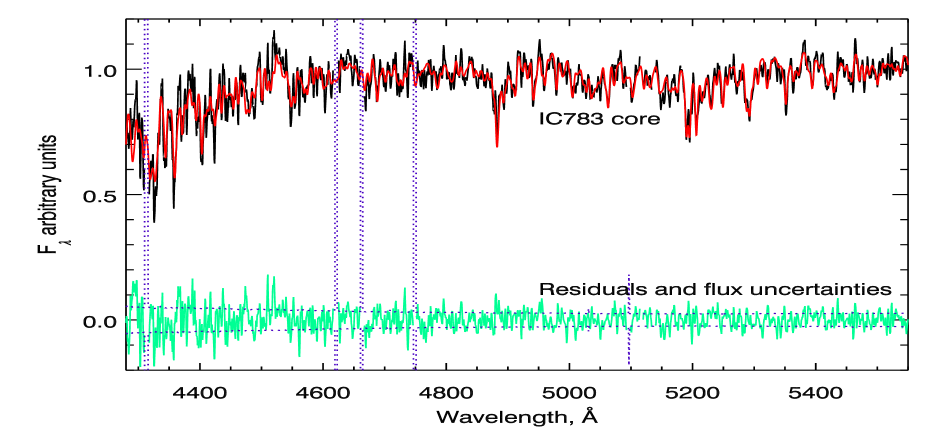
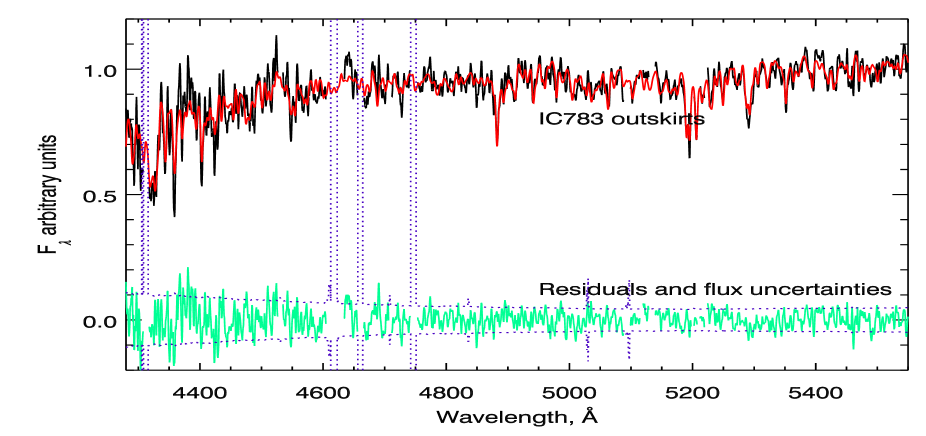
IC 3468
An embedded structure is known to present in IC 3468 (Barazza et al. 2002). The question on the nature of this substructure was left open, because no rotation was detected in long-slit spectroscopy by Simien & Prugniel (2002). However, we found a complex kinematics – rotation along two non-perpendicular directions (NW-SE, and NE-SW separated by 60 degrees), none of them coinciding with the position of the slit from Simien & Prugniel (2002). Unsharp masking of HST ACS imagery reveals elongated structure in the central region of the galaxy. By varying the smoothing radius for unsharp masking, different parts of this structure can be revealed.
In the map of luminosity-weighted age, an elongated substructure having Gy, coinciding with one of the rotating components (NW-SE) is clearly seen. It is roughly 3.3 Gy younger than the rest of the galaxy ( Gy). One may also notice a ”blue stripe” in the velocity dispersion distribution (lower by 10 km s-1 compared to mean values) having the same locus. Based on these results we conclude that NW-SE rotation corresponds to a moderately inclined stellar disc (). Rotational velocity is km s-1 at 7 arcsec from the centre, but we cannot be sure to reach the maxima of rotation – wider-field observations are needed.
Surprisingly, this disc almost does not affect the metallicity distribution. Luminosity-weighted metallicity exhibits relatively smooth map ( dex) with a slight gradient towards the centre (up to dex).
The B-band mass-to-light ratios of the stellar populations are: for the disc and for outskirts. Our estimates of the luminosity-weighted age and metallicity in the centre of IC 3468 are consistent with the g’-z’ colour of the compact nucleus (averaged within the host galaxy over the aperture corresponding to the seeing conditions) provided in Ferrarese et al. (2006)
| (a) | (b) |
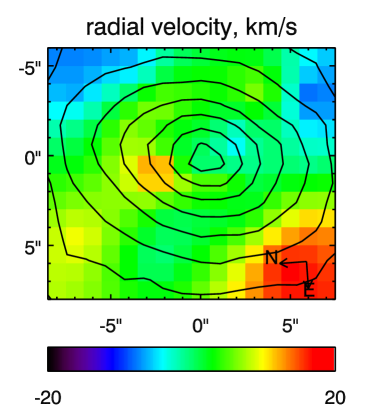 |
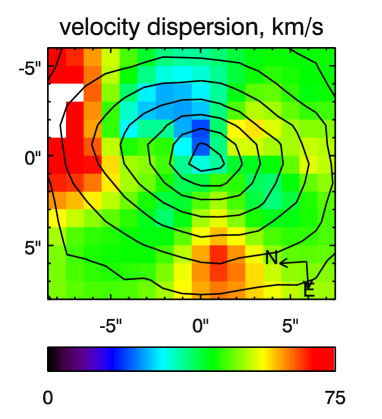 |
| (c) | (d) |
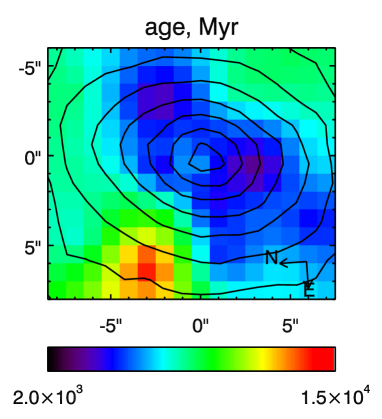 |
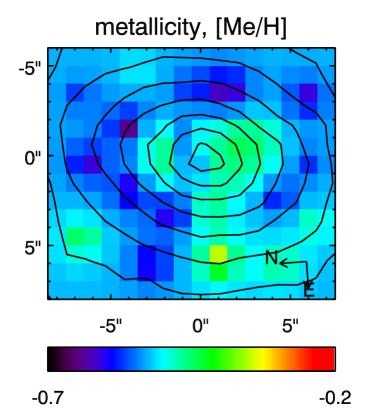 |
IC 3509
When we were selecting the targets for observations, IC 3509 was chosen as a ”prototypical” dE galaxy, classified as a galaxy without nucleus in Binggeli et al. (1985). We did not expect to find unusual kinematics and/or stellar populations in this object. However, we detected a kinematically decoupled central region, rotating ( km s-1) in the perpendicular direction to the major axis, where significant rotation is also seen ( km s-1). This structure is associated with a dip in the velocity dispersion distribution (50 km s-1 compared to 75 km s-1) and a metallicity gradient of about 0.2 dex per 4 arcsec. Stellar population of the galaxy is relatively old and metal-poor ( Gyr, dex, ) In the very centre of the galaxy we see a spatially unresolved young ( Gyr) metallic ( dex) nucleus ().
We applied unsharp masking technique to the HST imagery available from the Virgo ACS Survey (Cotê et al. 2004) with different smoothing radii. No fine structures have been revealed.
Kinematical appearance quite similar to IC 3509 was observed earlier in giant early-type galaxies, for example, in NGC 5982 (Statler 1991). An explanation was proposed, which did not require presence of dynamically distinct structures – projection of orbits in the triaxial potential. Based on quite regular (except the very centre) maps of stellar population parameters of IC 3509 we conclude that the galaxy outside the core region can be represented by a single-component triaxial ellipsoid.
As in the case of IC 3468, for IC 3509 nucleus, the g’-z’ colour reported by Ferrarese et al. (2006) is consistent with our stellar population parameter estimations.
| (a) | (b) |
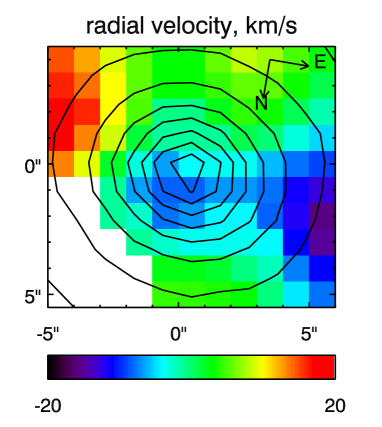 |
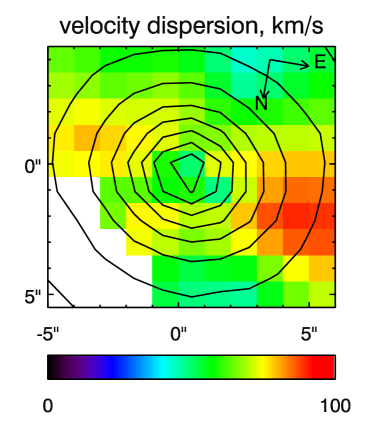 |
| (c) | (d) |
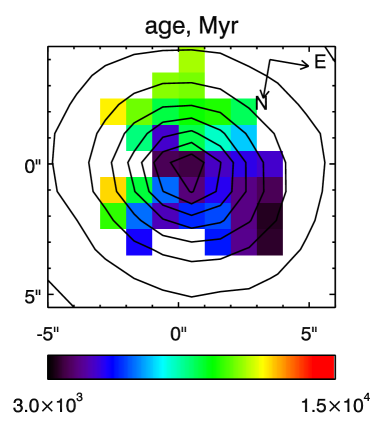 |
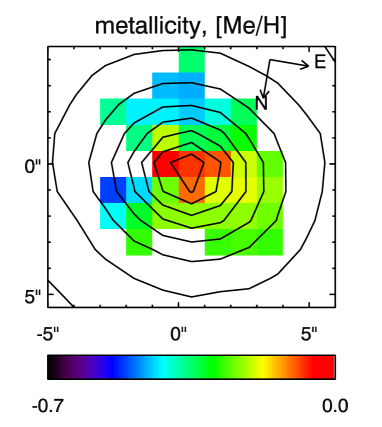 |
2.2.3 Discussion
Since first discoveries of chemically (Sil’chenko et al. 1992) and evolutionary (Sil’chenko 1997, Vlasyuk & Sil’chenko 2000) decoupled cores in giant early-type galaxies, no attempts of modelling their formation and evolution were made. Usual explanation of this phenomenon is a dissipative merger event. Whereas merger is an established scenario of formation for giant early-type galaxies, normally it is considered as improbable for dwarfs because of their little sizes.
However, presence of embedded disc in IC 3468 is an important argument for a merger scenario. Kinematically decoupled structures, associated with young metal-rich stellar population is consistent with a hypothesis of dissipative merger event which took place several Gyr ago. Dissipative merger is expected to trigger a starburst that consumes available gas, leading to a KDC that is younger than the host galaxy.
Another possibility is effects of ram pressure stripping. Efficiency of ram pressure stripping depends on the density of the region being stripped: higher density results in lower efficiency (Gunn & Gott, 1972; Abadi et al. 1999). Thus, it might happen that in the dense nucleus of a dwarf galaxy gas will not be removed. A similar phenomenon of gaseous disc truncation is observed in giant spiral galaxies in the Virgo cluster (Cayatte et al. 1994, Kenney & Koopmann 1999) and modelled by Abadi et al. (1999).
A possible scenario to acquire a structure observed in IC 783 (full absence of gas and young nucleus without obvious evidences of kinematical decoupling) is multiple crossings of the cluster centre. IC 783 is located on the projected distance of 1.1 Mpc from the centre of the Virgo cluster. Thus its orbital period is at least 4.5 Gyr (assuming mass of the cluster of M⊙). Gas of IC 783 can be depleted in the disc during the first passage, but preserved in the inner dense nucleus, because intercluster medium density and/or velocity of the galaxy might be not sufficient to remove gas completely.
To remove gas and stop star formation in the core we may assume that during the second crossing several Gyr later the intracluster orbit of the galaxy might be transformed into more elongated one, say due to casual encounter with a massive galaxy, so would increase (and as well, because the galaxy would pass closer to the centre of the cluster), resulting in ram pressure reaching sufficient value to strip the nuclear region of the galaxy completely.
Alternative possibility of varying efficiency of ram pressure stripping for IC 783 might be explained by its belonging to Messier 100 group. IC 783 is located at some 90 kpc of projected distance from M 100, and radial velocity difference of 270 km s-1 is an argument for their interaction. The M 100 group is believed to have crossed the Virgo cluster centre recently (Binggeli et al. 1987). Assuming that it is passing near its apocentre now the orbital period of M 100 group in the cluster turns to be about 5–8 Gyr, thus the recent passage of the cluster centre took place some 3–4 Gyr ago, and the previous one around 8–12 Gyr ago. On the other hand, the orbital period of IC 783 with respect to M 100 should be around 1 Gyr. Thus if the orbital velocity of IC 783 was counter-directed to the orbital motion of M 100 in the cluster during the first passage of the central region, and co-directed during the second one, the ram pressure value might differ by a factor of 3.5 (assuming the maximum velocity of M 100 with respect to the Virgo intracluster medium to be km s-1 and the orbital velocity of IC 783 with respect to M 100 to be km s-1). The coincidence of the estimated dates of the cluster centre crossing by the M 100 group with the ages of two subpopulations in IC 783 is a strong argument for this scenario.
Ram pressure stripping during repetitive crossings of the cluster centre may be considered as a possible explanation of young metal-rich cores in the low-luminosity early type galaxies. Depending on the orbital parameters for a particular galaxy, one would expect large scatter of ages/metallicities of these substructures with respect to their host galaxies.
Good agreement between our estimations of the stellar population parameters and g’-z’ colours in the nuclei of IC 3468 and IC 3509 may be considered as an evidence for the presence of young metal-rich stellar populations in all compact blue nuclei of dE galaxies. However, this hypothesis may only be proved by the forthcoming observations.
Chapter 3 dE galaxies in groups
In this chapter we present 3D spectroscopic observations of two quite unusual dwarf galaxies in groups to demonstrate how different environmental conditions may affect their evolution.
Parameters of observations presented in this chapter are summarised in Table 3.1.
| Name | Date | seeing | S/Ncent | ||
|---|---|---|---|---|---|
| NGC 770 | 2004/Oct/07 | 2” | 2h | 50 | 100 |
| NGC 126 | 2006/Sep/07 | 1.3” | 1h 20m | 25 | 100 |
| NGC 127 | 2005/Oct/01 | 1.5” | 2h | 20 | 90 |
| NGC 130 | 2005/Oct/02 | 2” | 1h 30m | 25 | 120 |
3.1 NGC 770 (NGC 772 group)
NGC 770 is a low-luminosity elliptical ( = 18.2) companion to the large spiral galaxy NGC 772, and the brightest satellite galaxy identified in this system by Zaritsky et al. (1997). The parent spiral galaxy NGC 772 () is listed in the Atlas of Peculiar Galaxies (Arp 78; Arp, 1966) and known to contain a prominent asymmetric spiral arm. Radial velocity of NGC 772 according to Zaritsky et al. (1997) is 2468 km s-1 results in a distance of 33 Mpc assuming km s-1 Mpc-1.
Luminosity of NGC 770 (M) and its velocity dispersion (110-120 km s-1) place it between giants and dwarfs. Spectroscopy of NGC 770 does not reveal presence of emission lines, though neutral hydrogen is detected (Geha et al. 2005). Very good signal-to-noise ratio in the MPFS data allows precise measurements of all the parameters ( km s-1). Good sampling of LOSVD due to high velocity dispersion allows to measure and Gauss-Hermite coefficients.
We see impressive kinematically decoupled core in this object. This kinematical decoupling has been recently reported by Geha et al. (2005). There are following evidences for considering it to be a counter-rotating young metal-rich highly inclined stellar disc aligned almost with the major axis of the galaxy:
-
•
unsharp masking reveals presence of embedded structure (Geha et al. 2005);
-
•
velocity dispersion map shows larger values on the ”switches” of the velocity, there is a stripe with lower values orthogonal to the structures in age/metallicity distributions;
-
•
map of coefficient shows regions with positive and negative values before and after ”switch” of the velocity;
-
•
age and metallicity distributions clearly show the decoupled structure aligned almost along the major axis having younger age ( Gyr vs 7 Gyr) and higher metallicity ( vs ) than the surrounding spheroid.
We consider two possibilities to acquire such a KDC: (1) a partially dissipative merger event, that induced a burst of star formation some 4.5 Gyr ago producing the central stellar structure that we see now as a counter rotating subpopulation with the high metallicity; (2) dissipative accretion of the gas from the nearby giant gas-rich NGC 772. In the next section we demonstrate evidences for ongoing gas accretion on another possible dE progenitor (NGC 127), which is an indirect argument for the second possibility of KDC formation in NGC 770.
| (a) | (b) | (c) |
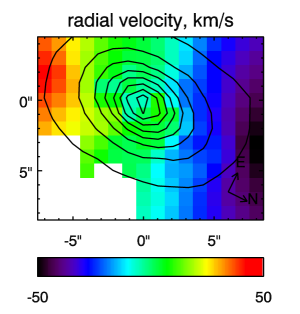 |
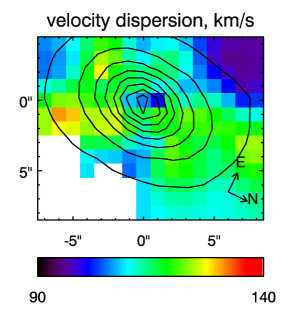 |
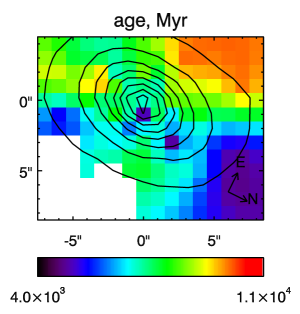 |
| (d) | (e) | (f) |
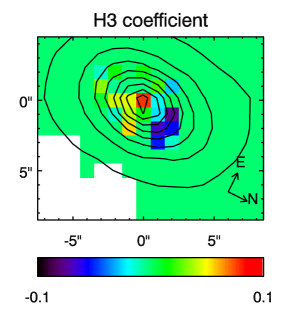 |
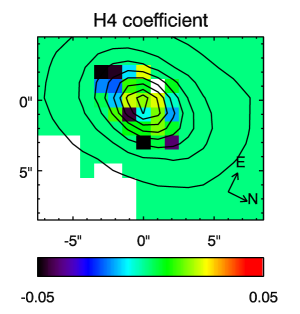 |
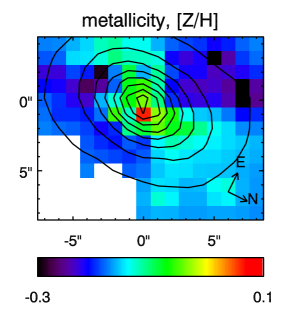 |
3.2 NGC 127 (NGC 128 group)
NGC 128 group is located some 55 Mpc away (assuming km s-1). It includes (spectroscopically confirmed membership): giant gas-rich S0 galaxy NGC 128, giant early-type spiral NGC 125, three low-luminosity lenticulars in the vicinity of NGC 128 (closer than 100 kpc in the projected distance): NGC 126 (), NGC 127 (), and NGC 130 (), and a handful of late-type spirals located beyond 300 kpc from the centre of the group.
NGC 128 is a giant lenticular galaxy with a peanut-shaped bulge. It is known to have a gaseous disc counter-rotating to the stars (Emsellem & Arsenault, 1997). Faint gaseous tail is seen in the direction of NGC 127 (3.2).
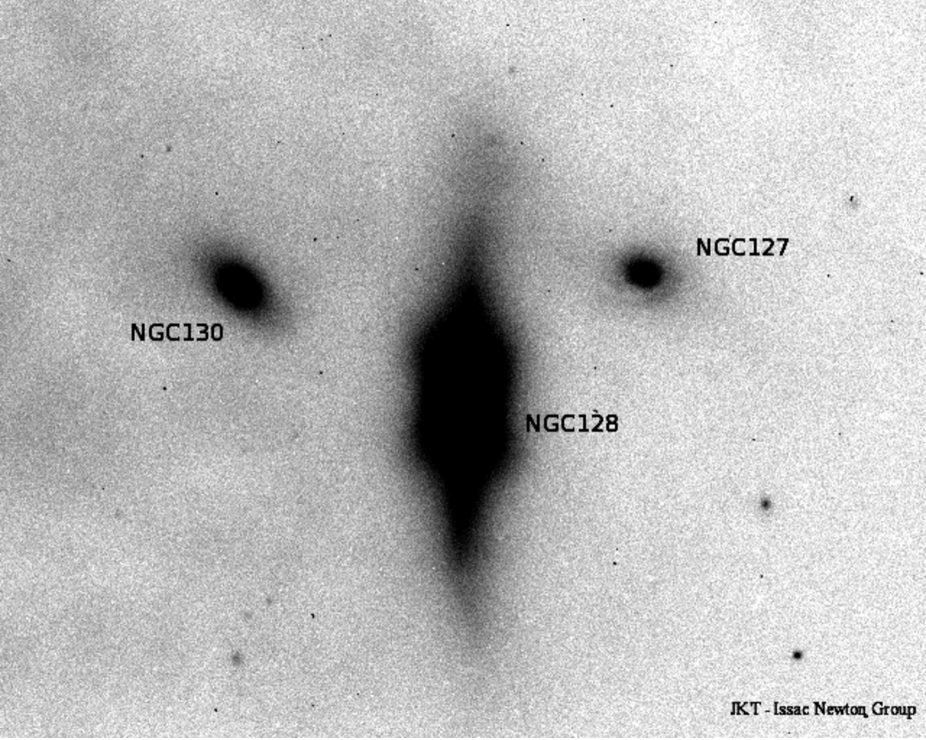
We have obtained MPFS observations for all three low-luminosity early-type galaxies in the group: NGC 126, NGC 127, and NGC 130 during two observing runs: in October 2005 and September 2006.
NGC 126 and NGC 130 show no evidence of emission lines, exhibit relatively old stellar population (5…7 Gyr) with nearly solar metallicity and quite regular kinematics. Here we are not discussing these two objects, because they look quite similarly to what is observed in the clusters, and their evolution was probably ruled by the same mechanisms.
On the contrary, NGC 127, located about 1 arcmin away from the centre of NGC 128 (16 kpc in the projected distance) is a gas-rich object, having early-type morphology (according to NED, HyperLeda). Its spectrum provides evidence for ongoing star formation event. Using MPFS data we are able to study both stellar and gas kinematics, and give estimates for stellar population parameters. A dust lane is seen on the JKT image south of the NGC 127 core (see Fig. 3.2).
Luminosity-weighted age of NGC 127 appears to be around 1 Gyr, with a slight gradient from 1.5 in the outskirts to 0.8 in the centre. Metallicity is supersolar ([Fe/H]=+0.2 dex) everywhere except the very centre of a galaxy, where it exhibits minimum (-0.1 dex). However, taking into account that we are not including additive continuum terms in the fitting procedure, this might be connected to a strong contamination by the nebular continuum, increasing the continuum level and leading to biased metallicity estimates (see Chapter 1). Fitting was done after masking regions of emission lines: , , [OIII], and [NI]. Residuals contain almost flat zero-level continuum and emission lines.
Velocity field of gas was computed by fitting a single component Gaussian, convolved with the instrumental response of MPFS into H emission into the residuals of stellar population fit. Rotation velocity of gas is higher (100 km s-1) than of stars (40 km s-1). Velocity field of gas shows asymmetry on the south-eastern part of NGC 127 (direction of NGC 128): in that region is 20 km s-1 higher by absolute value than in the symmetric north-western part, reaching nearly -60 km s-1 6 arcsec south-east of NGC 127 core. This asymmetry might be caused by perturbed motions of gas near the region, where the flow reaches NGC 127.
Difference in radial velocities of NGC 127 and NGC 128 is -160 km s-1. Taking into account the presence of a gaseous bridge between them and kinematical appearance of NGC 127, we are proposing the following scenario: NGC 127 has recently passed its pericentre, and now we observe an infall of gas from NGC 128 onto NGC 127. Such a process might have lead to the counter-rotating core as observed in NGC 770 if the orientation of angular momentum of gas was different. If one imagines appearance of NGC 127 after gas removal and several Gyr of passive evolution, it will be indistinctive from ”normal” dE galaxies by morphology and luminosity (its absolute magnitude will become 2 mag fainter), but only by relatively high metallicity.
| (a) | (b) | (c) |
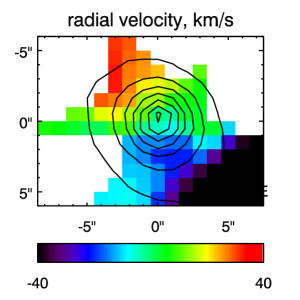 |
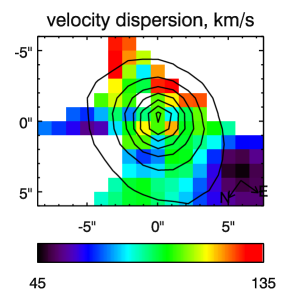 |
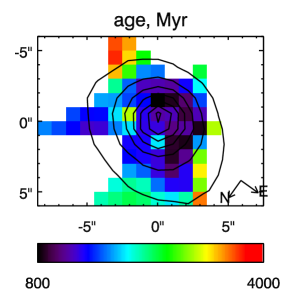 |
| (d) | (e) | (f) |
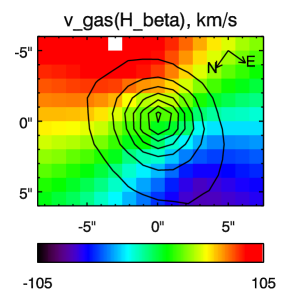 |
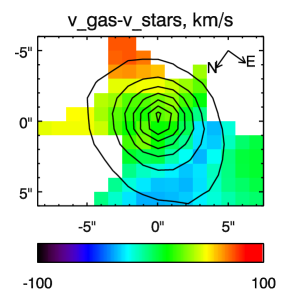 |
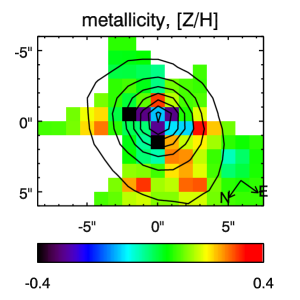 |
| (g) |
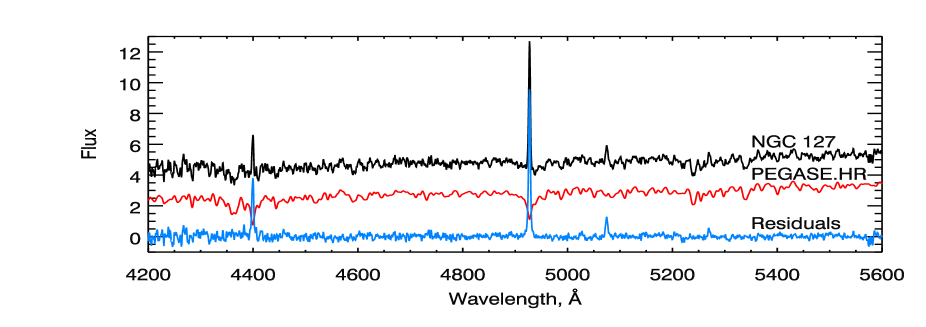 |
The process of slow accretion which is quite favourable in groups of galaxies, where relative velocities are rather low, appears to be improbable scenario for formation of embedded structures in dE’s residing in regions of the Universe with higher density, such as clusters of galaxies.
Chapter 4 Studies of galaxies in Abell 496
Abell 496 is a richness class 1 cluster (Abell 1958) of cD type (Struble & Rood 1987) at a redshift of 0.0335 (Durret et al. 2000 and references therein). For a Hubble constant H0=72 km s-1 Mpc-1 the distance modulus is 35.71 () and the corresponding scale is 40.4 kpc/arcmin. Abell 496 is a cluster with several hundred measured galaxy redshifts. The analysis of the distribution of 466 redshifts in the direction of this cluster has revealed the existence of several structures along the line of sight; however, the redshift distribution of the 274 galaxies found to belong to the cluster itself implied that Abell 496 has a regular morphology and a well relaxed structure (Durret et al. 2000). This is confirmed by X-ray data: the X-ray map obtained from XMM-Newton observations is indeed quite regular, contrary to most clusters where even if the X-ray emissivity map appears regular, the temperature map of the X-ray emitting gas does not (Durret et al. 2005).
4.1 Observations and Data Reduction
4.1.1 Imaging observations and reduction
Images were obtained at the Canada France Hawaii Telescope with the Megacam camera in the fall of 2003 (program 03BF12, P.I. V. Cayatte). Megacam covers a field of 1 on the sky, with a pixel size on the sky of 0.187 arcsec. Deep images were obtained in the u, g, r and i filters.
These images were reduced in a usual way (bias and flat field corrections, photometric and astrometric calibrations) by the staff of the Terapix data center at IAP, France. The SExtractor software was run on the r image (that with the best seeing) to detect objects and measure their positions and magnitudes. In particular, magnitudes within a 1.2 arcsec diameter were measured, in order to prepare Giraffe observations (see below).
Stars were then discarded based on a diagram of aperture minus total magnitude versus total magnitude for r21. Above this magnitude, all objects were kept in our galaxy sample. A photometric redshift code was kindly applied by O. Ilbert to our catalogue to try eliminating background galaxies. Finally, the galaxies observed with Giraffe were taken from this imaging catalogue, with a magnitude within a diameter of 1.2 arcsec in the r band (r1.2) in the [17.5-22] interval.
4.1.2 Spectroscopic observations and reduction
Spectra were obtained at the ESO Very Large Telescope with the Giraffe instrument with the L682.2 configuration on the nights of 8-9/12/2004. The Giraffe field of view is 20 arcmin in diameter, with a total number of fibres of 130; each fiber has an aperture on the sky of 1.3 arcsec in diameter. The 600 lines/mm grating has been used in the LR4 setup giving a resolving power about in the wavelength range 5010-5831Å.
The first night four exposures have been obtained during 2700, 3300, 2351 and 1699 seconds. The second nights four other exposures have been added with the same positioner configuration file and effective duration of 2700, 3300 X 2 and 4200 seconds. During the day, the exposures of bias, flats and comparison lamps for the wavelength calibration have been done in the same setup and with the two separate sets of MEDUSA fibers. The description of GIRAFFE instrument can be found in Pasquini, L. et al., 2002 (The Messenger, 110, 1). The spectra were extracted and calibrated using the Python version of BLDRS - Baseline Data Reduction Software (girbldrs-1.12) available from http://girbldrs.sourceforge.net and with functions and recipes description in the BLDRS Software Reference Manual, Doc. No. VLT-SPE-OGL-13730-0040 (Issue 1.12, 20 Septembre 2004). When needed art of the reduction have been done using IRAF as well as redshift determination. The processing includes bias subtraction, diffuse light estimation and remove, localisation and extraction, correction for the fiber transmission variations, wavelength calibration, division by the continuum lamp spectrum and sky subtraction.
The observed galaxies were taken from the catalogue described above, with the following priorities: top priority: objects with 17.5r; middle priority: objects with 20.75r; low priority: objects with 21.5r. 112 galaxy spectra were thus obtained (some fibers had to be used for guide stars and sky spectra).
Individual 1D spectra were combined with the IRAF software and redshifts were measured with the rvsao.xcsao package in IRAF, using various star templates. Redshifts were also measured through the stellar population synthesis fit described in this work, and both values agreed within their uncertainties.
Our star-galaxy separation came out to be very good, since no stars were observed. On the other hand, the rejection of background objects based on photometric redshifts was not very efficient, since only 52 out of 112 galaxies with measurable redshifts actually belong to the cluster. 46 of those 52 have sufficient signal-to-noise ratios for analysis of kinematics and stellar population properties.
Absolute magnitudes is computed using distance modulus mentioned above. All magnitudes are corrected for intergalactic extinction according to Schlegel et al. 1998.
4.2 Stellar Population Fitting and Results
To deduce kinematical and stellar populations parameters we have used direct fitting of the PEGASE.HR (Le Borgne et al. 2004) synthetic spectra into observed data in the pixel space (see Chapter 1 for details).
Taking into account high spectral resolution of the Giraffe spectrograph in the MEDUSA mode (R=7000) PEGASE.HR models based on high-resolution ELODIE.3 stellar library (R=10000) are left as the only alternative to avoid degradation of the spectral resolution of the observed spectra. In order to acquire unbiased estimates of the velocity dispersion, one needs to take into account variations of the spectrograph’s line-spread-function (LSF) and broaden template spectra according to LSF shape (strictly speaking to the difference between LSF of spectrographs used to obtain the spectra being analysed and stellar library used for the spectral synthesis purposes). To achieve this we fitted twilight spectra obtained with Giraffe at the same setup as Abell 496 galaxies with solar spectra available in the ELODIE.3 library which obviously have exactly the same intrinsic LSF as stars used for the spectral synthesis. Instrumental response of Giraffe appeared to be very stable across fibers. Instrumental width () is changing smoothly from 19 km s-1 at 5000Å to 15 km s-1 at 5800Å, H3 remains stable at about -0.01, and H4 at about -0.07. Slightly negative values of H4 are trivially explained by sizes of fibers (1.2 arcsec) which are larger than the normal slit width of the spectrograph (diffraction limit of the collimator) resulting in the -shaped LSF.
Fitting method is not very sensitive to the presence of H feature in the spectral range: though age estimations have higher uncertainties, they remain unbiased (see Chapter 1 for details).
We have applied elliptically-smoothed unsharp masking technique (Lisker et al. 2006) to CFHT/Megacam images for revealing embedded structures. Using different smoothing radii (major axes of ellipses), from 1.5 to 4 arcsec we subjectively classified all the objects into three categories: no, weak and strong embedded structures of the following types: bar, disc, spiral arms, ring (see Tab 4.1). 6 and 9 objects turned to have weak and strong embedded structures respectively. To be stressed that we do not observe embedded structures among faint galaxies, in return, bright ones often exhibit strong and complex embedded systems.
In Tab.4.1 we present values of line-of-sight radial velocities, central velocity dispersions, SSP-equivalent ages and metallicities of the central regions of galaxies from our sample obtained with direct fitting of PEGASE.HR synthetic spectra. Besides, morphological classification and indication for embedded structures based on Megacam multicolor imagery (see next section) are given.
| IAU Name | M(B) | morph. | , km/s | , km/s | , Gyr | , dex | emb.str. | |
| A496J043333.53-131852.6 | -18.79 | SBa | 11704 1.5 | 82 1.5 | 5.6 0.5 | -0.07 0.03 | B | s |
| A496J043346.71-131756.2 | -19.06 | S0 | 8365 1.3 | 72 1.3 | 14.1 2.2 | -0.43 0.02 | S | s |
| A496J043331.48-131654.6 | -18.76 | SO/SA | 9586 1.0 | 50 1.1 | 6.8 0.8 | -0.26 0.03 | S/D | s |
| A496J043333.17-131712.6 | -18.89 | cE/E | 9870 2.0 | 123 2.3 | 15.5 1.9 | -0.07 0.03 | - | |
| A496J043342.10-131653.7 | -18.24 | S0/dS0 | 9517 2.1 | 77 2.1 | 10.0 1.5 | -0.33 0.05 | B/R? | s |
| A496J043341.69-131551.8 | -19.11 | cE/E | 9770 1.8 | 179 2.0 | 16.3 1.7 | -0.08 0.02 | - | |
| A496J043352.77-131523.8 | -18.35 | S0/dS0 | 8926 1.9 | 52 2.0 | 9.6 2.3 | -0.42 0.08 | D? | w |
| A496J043332.07-131518.1 | -18.38 | dE/E | 9954 1.4 | 79 1.4 | 13.1 1.8 | -0.43 0.03 | - | |
| A496J043337.35-131520.2 | cE | 9753 1.3 | 104 1.5 | 16.4 1.9 | -0.04 0.02 | - | ||
| A496J043338.22-131500.7 | cE/E | 10292 2.9 | 145 3.2 | 15.3 2.7 | -0.19 0.03 | - | ||
| A496J043339.72-131424.6 | -16.80 | dE | 10138 4.3 | 24 5.6 | 15.7 15.5 | -0.92 0.15 | - | |
| A496J043401.57-131359.7 | -18.97 | S0 | 10281 1.6 | 148 1.7 | 13.3 1.1 | -0.25 0.02 | - | |
| A496J043403.19-131310.6 | -19.39 | SB0/SBa | 8952 1.8 | 85 1.9 | 13.8 2.3 | -0.27 0.03 | S | s |
| A496J043339.07-131319.7 | -16.26 | dE | 10815 2.8 | 23 4.0 | 4.6 3.0 | -0.08 0.18 | - | |
| A496J043413.08-131231.6 | -17.22 | dE | 10199 6.0 | 42 7.0 | 14.3 13.5 | -0.83 0.14 | - | |
| A496J043408.50-131152.7 | -17.31 | dE/dS0 | 9751 17 | 47 18 | 8.3 19.2 | -0.50 0.71 | B/D | w |
| A496J043334.54-131137.1 | -16.59 | dE | 8442 7.0 | 25 9.3 | 2.6 1.9 | 0.03 0.54 | - | |
| A496J043351.54-131135.5 | -17.06 | dS0/dE | 9459 2.1 | 21 3.3 | 2.4 0.9 | -0.62 0.21 | - | |
| A496J043411.72-131130.2 | -15.68 | dE | 10497 15 | 26 21 | 1.0 1.3 | 0.20 0.96 | - | |
| A496J043413.00-131003.5 | -18.86 | S0 | 10835 1.3 | 50 1.4 | 8.9 1.3 | -0.21 0.05 | - | |
| A496J043355.55-131024.9 | -16.75 | dS0/dE | 8430 3.6 | 20 4.9 | 14.4 18.1 | -0.35 0.17 | - | |
| A496J043342.83-130846.8 | -18.54 | S0/E | 10533 1.6 | 54 1.6 | 7.5 1.4 | -0.56 0.06 | - | |
| A496J043329.79-130851.7 | -17.12 | dE | 8640 3.1 | 30 4.0 | 3.7 1.8 | -0.59 0.10 | - | |
| A496J043410.60-130756.7 | -17.39 | dS0 | 8373 5.3 | 36 6.2 | 3.7 2.7 | -0.30 0.13 | - | |
| A496J043359.03-130626.7 | -18.13 | dS0 | 10552 2.3 | 25 3.1 | 4.4 2.0 | -0.46 0.12 | - | |
| A496J043348.59-130558.3 | -17.72 | dE | 9777 1.4 | 46 1.5 | 11.1 2.1 | -0.37 0.06 | - | |
| A496J043349.08-130520.5 | -18.56 | S0/Sa | 9770 1.8 | 56 1.8 | 9.5 2.0 | -0.43 0.07 | S | w |
| A496J043343.04-130514.1 | -18.03 | dS0 | 9681 1.8 | 56 1.9 | 12.7 3.3 | -0.45 0.05 | - | |
| A496J043345.67-130542.2 | -17.91 | dS0 | 9689 1.3 | 46 1.4 | 5.4 0.8 | -0.25 0.05 | - | |
| A496J043350.17-125945.4 | -16.65 | dS0 | 10381 8.3 | 38 10 | 2.9 3.4 | -0.65 0.45 | - | |
| A496J043356.18-125913.1 | -18.58 | dE | 11203 1.0 | 42 1.3 | 0.84 0.04 | -0.28 0.04 | - | |
| A496J043343.04-125924.4 | -16.92 | dS0/dE | 10221 4.7 | 23 6.7 | 4.9 4.1 | -0.38 0.33 | D | w |
| A496J043326.49-131717.8 | -17.73 | dS0 | 8942 4.1 | 37 4.9 | 4.8 3.2 | -0.24 0.19 | D | w |
| A496J043318.95-131726.9 | -17.47 | dE | 8625 3.5 | 49 3.7 | 5.3 1.8 | -0.32 0.14 | - | |
| A496J043325.15-131715.9 | -15.92 | dE | 9598 5.3 | 8 15 | 17.1 44.0 | -0.36 0.27 | - | |
| A496J043317.75-131536.6 | -17.18 | dS0/dE | 11064 5.5 | 20 8.5 | 2.4 1.6 | -0.32 0.42 | B? | w |
| A496J043325.40-131414.6 | -17.27 | dE | 8374 2.6 | 38 2.9 | 8.5 3.6 | -0.32 0.14 | - | |
| A496J043324.91-131342.6 | -17.82 | dE/E | 9199 2.2 | 41 2.4 | 10.6 3.6 | -0.48 0.09 | - | |
| A496J043306.97-131238.8 | -18.33 | SB0/SBa | 8915 2.4 | 47 2.7 | 4.8 1.6 | -0.12 0.09 | B | s |
| A496J043324.61-131111.9 | -16.28 | dE | 9594 3.8 | 18 6.2 | 4.7 4.6 | -0.23 0.26 | - | |
| A496J043325.10-130906.6 | -16.61 | dE | 10404 9.0 | 32 11 | 2.0 1.7 | -0.25 0.45 | - | |
| A496J043312.08-130449.3 | -17.10 | dE | 9197 6.0 | 30 7.4 | 10.0 13.5 | -0.65 0.33 | - | |
| A496J043321.37-130416.6 | -17.61 | dS0/dSa | 7735 1.8 | 26 2.5 | 1.2 0.1 | -0.55 0.15 | B/S/R? | s |
| A496J043325.54-130408.0 | -16.51 | dE | 11094 8.9 | 26 12 | 1.7 2.1 | -0.48 0.46 | - | |
| A496J043320.35-130314.9 | -19.40 | SB0 | 8764 1.0 | 73 1.0 | 7.3 0.6 | -0.11 0.02 | B/R/S? | s |
| A496J043308.85-130235.6 | -19.18 | Sc | 10862 1.7 | 45 1.9 | 4.6 1.0 | -0.24 0.06 | D | s |
| 1type of embedded structure as follows B: bar, D: disc, R: ring, S: spiral; and strength: strong (s) or weak (w) | ||||||||
The principal limitation of our method which might make impossible to determine correctly parameters for objects exhibiting non-solar [Mg/Fe] abundance ratios is due to contents of the ELODIE.3 library including only stars in the nearest solar neighbourhood known to have [Mg/Fe] correlated with their metallicities [Fe/H] (see Chen et al. 2003 and references there). Thus fitting spectra having non-solar [Mg/Fe] results in template mismatch, which can bias our estimations of stellar population parameters. In Chapter 1 we have shown that [Mg/Fe] ratios do not bias age estimations.
To obtain [Mg/Fe] abundance ratios for Abell 496 galaxies we used stellar population models dealing with Lick indices of magnesium and iron (Thomas et al. 2003). For computing Lick indices we degraded spectral resolution to match one needed to compute Lick indices (Worthey et al. 1994, Thomas et al. 2003) by convolving original spectra with a Gaussian having width equal to the square root of difference between squares of Lick resolution, LSF () and velocity dispersion values found by spectral fitting. Spectral range of Giraffe in the setup we used (ÅÅ) and mean redshift allow to compute the following Lick indices: Fe5015, Mg, Fe5270, Fe5335, and Fe5406. Uncertainties of the indices are computed according to Cardiel et al. (1998). Measurements of indices and derived values of the [Mg/Fe] abundance ratio are presented in Tab 4.2.
| IAU Name | Fe5015 | Mg | Fe5270 | Fe5335 | Fe5406 | [Mg/Fe] |
|---|---|---|---|---|---|---|
| A496J043333.53-131852.6 | ||||||
| A496J043346.71-131756.2 | ||||||
| A496J043331.48-131654.6 | ||||||
| A496J043333.17-131712.6 | ||||||
| A496J043342.10-131653.7 | ||||||
| A496J043341.69-131551.8 | ||||||
| A496J043352.77-131523.8 | ||||||
| A496J043332.07-131518.1 | ||||||
| A496J043337.35-131520.2 | ||||||
| A496J043338.22-131500.7 | ||||||
| A496J043339.72-131424.6 | ||||||
| A496J043401.57-131359.7 | ||||||
| A496J043403.19-131310.6 | ||||||
| A496J043339.07-131319.7 | ||||||
| A496J043413.08-131231.6 | ||||||
| A496J043408.50-131152.7 | ||||||
| A496J043334.54-131137.1 | ||||||
| A496J043351.54-131135.5 | ||||||
| A496J043411.72-131130.2 | ||||||
| A496J043413.00-131003.5 | ||||||
| A496J043355.55-131024.9 | ||||||
| A496J043342.83-130846.8 | ||||||
| A496J043329.79-130851.7 | ||||||
| A496J043410.60-130756.7 | ||||||
| A496J043359.03-130626.7 | ||||||
| A496J043348.59-130558.3 | ||||||
| A496J043349.08-130520.5 | ||||||
| A496J043343.04-130514.1 | ||||||
| A496J043345.67-130542.2 | ||||||
| A496J043350.17-125945.4 | ||||||
| A496J043356.18-125913.1 | ||||||
| A496J043343.04-125924.4 | ||||||
| A496J043326.49-131717.8 | ||||||
| A496J043318.95-131726.9 | ||||||
| A496J043325.15-131715.9 | ||||||
| A496J043317.75-131536.6 | ||||||
| A496J043325.40-131414.6 | ||||||
| A496J043324.91-131342.6 | ||||||
| A496J043306.97-131238.8 | ||||||
| A496J043324.61-131111.9 | ||||||
| A496J043325.10-130906.6 | ||||||
| A496J043312.08-130449.3 | ||||||
| A496J043321.37-130416.6 | ||||||
| A496J043325.54-130408.0 | ||||||
| A496J043320.35-130314.9 | ||||||
| A496J043308.85-130235.6 |
For majority of the low-mass galaxies in our sample, exhibiting we believe to have unbiased estimates for overall metallicities [Fe/H] reported by the spectral fitting procedure.
In Figures 4.1,4.2, and 4.3 measurements of Mg, , and central velocity dispersions are shown. One can notice quite tight correlation between Mg and for km s-1. Massive galaxies tend toward higher [Mg/Fe] values.
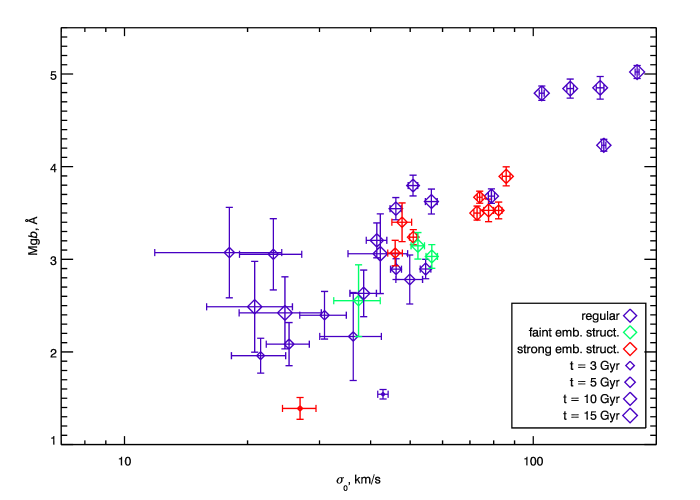
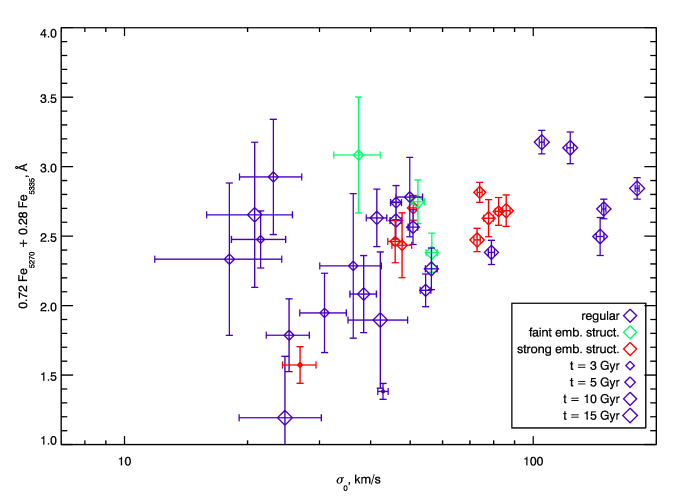
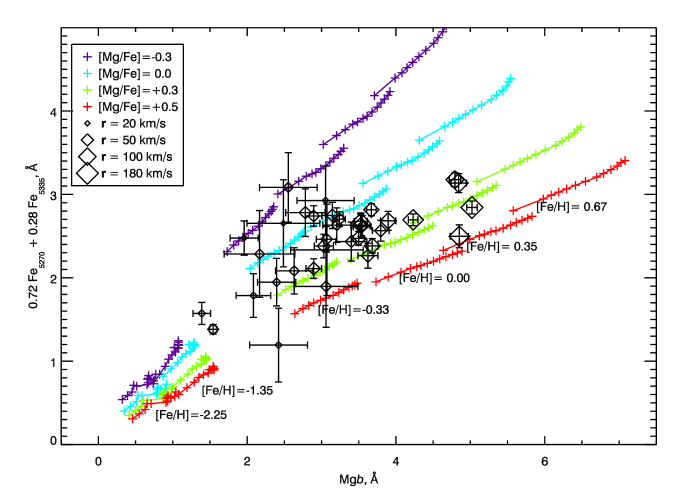
Figures 4.4 and 4.5 demonstrate luminosity – metallicity and luminosity – age relations. It is clearly seen that low-luminosity galaxies tend toward low metallicities and younger ages, though spread of age estimations is quite high due to low signal-to-noise values in the spectra of faint objects.
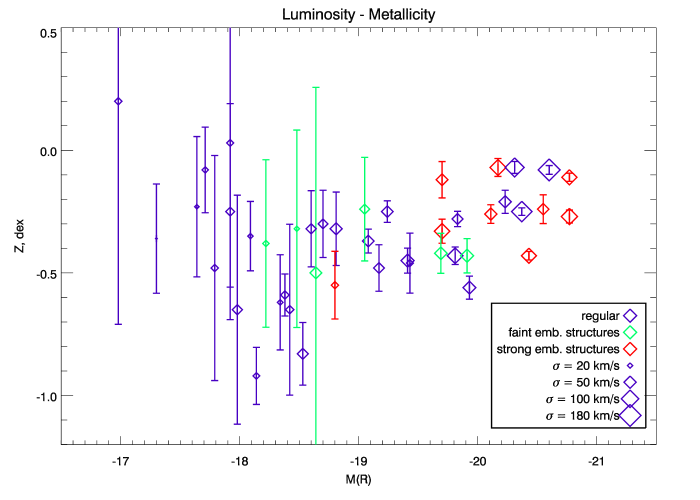
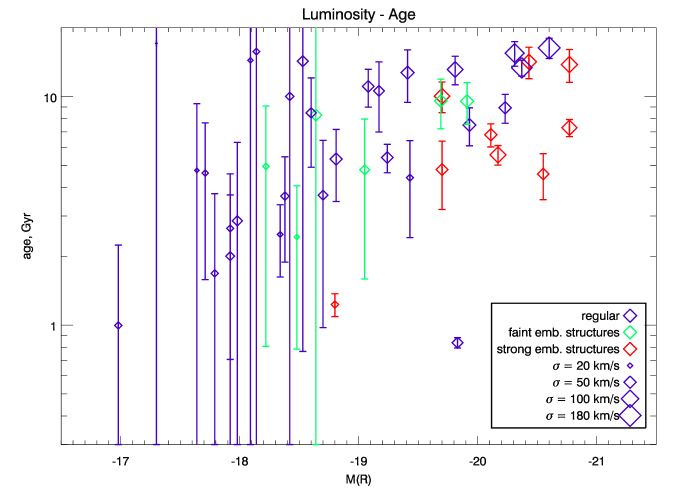
4.3 Scaling Relations
Combining photometrical and kinematical data provides a possibility to study fundamental properties of our galaxies and compare them to the literature.
Faber-Jackson relation (Faber & Jackson 1976), reflecting connection of dynamical and stellar masses is shown in Fig. 4.6.
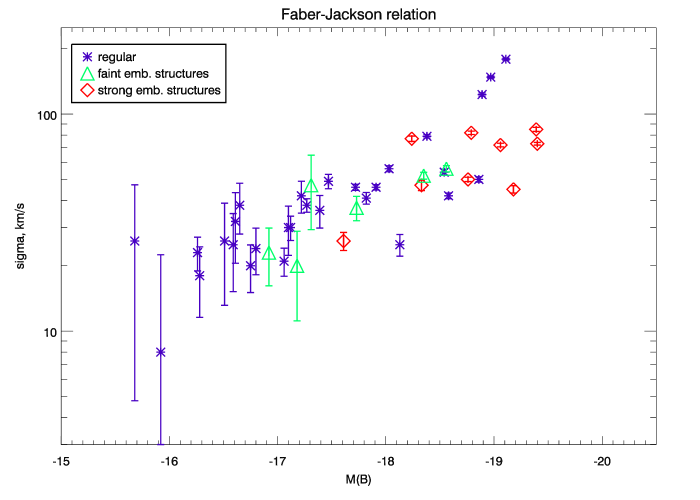
We have built the Fundamental Plane (Djorgovski & Davis 1987) combining kinematical data with surface photometry. Original equation by Djorgovski & Davis (1987) rewritten using , , and (e.g. Guzman et al. 1993) can be transformed into:
| (4.1) |
where is effective surface brightness in B band in mag arcsec-2, is effective radius in kpc, and is central velocity dispersion in km s-1.
Edge-on view of FP is shown in Fig. 4.7. Residuals from the fundamental plane versus SSP-equivalent age are shown in Fig. 4.7(bottom). One could notice an anti-correlation of these residuals and age, which can be explained by higher surface brightness of young population, when other parameters remain fixed.
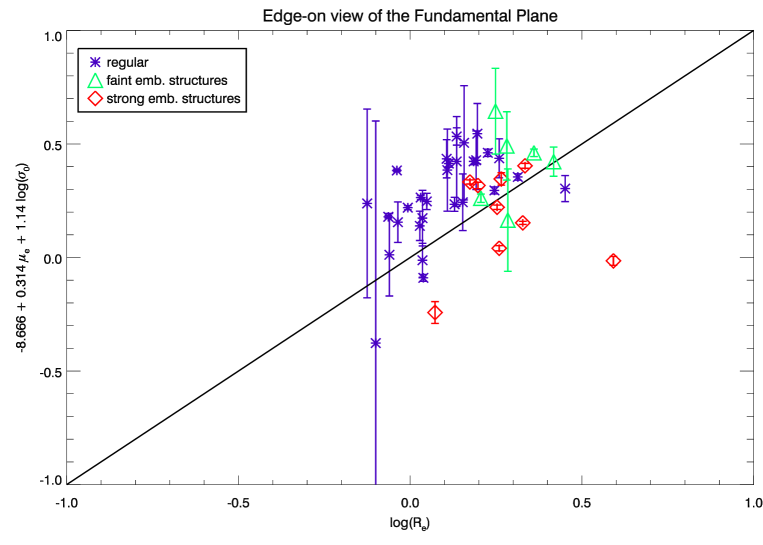
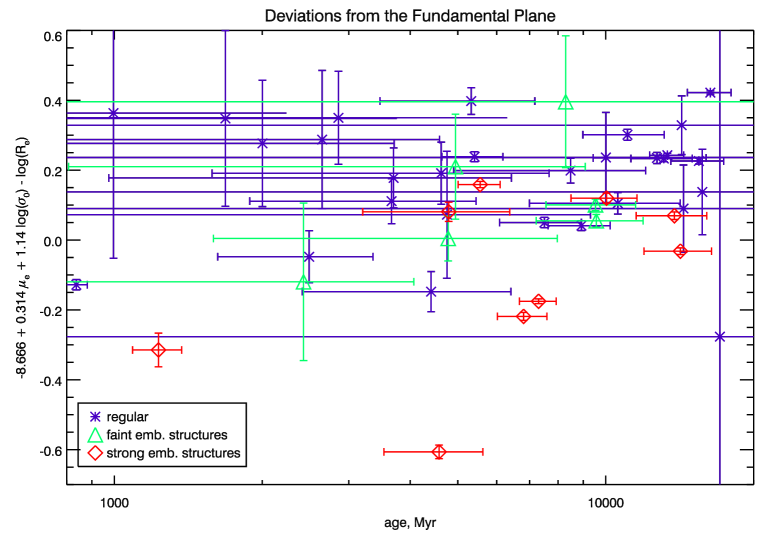
4.4 Discussion and Conclusions
Two possible scenarios of the gas removal usually considered for dE galaxies are: (1) supernova-driven winds on the early stage of galaxy evolution; and (2) ram pressure stripping while crossing central regions of the cluster. The idea of supernova-driven winds is based on the assumption that the gravitational field of small galaxies is not sufficiently strong to keep the interstellar medium from being swept out by SN II explosions during first intense star formation episode.
This scenario leads to abrupt gas loss and interruption of the star formation episode after short time ( years). Consequently, later explosions of SN Ia will not contribute to the Fe-enrichment of the stellar population. Thus, a short star formation episode will lead to overabundance of -elements over iron ([/Fe] 0). This phenomenon is observed in globular clusters and often in giant early-type galaxies (Sil’chenko 2006, Kuntschner et al. 2006). If gas is removed from dE galaxies by supernova-driven winds, we would expect to see [Mg/Fe] 0, and it should increase when the dynamical mass of galaxies (or sigma) decreases.
However, in case of Abell 496, [Mg/Fe] = 0 for nearly all low-massive objects ( 60 km s-1). Hence we cannot consider the scenario of supernova-driven gas removal as the only explanation for the observed properties of dE galaxies. But we cannot avoid it completely, otherwise there would have been no observed correlation between metallicity and luminosity (Fig.4.4). The only conclusion is that observed solar [Mg/Fe] ratios in low-massive objects put the lower limit of at least 1–2 Gyr on the duration of the star formation epoch – a minimal required time to complete iron enrichment (Matteucci 1994). On the other hand, ram-pressure stripping of late-type dwarf galaxies appears to be acceptable. If we assume that late-type galaxies had formed outside the central region of the cluster, and later fell down onto it, enough time is left for the iron enrichment: the typical infall time is several Gyr.
If ram pressure stripping plays the leading role in gas removal, one would expect large spread of luminosity-weighted ages for low-massive objects which can be completely stripped during the first cross of the cluster centre, because it can occur at any moment of galaxy lifetime. Due to low statistics using our data we cannot give decisive answer whether spread of age estimations in Fig. 4.5 is a result of ram-pressure stripping of late-type progenitors, or just due to low quality of measurements – deeper observations are needed.
The presence of faint embedded discs in some galaxies is another strong argument for an evolutionary connection between early and late type dwarf galaxies. This result is in agreement with N-body modelling of morphological evolution of late-type galaxies in clusters (Mastropietro et al. 2005), suggesting that discs will not be completely destroyed. Our conclusion is that dE galaxies have late-type progenitors, formed in the peripheral parts of the cluster, and experienced tidal interactions with the cluster potential and other cluster galaxies, and ram-pressure stripping while crossing the cluster centre.
4.5 Appendix: M 32 twin in Abell 496
We discovered a galaxy belonging to a very rare class of compact elliptical galaxies (cE). Presently, only five galaxies of this class are known: M32, NGC4486B, NGC5846A, and two objects recently discovered in the Abell 1689 cluster (Mieske et al. 2005).
Compact elliptical galaxies are very different from diffuse ones. On the Kormendy diagram they are located on the extension of the sequence formed by giant ellipticals and bulges of spirals toward small effective radii, whereas dE galaxies form a distinct branch. We found the sixth object of this class near the centre of the cluster (projected distance 16 kpc). Like three of five known cE’s it resides in the halo of a large galaxy: the central CD galaxy of Abell 496 (PGC 15524). The central velocity dispersion, 105 km s-1, is quite high for its luminosity probably showing evidence for the presence of a central black hole, as implied by the peak of velocity dispersion in the centre of M 32 (Simien & Prugniel, 2002). Its stellar population parameters are: [Fe/H] dex; [Mg/Fe] dex; Gyr. It is significantly older than M 32 (t=7 Gy, Caldwell et al. 2003, Rose et al. 2005), though its metallicity is nearly the same.
Spectrum and its best fitting template are shown in Fig. 4.8.
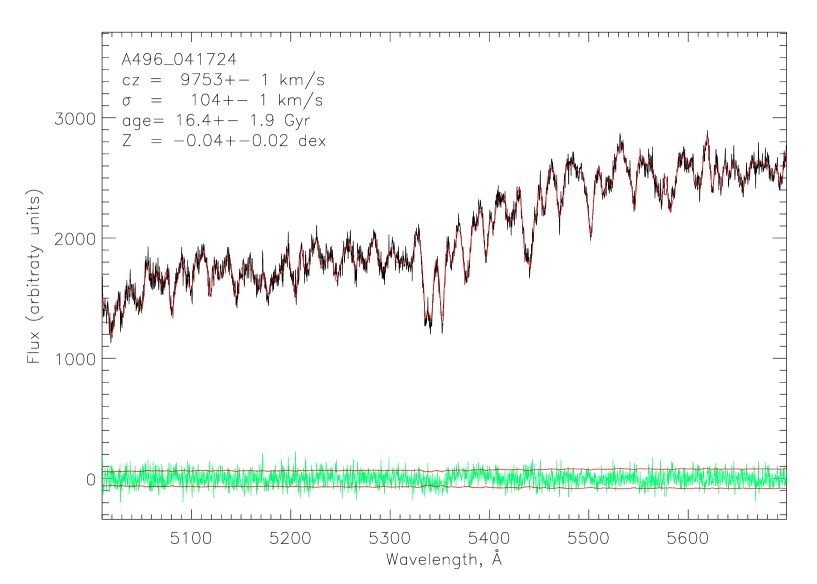
Summary
This thesis is devoted to observational studies of evolution of dwarf elliptical galaxies. Despite these objects are the numerically-dominant type of galaxies in the Universe, their origin and evolution still remains a matter of a debate. Based on the similar morphology, most of the existing studies conclude about evolutionary connection of dwarf elliptical galaxies with gas-rich dwarf irregulars: secular evolution transforms dIrr’s into dE’s. Observations demonstrate that dE galaxies do not exhibit ongoing star formation and contain no ionised gas. Thus, the fundamental problem for building the theory of dE evolution is a proper choice of a gas loss scenario, resulting in an interruption of star formation. Though large samples of spectroscopic observations of dE’s are published, no serious attempts have been made to establish connection between kinematics and stellar populations of these objects. In this work we present such an attempt, based on the high-quality observations obtained with large telescopes.
Chapter 1 presents a new technique for fitting spectra, integrated along a line of sight, by the PEGASE.HR evolutionary models. Thanks to its high sensitivity, our methods opens new horizons in the studies of kinematics and stellar populations using absorption-line spectra.
Analysis of observations of dE galaxies in clusters and groups is given in chapters 2, 3, and 4. Data have been obtained using MPFS IFU spectrograph (Russian 6-m telescope), FLAMES-Giraffe multiobject spectrograph (ESO VLT), and wide-field Megacam imager (CFHT). Our work is the first example of studies of a sample of dE galaxies observed with 3D-spectroscopy technique.
Analysis carried out in this work allows to conclude that evolution of dwarf galaxies is driven by environmental effects. Only ram pressure stripping in clusters, central parts of groups, containing hot gas, or halos of giant galaxies does not contradict to any of the appearances of dE’s. Another scenario, which can not be completely excluded is a gravitational harassment due to numerous encounters with other cluster members. Though this possibility is predicted by the cosmological simulations, it can be realized only if at most 1 percent of cluster members is observable directly, but other 99+ percent are dark matter halos without any presence of visible matter.
Possibility to form embedded discs (including counter-rotating) in dE galaxies evolving in a quiescent environment of groups of galaxies is demonstrated on a real example.
Despite 3D spectroscopy now became a widely-used observational technique, no commonly accepted standards for storing, accessing and retrieving 3D data exists. This question became even more important at the era of rapid evolution of the Virtual Observatory concept. In the appendix we demonstrate a possibility of building complete and self-sufficient description of 3D data (data model), essential to provide access to such datasets, and consequently, for creation of science-ready data archives.
Major results of the thesis
-
1.
New technique for simultaneous fitting of stellar population and internal kinematics using synthetic template spectra
-
2.
Two-dimensional fields of radial velocities, velocity dispersions, and SSP-equivalent parameters of stellar populations (age and metallicity) of dwarf elliptical and lenticular galaxies in the Virgo cluster: IC 783, IC 3468, IC 3509 IC 3653; and low-luminosity early-type galaxies in groups: NGC 127 (NGC 128 group) NGC 770 (NGC 772 group); two dimensional velocity field of ionised gas in NGC 127. All the results obtained by analysing 3D spectroscopic data originating from MPFS IFU spectrograph at the Russian 6-m telescope
-
3.
Catalogue of parameters, including radial velocities, central velocity dispersions, measurements of Lick indices, SSP-equivalent ages, metallicities, and [Mg/Fe] abundance ratios in 46 early type galaxies (28 of those are dE and dS0) in the Abell 496 cluster. Results obtained by analysis of the high-resolution (R=7000) multiobject spectroscopy using FLAMES-Giraffe spectrograph at ESO VLT
-
4.
Discovery of evolutionary-decoupled cores in dwarf elliptical galaxies in the Virgo cluster. Taking into account this result and complex kinematics of those galaxies, evident for a presence of embedded stellar discs, a conclusion about the most probably scenario of gas loss in dE’s, ram pressure stripping, is made.
-
5.
Techniques for universal description, storage, and data access mechanisms for the 3D spectroscopic data in the Virtual Observatory.
Acknowledgments
Author is very grateful to the thesis advisors: Olga Sil’chenko and Philippe Prugniel. I greatly appreciate the support of all my collaborators, in particular of: Victor Afanasiev (SAO RAS, Russia), Francois Bonnarel (CDS, Strasbourg, France), Veronique Cayatte (Observatoire de Paris-Meudon, France), Sven De Rijcke (University of Ghent, Belgium), Marie-Lise Dubernet (Observatoire de Paris-Meudon, France), Florence Durret (IAP, France), Mina Koleva (CRAL Observatoire de Lyon, France / University of Sofia, Bulgaria), Mireille Louys (CDS, Strasbourg, France), Pierre Le Sidaner (Observatoire de Paris-Meudon, France), Jonathan McDowell (Harvard-Smithsonian CfA, USA), Chantal Petit (CRAL Observatoire de Lyon, France), Francois Simien (CRAL Observatoire de Lyon). We are very grateful to Alexei Moiseev for supporting the observations of dE galaxies at the 6-m telescope. Visits in France were supported through a bilateral CNRS grant and EGIDE (through Scienctific department of the Embassy of France in Russia). This PhD is supported by the INTAS Young Scientist Fellowship (04-83-3618). The dwarf galaxies investigation is supported by the bilateral Flemish-Russian collaboration (project RFBR-05-02-19805-MF_a). We appreciate support provided by the organizing committees of the following meetings: JENAM-2004, ADASS, ”Mapping the Galaxy and Nearby Galaxies”, ”Science Perspectives for 3D Spectroscopy”, and to the International Astronomical Union for providing support to attend IAU Colloquium 198. Special thanks to the Large Telescopes Time Allocation Committee or the Russian Academy of Sciences for providing observing time with MPFS. We are grateful to the staff of the Terapix data center at IAP, France, for their efficiency and competence in reducing our Megacam imaging data.
Special thanks to a PhD student in the Moscow University, Ivan Zolotukhin for valuable assistance in preparation of the Russian version of the manuscript.
Author is grateful to his parents: Vladimir and Lyudmila Chilingarian for their support during 3 years of PhD preparation.
Appendix A 3D data in the Virtual Observatory
A.1 Introduction to the 3D spectroscopy
Integral field (or 3D) spectroscopy is a modern technique in astrophysical observing that was proposed by Georges Courtés in the late 60’s. The idea is to get a spectrum for every point in the field of view of a spectrograph.
One of the approaches is to use a scanning Fabry-Perot interferometer. In this case after reducing the data, one gets a set of narrow-band direct images with slightly overlapping bands, or a so-called data cube – a three dimensional structure, containing spatial and spectral information – a short spectrum for every spatial pixel. Resulting data cubes have wide spatial dimensions and relatively narrow spectral ones. A similar approach has been used in radio astronomy for a couple of decades, and their datasets look nearly the same.
Another approach is to slice a field of view using a micro-lens array or special image slicer device (Integral Field Unit, or IFU) and feed a ”classical” spectrograph (see review in Pécontal-Rousset et al., 2004 for a description of different image slicing techniques). The resulting datasets are normally smaller in spatial dimensions than Fabry-Perot datasets, however the spectral dimension is usually one to two orders longer.
The first implementations of 3D spectrographs came in the 1980s and immediately demonstrated great benefits of this technique for studying both extended and point sources. Presently, there are more than a dozen 3D spectrographs being operated on nearly every large telescope all over the world. A growing amount of 3D data is being produced by these instruments, and the question of dissemination of these data in the Virtual Observatory has become an important challenge.
Creating the archive implies the following necessary metadata to be defined: Data Description, Data Storage Format, and Query Interface and Data Retrieval. While there is a good and interoperable solution for the data storage format, the Euro3D FITS Format developed within Euro3D research training network (Kissler-Patig et al. 2004), the two other aspects rely on the Virtual Observatory community.
A.2 Characterisation Data Model of IVOA
An abstract, self-sufficient and standardised description of the astronomical data is known as a data model. Such a description is supposed to be sufficient for any sort of data processing and analysis. The Data Modeling working group of the International Virtual Observatory Alliance (IVOA) is responsible for defining data models for different types of astronomical data sets, catalogues, and more general concepts e.g. ”quantity”. The most general description of any sort of observational or theoretical data sets will be given by the forthcoming Observational DM (McDowell et al. 2004 in prep.). Its main subclasses are: Observation, DataCollection, Curation, Provenance and Characterisation. The latter one gives a physical insight to the dataset, while others provide more instrument-specific or sociological information. Characterisation was reorganised as a separate data model (McDowell et al. 2006 in prep.), which is now being intensively developed.
Characterisation DM is a way to say where, how extended and in which way the Observational or Simulated dataset can be described in a multidimensional parameter space, having the following axes: spatial, temporal, spectral, observed (e.g. flux), polarimetric, as well as other arbitrary axes. For every axis there are three characterisation properties: coverage, resolution, and sampling. Every axis also contains a specific axisFrame subclass used for error assessment and including some general axis-specific metadata. Four levels of characterisation, reflecting different levels of details in the description can be given for every axis:
-
1.
location or reference value, giving average position of the data on a given parameter axis
-
2.
bounds, providing a bounding box
-
3.
support, describing more precisely regions on a parameter axis as a set of segments
-
4.
map, showing a detailed sensitivity map, containing the absolute transmission factor for every volume element in the parameter space
The first two levels of characterisation provide basic information that usually already exists in the metadata given by the different data processing pipelines, or is easy to compute from science-ready datasets. These levels can be easily provided as searchable criteria by the data access services (e.g. Simple Spectral Access Protocol (Tody et al. 2006 in prep.) admits service-specific parameters).
A.3 Characterising 3D datasets
Due to complexity of 3D datasets we propose that data centres give only the first two levels of characterisation for the whole dataset. Further levels can be given optionally for every spectral segment (in case of IFU data) or image plane (in case of Fabry-Perot or radio data cube).
We present a way of characterising IFU datasets (actually other types of 3D data can be characterised in a similar way). On Figure A.1 and Figure A.2 we demonstrate how to compute characterisation metadata for spectral, spatial, and observable axes from the real dataset. We have developed a software package for computing characterisation metadata for IFU datasets stored in the Euro3D format. We also suggest some modifications to Euro3D FITS format for storing temporal and resolution-specific information.
A ”live” example of the first two levels of the characterisation metadata for the data, obtained with the Multi-Pupil Fiber Spectrograph based on the Russian 6m telescope at SAO RAS, in the XML format can be found here: http://www.sai.msu.su/~chil/VO/CharMPFS.xml
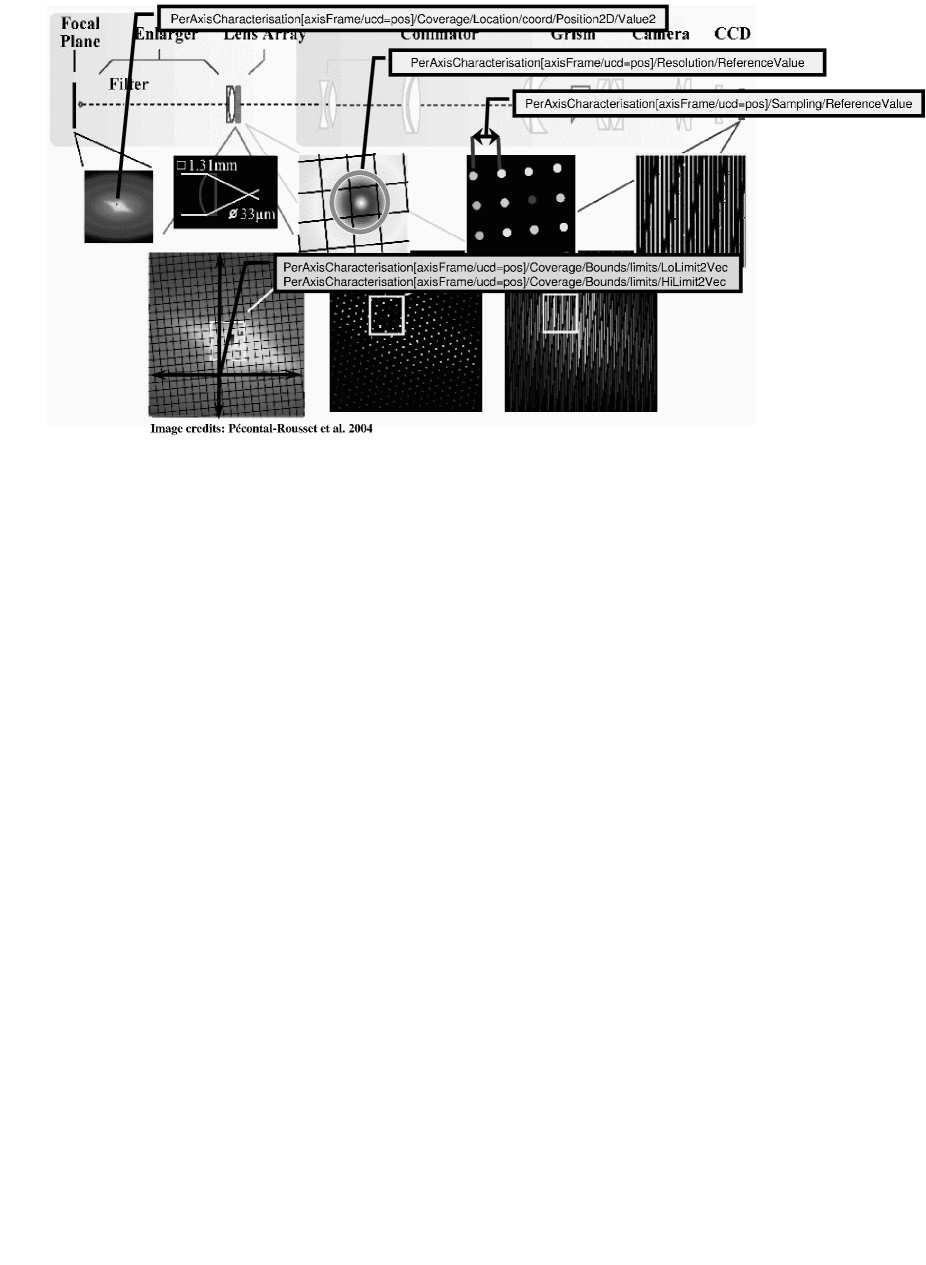
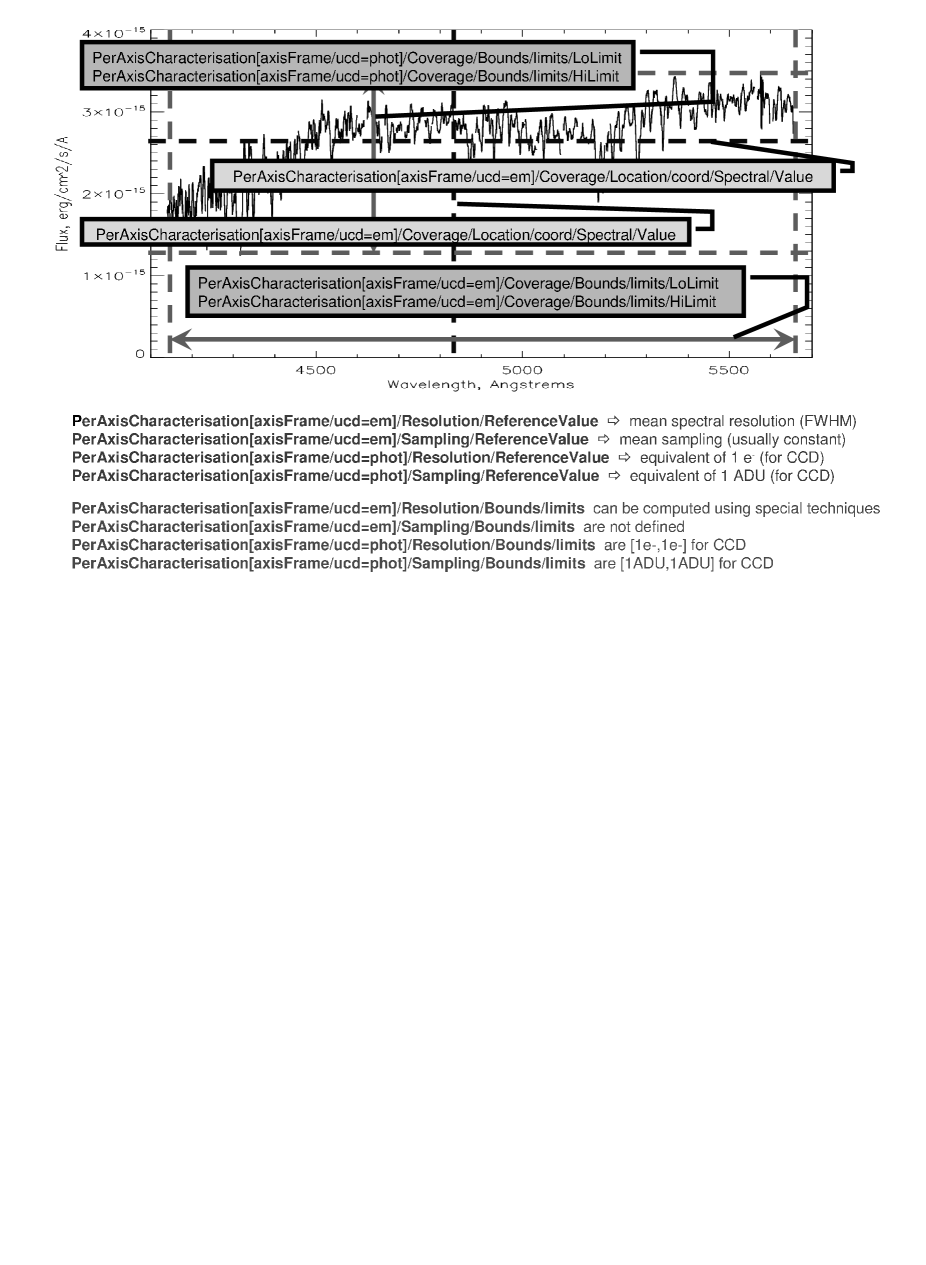
A.4 Summary
The data modeling is a crucial point for building VO-compliant data archives and tools for data processing and analysis. Characterisation DM has sufficient flexibility and completeness to be applied for such complex datasets as 3D data.
Considering the Characterisation DM and the extensibility of the Simple Spectral Access Protocol, we conclude that all the necessary infrastructural components exist for building VO-compliant archives of science-ready 3D data and tools for dealing with them. We expect the first 3D archives to appear in the beginning of 2006.
References
- Abadi et al., 1999 Abadi, Mario G.; Moore, Ben; Bower, Richard G.; 1999, MNRAS, v.308, p.947
- Abell, 1958 Abell, George O.; 1958, ApJS, v.3, p.211
- Aguerri et al., 2003 Aguerri, J. A. L.; Debattista, Victor P.; Corsini, Enrico Maria; 2003, MNRAS, v.338, p.465
- Aparicio, 1994 Aparicio, A.; 1994, ApJL, v.437, L27
- Arp, 1966 Arp, Halton; 1966, ApJS, v.14, p.1
- Baade, 1944 Baade, W.; 1944, ApJ, v.100, p.137
- Babul & Rees, 1992 Babul, Arif; Rees, Martin J.; 1992, MNRAS, v.255, p.346
- Bacon et al., 1995 Bacon, R.; Adam, G.; Baranne, A.; Courtes, G.; Dubet, D.; Dubois, J. P.; Emsellem, E.; Ferruit, P.; Georgelin, Y.; Monnet, G.; Pecontal, E.; Rousset, A.; Say, F.; 1995, A&A Supplement, v.113, p.347
- Barazza et al., 2002 Barazza, F. D.; Binggeli, B.; Jerjen, H.; 2002, A&A, v.391, p.823
- Bender, 1990 Bender, R.; 1990, A&A, v.229, p.441
- Bender & Nieto, 1990 Bender, R.; Nieto, J.-L.; 1990, A&A, v.239, p.97
- Bertola & Capaccioli, 1975 Bertola, F.; Capaccioli, M.; 1975, ApJ, v.200, p.439
- Binggeli et al., 1985 Binggeli, B.; Sandage, A.; Tammann, G. A.; 1985, AJ, v.90, p.1681
- Binggeli et al., 1987 Binggeli, Bruno; Tammann, G. A.; Sandage, Allan; 1987, AJ, v.94, p.251
- Binggeli et al., 1990 Binggeli, B.; Tarenghi, M.; Sandage, A.; 1990, A&A, v.228, p.42
- Binney, 1976 Binney, J.; 1976, MNRAS, v.177, p.19
- Blanchard et al., 1992 Blanchard, A.; Valls-Gabaud, D.; Mamon, G. A.; 1992, A&A, v.264, p.365
- Bottema, 1988 Bottema, R.; 1988, A&A, v.197, p.105
- Bruzual & Charlot, 2003 Bruzual, G.; Charlot, S.; 2003, MNRAS, v.344, p.1000
- Burstein et al., 1984 Burstein, D.; Faber, S. M.; Gaskell, C. M.; Krumm, N.; 1984, ApJ, v.287, p.586
- Buyle et al., 2005 Buyle, P.; De Rijcke, S.; Michielsen, D.; Baes, M.; Dejonghe, H.; 2005, MNRAS, v.360, p.853
- Caldwell et al., 2003 Caldwell, Nelson; Rose, James; Concannon, Kristi; 2003, AJ, v.125, p.2891
- Cappellari & Copin, 2003 Cappellari, Michele; Copin, Yannick; 2003, MNRAS, v.342, p.345
- Cappellari & Emsellem, 2004 Cappellari, Michele; Emsellem, Eric; 2004, PASP, v.116, p.138
- Cardiel et al., 1998 Cardiel, N.; Gorgas, J.; Cenarro, J.; Gonzalez, J. J.; 1998, A&AS, v.127, p.597
- Carraro et al., 2001 Carraro, Giovanni; Chiosi, Cesare; Girardi, Léo; Lia, Cesario; 2001, MNRAS, v.327, p.69
- Cayatte et al., 1994 Cayatte, V.; Kotanyi, C.; Balkowski, C.; van Gorkom, J. H.; 1994, AJ, v.107, p.1003
- Chen et al., 2003 Chen, Yang; Zhao, G.; Nissen, P. E.; Bai, G. S.; Qiu, H. M.; 2003, ApJ, v.591, p.925.
- Chiosi & Carraro, 2002 Chiosi, Cesare; Carraro, Giovanni; 2002, MNRAS, v.335, p.335
- Conselice et al., 2001 Conselice, C.; Gallagher, J.; Wyse, R.; 2001, ApJ, v.559, p.791
- Conselice et al., 2003 Conselice, C.; O’Neil, K.; Gallagher, J.; Wyse, R. ; 2003, ApJ, v.591, p.167
- Cote et al., 2004 Côté, Patrick; Blakeslee, John; Ferrarese, Laura; Jordán, Andrés; Mei, Simona; Merritt, David; Milosavljević, Milos; Peng, Eric; Tonry, John; West, Michael; 2004, ApJS, v.153, p.223
- Cote et al., 2006 Côté, Patrick; Piatek, Slawomir; Ferrarese, Laura; Jordán, Andrés; Merritt, David; Peng, Eric W.; Haegan, Monica; Blakeslee, John P.; Mei, Simona; West, Michael J.; Milosavljevi, Milo; Tonry, John L.; 2006, ApJS, v.165, p.57
- Da Costa & Armandroff, 1990 Da Costa, G. S.; Armandroff, T. E.; 1990, AJ, v.100, p.162
- de Bruyne et al., 2004 De Bruyne, V.; De Rijcke, S.; Dejonghe, H.; Zeilinger, W. W.; 2004, MNRAS, v.349, p.461
- De Rijcke et al., 2001 De Rijcke, S.; Dejonghe, H.; Zeilinger, W. W.; Hau, G. K. T.; 2001, ApJ, v.559, L21
- De Rijcke et al., 2004 De Rijcke, S.; Dejonghe, H.; Zeilinger, W. W.; Hau, G. K. T.; 2004, A&A, v.426, p.53
- De Rijcke et al., 2005 De Rijcke, S.; Michielsen, D.; Dejonghe, H.; Zeilinger, W. W.; Hau, G. K. T. ; 2005, A&A, v.438, p.491
- Dekel & Silk, 1986 Dekel, A.; Silk, J.; 1986, ApJ, Part 1, v.303, p.39
- Djorgovski & Davis, 1987 Djorgovski, S.; Davis, Marc; 1987, ApJ, Part 1, v.313, p.59
- Durret et al., 2000 Durret, F.; Adami, C.; Gerbal, D.; Pislar, V.; 2000, A&A, v.356, p.815
- Durret et al., 2005 Durret, F.; Lima Neto, G. B.; Adami, C.; Bagchi, J.; Covone, G.; Forman, W.; Kneib, J.-P.; Slezak, E.; Soucail, G.; 2005, SF2A-2005: Semaine de l’Astrophysique Francaise, meeting held in Strasbourg, France, June 27 - July 1, 2005, Edited by F. Casoli, T. Contini, J.M. Hameury and L. Pagani. Published by EdP-Sciences, Conference Series, 2005, p.709
- Efstathiou, 1992 Efstathiou, G.; 1992, MNRAS, v.256, p.43P
- Emsellem & Arsenault, 1997 Emsellem, E.; Arsenault, R.; 1997, A&A, v.318, L39
- Emsellem et al., 2004 Emsellem, Eric; Cappellari, Michele; Peletier, Reynier F.; McDermid, Richard M.; Bacon, R.; Bureau, M.; Copin, Y.; Davies, Roger L.; Krajnovic, Davor; Kuntschner, Harald; Miller, Bryan W.; de Zeeuw, P. Tim; 2004, MNRAS, v.352, p.721
- Faber, 1972 Faber, S. M.; 1972, A&A, v.20, p.361
- Faber & Jackson, 1976 Faber, S. M.; Jackson, R. E.; 1976, ApJ, v.204, p.668
- Ferguson & Binggeli, 1994 Ferguson, Henry C.; Binggeli, Bruno; 1994, A&A Review, v.6, p.67
- Ferrarese et al., 2006 Ferrarese, Laura; Côté, Patrick; Jordán, Andrés; Peng, Eric W.; Blakeslee, John P.; Piatek, Slawomir; Mei, Simona; Merritt, David; Milosavljevic, Milos; Tonry, John L.; West, Michael J.; 2006, ApJS, v.164, p.334
- Fioc & Rocca-Volmerange, 1997 Fioc, M.; Rocca-Volmerange, B.; 1997, A&A, v.326, p.950
- Gavazzi et al., 2003 Gavazzi, G.; Boselli, A.; Donati, A.; Franzetti, P.; Scodeggio, M.; 2003, A&A, v.400, p.451
- Geha et al., 2002 Geha, M.; Guhathakurta, P.; van der Marel, R. P.; 2002, AJ, v.124, p.3073
- Geha et al., 2003 Geha, M.; Guhathakurta, P.; van der Marel, R. P.; 2003, AJ, v.126, p.1794
- Geha et al., 2005 Geha, M.; Guhathakurta, P.; van der Marel, R. P.; 2005, AJ, v.129, p.2617
- Gunn & Gott, 1972 Gunn, James E.; Gott, J. Richard, III; 1972, ApJ, v.176, p.1
- Guzman et al., 1993 Guzman, R.; Lucey, J. R.; Bower, R. G.; 1993, MNRAS, v.265, p.731
- Icke, 1985 Icke, V.; 1985, A&A, v.144, p.115
- Jansen et al., 2000 Jansen, Rolf A.; Fabricant, Daniel; Franx, Marijn; Caldwell, Nelson; 2000, ApJS, v.126, p.331
- Jerjen et al., 2000 Jerjen, H.; Kalnajs, A.; Binggeli, B.; 2000, A&A, v.358, p.845
- Kenney & Koopmann, 1999 Kenney, Jeffrey D. P.; Koopmann, Rebecca A.; 1999, AJ, v.117, p.181
- Kissler-Patig et al., 2004 Kissler-Patig, M.; Copin, Y.; Ferruit, P.; Pécontal-Rousset, A.; Roth, M. M. ; 2004, Astronomische Nachrichten, v.325, p.159
- Kormendy, 1985 Kormendy, J.; 1985, ApJ, v.295, p.73
- Kuijken & Merrifield, 1993 Kuijken, K.; Merrifield, M. R.; 1993, MNRAS, v.264, p.712
- Kuntschner, 2004 Kuntschner, H.; 2004, A&A, v.426, p.737
- Kuntschner et al., 2006 Kuntschner, Harald; Emsellem, Eric; Bacon, R.; Bureau, M.; Cappellari, Michele; Davies, Roger L.; de Zeeuw, P. T.; Falcón-Barroso, Jesús; Krajnovic, Davor; McDermid, Richard M.; Peletier, Reynier F.; Sarzi, Marc; 2006, MNRAS, v.369, p.497
- Le Borgne et al., 2004 Le Borgne, D.; Rocca-Volmerange, B.; Prugniel, P.; Lanc̣on, A.; Fioc, M.; Soubiran, C.; 2004, A&A, v.425, p.881
- Leitherer et al., 1992 Leitherer, Claus; Robert, Carmelle; Drissen, Laurent; 1992, ApJ, v.401, p.596
- Lin & Murray, 1992 Lin, Douglas N. C.; Murray, Stephen D.; 1992, ApJ, v.394, p.523
- Lisker et al., 2006 Lisker, Thorsten; Grebel, Eva K.; Binggeli, Bruno; 2006, AJ, v.132, p.497
- Lu et al., 1991 Lu, Limin; Wolfe, Arthur M.; Turnshek, David A.; 1991, ApJ, v.367, p.19
- Makarov & Makarova, 2004 Makarov, D. I.; Makarova, L. N.; 2004, Astrophysics (English translation of Astrofizika), v.47, p.229
- Marcolini et al., 2003 Marcolini, A.; Brighenti, F.; D’Ercole, A.; 2003, MNRAS, v.345, p.1329
- Mastropietro et al., 2005 Mastropietro, Chiara; Moore, Ben; Mayer, Lucio; Debattista, Victor P.; Piffaretti, Rocco; Stadel, Joachim; 2005, MNRAS, v.364, p.607
- Matteucci, 1994 Matteucci, Francesca; 1994, A&A, v.288, p.57
- McDowell et al. 2004 McDowell, J. et al., 2004, IVOA Data Model for Astronomical Observation (in preparation)
- McDowell et al. 2006 J. McDowell, F. Bonnarel, I. Chilingarian, M. Louys, A. Micol, and A. Richards, 2006, IVOA Data Model for Astronomical DataSet Characterisation (in preparation)
- Michielsen et al., 2003 Michielsen, D.; De Rijcke, S.; Dejonghe, H.; Zeilinger, W. W.; Hau, G. K. T. ; 2003, Astrophysics and Space Science, v.284, p.635
- Mieske et al., 2005 Mieske, S.; Infante, L.; Hilker, M.; Hertling, G.; Blakeslee, J. P.; Ben tez, N.; Ford, H.; Zekser, K.; 2005, A&A, v.430, L25
- Moiseev, 2001 Moiseev, A. V.; 2001, Bulletin of the Special Astrophysical Observatory (Izvestiya Spetsial’noi Astrofizicheskoi Observatorii), v.51, p.11
- Moultaka & Pelat, 2000 Moultaka, J.; Pelat, D.; 2000, MNRAS, v.314, p.409
- Moultaka et al., 2004 Moultaka, J.; Boisson, C.; Joly, M.; Pelat, D.; 2004, A&A, v.420, p.459
- Nulsen, 1982 Nulsen, P. E. J.; 1982, MNRAS, v.198, p.1007
- Ocvirk et al., 2003 Ocvirk, P.; Lancon, A.; Pichon, C.; Prugniel, P.; Thiébaut, E.; Le Borgne, D.; Rocca-Volmerange, B.; Fioc, M.; Soubiran, C.; 2003, SF2A-2003: Semaine de l’Astrophysique Franc̣aise, meeting held in Bordeaux, France, June 16-20, 2003. Eds.: F. Combes, D. Barret, T. Contini, and L. Pagani. EdP-Sciences, Conference Series, p.309.
- Ocvirk et al., 2006 Ocvirk, P.; Pichon, C.; Lanc̣on, A.; Thiébaut, E.; 2006, MNRAS, v.365, p.46
- Ocvirk et al., 2006 Ocvirk, P.; Pichon, C.; Lanc̣on, A.; Thiébaut, E.; 2006, MNRAS, v.365, p.74
- Pasquini et al., 2002 Pasquini, L.; Avila, G.; Blecha, A.; Cacciari, C.; Cayatte, V.; Colless, M.; Damiani, F.; de Propris, R.; Dekker, H.; di Marcantonio, P.; Farrell, T.; Gillingham, P.; Guinouard, I.; Hammer, F.; Kaufer, A.; Hill, V.; Marteaud, M.; Modigliani, A.; Mulas, G.; North, P.; Popovic, D.; Rossetti, E.; Royer, F.; Santin, P.; Schmutzer, R.; Simond, G.; Vola, P.; Waller, L.; Zoccali, M.; 2002, The Messenger, No. 110, p.1
- Paturel et al., 2003 Paturel, G.; Petit, C.; Prugniel, Ph.; Theureau, G.; Rousseau, J.; Brouty, M.; Dubois, P.; Cambrésy, L.; 2003, A&A, v.412, p.45
- Pécontal-Rousset et al. 2004 Pécontal-Rousset, A.; Bacon, R.; Copin, Y.; Emsellem, E.; Ferruit, P.; Pécontal, E.; 2004, Astronomical Data Analysis Software and Systems (ADASS) XIII, Proceedings of the conference held 12-15 October, 2003 in Strasbourg, France. Edited by Francois Ochsenbein, Mark G. Allen and Daniel Egret. ASP Conference Proceedings, Vol. 314. San Francisco: Astronomical Society of the Pacific, 2004., p.491
- Pedraz et al., 2002 Pedraz, S.; Gorgas, J.; Cardiel, N.; Sánchez-Blázquez, P.; Guzmán, R. ; 2002, MNRAS, v.332, L59
- Peng et al., 2002 Peng, Chien Y.; Ho, Luis C.; Impey, Chris D.; Rix, Hans-Walter; 2002, AJ, v.124, p.266
- Phillipps et al., 1998 Phillipps, S.; Driver, S. P.; Couch, W. J.; Smith, R. M.; 1998, ApJL v.498, L119
- Prugniel & Simien, 1994 Prugniel, Ph.; Simien, F.; 1994, A&A, v.282, L1
- Prugniel & Simien, 1996 Prugniel, P.; Simien, F.; 1996, A&A, v.309, p.749
- Prugniel & Simien, 1997 Prugniel, P.; Simien, F.; 1997, A&A, v.321, p.111
- Prugniel & Soubiran, 2001 Prugniel, Ph.; Soubiran, C.; 2001, A&A, v.369, p.1048
- Prugniel & Soubiran, 2004 Prugniel, Ph.; Soubiran, C.; 2004, eprint arXiv:astro-ph/0409214
- Prugniel et al., 1999 Prugniel, Ph.; Golev, V.; Maubon, G.; 1999, A&A, v.346, L25
- Prugniel et al., 2005 Prugniel, Philippe; Chilingarian, Igor; Sil’Chenko, Olga; Afanasiev, Victor; 2005, Near-fields cosmology with dwarf elliptical galaxies, IAU Colloquium Proceedings of the international Astronomical Union 198, Held 14-18 March, Switzerland, edited by Jerjen, H.; Binggeli, B. Cambridge: Cambridge University Press, 2005., p.73-76
- Richstone & Tremaine, 1986 Richstone, D. O.; Tremaine, S.; 1986, AJ, v.92, p.72
- Rix & White, 1992 Rix, Hans-Walter; White, Simon D. M.; 1992, MNRAS, v.254, p.389
- Rose et al., 2005 Rose, James A.; Arimoto, Nobuo; Caldwell, Nelson; Schiavon, Ricardo P.; Vazdekis, Alexandre; Yamada, Yoshihiko; 2005, AJ, v.129, p.712
- Saha & Williams, 1994 Saha, P.; Williams, T. B.; 1994, AJ, v.107, p.1295
- Salpeter, 1955 Salpeter, Edwin E.; 1955, ApJ, v.121, p.161
- Sargent et al., 1977 Sargent, W. L. W.; Schechter, P. L.; Boksenberg, A.; Shortridge, K.; 1977, ApJ, v.212, p.326
- Schlegel et al., 1998 Schlegel, David; Finkbeiner, Douglas; Davis, Marc; 1998, ApJ v.500, p.525
- Sil’chenko, 1992 Sil’chenko, O. K.; 1992; Full Doctor of Science Thesis, Moscow State University.
- Sil’chenko, 1997 Sil’chenko, O. K.; 1997, Astronomy Reports, v.41, p.567
- Sil’chenko, 2006 Sil’chenko, O. K.; 2006, ApJ, v.641, p.229
- Sil’chenko & Shapovalova, 1989 Sil’chenko O., Shapovalova A., 1989, SoSAO, 60, 44
- Sil’chenko et al., 1992 Sil’chenko, O. K.; Afanas’ev, V. L.; Vlasyuk, V. V.; 1992, Astronomicheskij Zhurnal, v.69, p.1121
- Simien & Prugniel, 2002 Simien, F.; Prugniel, Ph.; 2002, A&A, v.384, p.371
- Statler, 1991 Statler, Thomas S.; 1991, ApJL, v.382, L11
- Struble & Rood, 1987 Struble, Mitchell F.; Rood, Herbert J.; 1987, ApJS, v.63, p.555
- Thomas et al., 2003 Thomas, Daniel; Maraston, Claudia; Bender, Ralf; 2003, MNRAS, v.339, p.897
- Thomas et al., 2006 Thomas, D.; Brimioulle, F.; Bender, R.; Hopp, U.; Greggio, L.; Maraston, C.; Saglia, R. P.; 2006, A&A, v.445, L19
- Tonry & Davis, 1979 Tonry, J.; Davis, M.; 1979, AJ, v.84, p.1511
- Tinsley, 1968 Tinsley, Beatrice M.; 1968, ApJ, v.151, p.547
- Tinsley, 1972 Tinsley, B. M.; 1972, ApJ, v.178, p.319
- Tinsley, 1972 Tinsley, B. M.; 1972, A&A, v.20, p.383
- Tody et al. 2006 Tody, D. et al, 2006, IVOA Simple Spectral Access Protocol (in preparation)
- van Zee et al., 2004 van Zee, Liese; Skillman, Evan D.; Haynes, Martha P.; 2004, AJ, v.128, p.121
- van Zee et al., 2004 van Zee, Liese; Barton, Elizabeth J.; Skillman, Evan D.; 2004, AJ, v.128, p.2797
- van der Marel & Franx, 1993 van der Marel, Roeland P.; Franx, Marijn; 1993, ApJ, v.407, p.525
- van der Marel, 1994 van der Marel, R. P.; 1994, MNRAS, v.270, p.271
- Vazdekis & Arimoto, 1999 Vazdekis, A.; Arimoto, N.; 1999, ApJ, v.525, p.144
- Vazdekis, 1999 Vazdekis, A.; 1999, ApJ, v.513, p.224
- Vlasyuk & Sil’chenko, 2000 Vlasyuk, V. V.; Sil’chenko, O. K.; 2000, A&A, v.354, p.28
- Wood, 1966 Wood, David B.; 1966, ApJ, v.145, p.36
- Worthey, 1994 Worthey, Guy; 1994, ApJS, v.95, p.107
- Worthey et al., 1992 Worthey, Guy; Faber, S. M.; Gonzalez, J. J.; 1992, ApJ, v.398, p.69
- Worthey et al., 1994 Worthey, Guy; Faber, S. M.; Gonzalez, J. Jesus; Burstein, D.; 1994, ApJS, v.94, p.687
- Worthey & Ottaviani, 1997 Worthey, Guy; Ottaviani, D. L.; 1997, ApJS v.111, p.377
- Yoshii & Arimoto, 1987 Yoshii, Y.; Arimoto, N.; 1987, A&A, v.188, p.13
- Zaritsky et al., 1997 Zaritsky, Dennis; Smith, Rodney; Frenk, Carlos; White, Simon D. M.; 1997, ApJ, v.478, p.39