Cosmic Rays from the Knee to the Ankle – Status and Prospects
Abstract
Recent progress in cosmic ray physics covering the energy range from about eV to eV is reviewed. The most prominent features of the energy spectrum are the so called ‘knee’ at eV and the ‘ankle’ at few eV. Generally, the origin of the knee is understood as marking the limiting energy of galactic accelerators and/or the onset of increasing outflow of particles from the galaxy while the ankle is considered to mark the transition from galactic to extragalactic cosmic rays. Alternative theories do exist and shall be sketched. A key observable to answer the still open questions about the cosmic ray origin and to discriminate between various models is given by measuring the chemical composition or – more directly – by measuring energy spectra of individual cosmic ray mass groups. The status of present analyses is critically discussed and new experimental endeavors carried out in order to improve both the statistics and the quality of data particularly at energies above the knee will be summarized.
1 INTRODUCTION
The cosmic ray (CR) energy spectrum extends from a few hundreds MeV to above eV. Over this wide range of energies the intensity drops by more than 30 orders of magnitude. Despite the enormous dynamic range covered, the spectrum appears rather structureless and can be well approximated by broken power-laws . Up to energies of a few eV the flux of particles is sufficiently high to enable measurements of their elemental distributions by high flying balloon- or satellite-borne experiments. Such studies have provided important information about the origin and transport properties of CRs in the interstellar medium. Two prominent examples are ratios of secondary to primary elements, such as the B/C-ratio, which are used to extract the average amount of matter CR-particles have traversed from their sources to the solar system, and are relative abundances of radioactive isotopes, such as 10Be to stable 9Be or 26Al to stable 27Al, which carry information about the average ‘age’ of CRs. With many new complex experiments taking data or starting up in the near future and with a possibly new generation of long flying balloons, this remains a vital field of research.
Above a few times eV the flux drops to only one particle per square metre per year. This excludes any type of ‘direct observation’ even in the near future, at least if high statistics is required. On the other hand, this energy is large enough so that secondary particle cascades produced in the atmosphere penetrate with a footprint large enough to be detected by an array of detectors on the ground. Such an extensive air shower (EAS) array typically has dimensions of a fraction of a square kilometre to more than 1000 square kilometres and can be operated for many years to detect fluxes down to 1 particle per square kilometre per century or less.
The most prominent features of the CR energy spectrum fall into the energy range covered by EAS experiments. The steepening of the slope from to at about eV is known as the ‘knee’. It was first deduced from observations of the shower size spectrum made by Kulikov and Khristianson et al. in 1956 [1] but it still remains unclear as to what is the cause of this spectral steepening and even as to what are the sources of the high energy CRs at all. At an energy above eV the spectrum flattens again at what is called the ‘ankle’. Because of the large size and/or magnetic field required to accelerate and confine charged particles above eV, the origin of CRs above the ankle is generally considered to be of extragalactic (EG) nature. Finally, the question whether the spectrum extends beyond the Greisen-Zatsepin-Kuzmin threshold of eV [2] is currently among the foremost questions in astro-particle physics as is reflected also by the number of presentations given at this conference.
The main purpose of this paper is to review the experimental data in the energy range below the GZK-threshold, i.e. from about to eV. We shall discuss the energy spectrum, chemical composition, and anisotropies in their arrival directions and critically examine the astrophysical implications by taking into account the systematical uncertainties of the data.
2 THE KNEE REGION
Mainly for reasons of the required power the dominant acceleration sites of CRs are generally believed to be shocks associated with supernova remnants (SNR). Naturally, this leads to a power law spectrum as is observed experimentally. Detailed examination suggests that this process is limited to eV [3, 4] for standard galactic SNRs. This value can be extended upward with a number of mechanisms, for example by introducing higher magnetic fields, larger sources, quasi-perpendicular shocks, reacceleration by multiple sources, etc. However, these assumptions and their effects are not free of debate and possibly, something more fundamental may be incorrect with the suggested supernova (SN) picture and its shock value . In any case, if there is a typical maximum energy which depends linearly on for reasons of magnetic confinement, then the spectrum of CR nuclei must become heavier with increasing energy as the hydrogen cuts off first and then increasingly heavier nuclei reach their acceleration (or confinement) limits.
A change in the CR propagation with decreasing galactic containment at higher energies has also been considered. This increasing leakage results in a steepening of the CR energy spectrum and again would lead to a similar scaling with the rigidity of particles, but would in addition predict anisotropies in the arrival directions of CRs with respect to the galactic plane.
Besides such kind of ‘conventional’ source and propagation models [5, 6] several other hypotheses have been discussed in the recent literature. These include the astrophysically motivated single source model of Erlykin and Wolfendale [7] trying to explain possible structures around the knee by a single recent and nearby SN, as well as several particle physics motivated scenarios trying to explain the knee due to different kinds of CR-interactions, e.g. by photodisintegration at the source [8] or by sudden changes in the character of high-energy hadronic interactions during the development of EAS [9].
Recently, the ‘Cannonball’ model of CRs has been suggested as a radically different theory of CR origin [10]. It is inspired by mounting observational evidence that, in addition to the ejection of a non-relativistic spherical shell, the explosion of core-collapse SNae results in the emission of highly relativistic bipolar jets of plasmoids of ordinary matter, the ‘Cannonballs’ (CB). As the CB with a typical half of the Mercury mass propagates at relativistic speed through the interstellar medium, it encounters electrons, protons, and nuclei kicking them up to higher energies elastically by magnetic deflection. These newly born CRs are then subject to propagation effects, similarly as in ‘classical’ theories. It is argued that this very simple concept explains all observed properties of non-solar CRs at all observed energies. There are two important differences to the conventional models: a) because of the specific kinematics of particle acceleration, the maximum energy of CRs (and thereby the knee positions) scale with the mass of CRs rather than with their charge , b) since the CBs propagate rapidly from the inner SN and GRB realm of the Galaxy into its halo or beyond converting ISM particles to high energy CRs all along their trajectories, there is a much lower level of CR-anisotropy expected than in the traditional SN picture of CRs.
Indeed, the low level of CR anisotropy even at energies above the knee is a long standing problem [11]. Generally, the observed spectrum and the source spectrum are considered to be connected by a relation of the form . A simple power-law fit of the escape time to the available data gives with . Extrapolating to eV, for example, would lead to a value almost as small as the light travel time across the galactic disk, implying a much larger anisotropy than is observed.
From the discussion above it is obvious, that an answer to the question about the origin of the knee is of key importance to reveal information about the origin of galactic cosmic rays in general. Experimental access to such questions is provided by measurements of charged cosmic rays (the classical nucleonic component) and -rays by experiments above the atmosphere, and by the observation of air showers initiated by high-energy particles in the atmosphere.
A wealth of information on potential cosmic-ray sources is provided by recent measurements of TeV -rays employing imaging atmospheric Cherenkov telescopes, most notably from the H.E.S.S. experiment. Their observation of the morphologies and energy spectra of the shell type SNRs RX J1713.723946 [12, 13] and RX J0852.0-4622 [14] are well in agreement with the idea of particle acceleration in the shock front. The spectra extend up to energies of 10 TeV and provide evidence for the existence of particles with energies beyond 100 TeV at the shock front that emerged from the supernova explosions. However, an unequivocally proof for acceleration of hadrons is still missing and questions arise also about the low number of established SNRs showing TeV -ray emission. For example, a recent Galactic plane survey of H.E.S.S. [15] reveals no SNRs brighter than these two in the region covered. This apparent deficit of TeV-bright SNRs may pose some problems in explaining the high energy budget of galactic CRs. Remember that about 10 % of the mechanical energy released by the population of Galactic supernovae needs to be converted into CRs if all SNRs are sites of CR acceleration. Any reduction in the number of TeV-bright SNRs needs to be compensated for by a corresponding factor in the already large value of the CR acceleration efficiency.
To undoubtedly establish SNRs as the sites of CR acceleration and in order to constrain the conventional SN acceleration model from other proposed mechanisms, precise measurements of the primary CR energy spectrum and particularly of the mass composition as a function of energy are needed. Significant progress has been made here as well in recent years, but the situation is far from being clear.
2.1 Comparison of direct and indirect measurements
Cosmic ray measurements on balloons and spacecraft have an important advantage over ground-based air shower experiments: They detect the primary CR particles and measure its charge directly. This is because spacecraft experiments perform the measurement above the atmosphere and balloon-borne experiments typically perform their measurements with residual atmospheres of only -10 g/cm2. This is a relatively small value compared to the typical hadronic interaction length of g/cm2 so that corrections for interactions above the instruments are of minor importance, at least for light particles, such as protons and He nuclei. This advantage is paid for at the expense of lacking statistics at high energies. For example, the largest of the current generation of balloon-borne detectors, TRACER [16], reaches a sensitive volume of m3. It has been flown successfully for 14 days exposure from the Antarctic in 2003 and from Sweden in summer 2006. The first 14 days flight time resulted in an exposure of and allowed to measure e.g. oxygen nuclei up to TeV and iron nuclei up to TeV.
The largest exposure of all direct experiments has been reached by the Japanese American Cooperative Emulsion Experiment JACEE [17] and the RUssian-Nippon JOint Balloon collaboration RUNJOB [18]. JACEE flew a series of thin ( radiation lengths) emulsion/X-ray film calorimeters on 15 flights during 1979-1994 and has reached an exposure of from 11 analysed flights. Taking the zenith angle acceptance out to into account, this relates to approx. . RUNJOB flew roughly a similar set of X-ray films and emulsion chambers on a series of 10 successful balloon flights during 1995-1999 with a total exposure of . Both experiments were able to reconstruct proton spectra up to almost 1 PeV.
Figure 2 shows a collection of the proton, helium, and iron spectra obtained by various ballon- and satellite-borne experiments compared to data from ground based experiments. Obviously, data from direct experiments are sparse above 100 TeV and uncertainties become very large with increasing energies, particularly for primaries heavier than protons. Reasonably good agreement between RUNJOB and JACEE is observed in case of the proton spectrum, but the He-flux measured by RUNJOB is about a factor of two lower compared to other experiments. Comparing the slopes of the p and He spectra yields power law indices of 2.7-2.8 for both elements in the energy range 10-500 TeV/nucleon. The iron spectrum appears somewhat flatter, , particularly when taking into account the extrapolation to the EAS data. Such a dependence of could be explained by charge dependent effects in the acceleration or propagation process. For example, non-linear models of Fermi acceleration in supernovae remnants predict a more efficient acceleration for elements with a large ratio. However, uncertainties may still be too large to allow for definite conclusions about differences in the acceleration and propagation mechanisms of different primaries. For illustration, the effect of an assumed (and possibly underestimated) uncertainty of % in the energy scale is shown by the single error bar in each of the panels.
It is remarkable to see direct measurements and EAS data starting to overlap each other. Clearly, EAS data below about eV are dominated by systematic uncertainties while direct measurements suffer from statistical ones. With these caveats kept in mind, the agreement is very good. The EAS data of KASCADE [20], also shown in figure 2, have been reconstructed based on two different hadronic interaction models employed in the EAS simulations. Except perhaps for iron, the uncertainties caused by the interaction model are of similar size or even smaller than systematic uncertainties between experiments like JACEE and RUNJOB. Also shown in figure 2 are proton and helium spectra derived from emulsion chambers and burst detectors operated within the Tibet II air-shower array [21]. The results are in rough agreement with the KASCADE data. For reasons of clarity, only the results based on simulations with the CORSIKA [22] / QGSJet-model [23] are included for the Tibet data. Those obtained based on Sibyll [24] are similar within their error bars. There are some important peculiarities of the Tibet AS analysis to be pointed out here. The data are compared to EAS simulations assuming in one case a heavy dominated (HD) and in another case a proton dominated (PD) composition. In the HD-model a rigidity dependent knee eV is assumed and in the PD-model all mass components are assumed to break off at eV. These assumptions are surprising, since no experiment ever has observed at break in the spectrum at such low energies. Furthermore, the experimental data of Ref. [21] start only at energies above eV, i.e. significantly above the assumed knee position. Moreover, because of insufficient separation power between proton and helium primaries, the authors have deduced the proton spectrum first by using a neural network algorithm. Next, the proton + helium spectrum has been reconstructed and, finally, the helium spectrum has been obtained by subtracting the number of proton events obtained in the first task from the proton + helium dataset obtained in the second task. Clearly, there are huge correlated errors to be expected in the helium spectrum deduced that way. Also, it is not clear how the results depend on the ad-hoc assumptions made about the knee position. Because of the steeply reconstructed proton and helium spectrum, the authors then conclude, that the main component responsible for the change of the power index of the all-particle spectrum around eV is composed of heavy primaries. However, there is no proof to this statement as the experiment is almost blind to heavy particles (detection efficiency of iron %) .
To conclude this topic, despite some controversy a reasonably good agreement between direct and EAS experiments has been achieved in recent years. At present, EAS experiments at their threshold energies are limited purely by systematic uncertainties, while direct measurements suffer mostly from lacking statistics but also from systematic uncertainties in determining the absolute energy scale. There is some hope that new EAS experiments located at very high altitude will be able to push the measurements down to lower energies and at the same time also reduce their systematic uncertainties. Direct experiments, on the other hand, may be able to increase their exposure at high energies. However, given the very steeply falling spectrum, it appears unlikely that balloon experiments will be able to extend the range of measurements beyond 1 PeV any time in the near future. Thus, the chance of detecting the knee with direct measurements of protons to iron on balloons is not likely to occur without significant increases in the payload and flight duration capabilities of high altitude balloons. Even with 50 times the present JACEE p-He exposure one would still be unable to make definitive measurements about a break in the energy spectrum beyond 200 - 300 TeV [25].
2.2 Air shower data at the knee
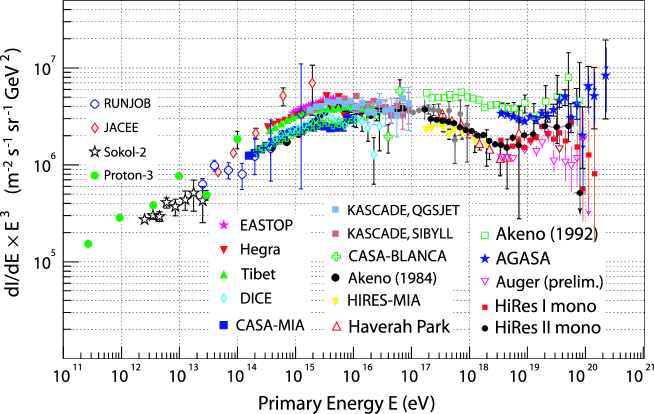
As can be seen from figure 1, a wealth of data at energies around the knee has been accumulated by a large number of experiments operated over many years. It is clearly noticeable that the data fall into two groups differing by their fluxes mostly: CASA-MIA, CASA-BLANCA, and DICE (all operated at Dugway, Utah) show distinctly lower fluxes than Tibet, HEGRA, EAS-TOP, and KASCADE and Tunka [26] (not shown in figure 1). This problem has already been addressed in [27] but is still not fully understood. It may be related to different observation techniques (charged particles combined either with muons or with Cherenkov light), differences in the details of EAS simulations, or to other reasons. On the other hand, it should be pointed out that the differences almost vanish, if one of the groups is shifted by about 15 % in their absolute energy scale, i.e. by an amount well within the systematic uncertainties of the experiments. The knee energy is found in all experiments at approximately 3 PeV with the index changing from to . Only Akeno data are different showing different spectral shapes and a very sharp knee at PeV.
It has been realized that the all-particle spectrum is not very discriminative against astrophysical models of the knee and that a deconvolution into different primary particles is required. However, this is probably the most difficult task in EAS physics, both because of the level of dependence on hadronic interaction models used in EAS simulations and because of the significant (mass dependent) fluctuations of EAS observables. A large variety of methods is used to infer the primary energy and mass [28], most notably the ratio of electron to muon numbers. At energies higher than approx. eV, also direct measurements of the shower maximum in the atmosphere become available by observations of fluorescence light with imaging telescopes, such as operated by HiRes and the Pierre Auger Collaboration (see proceedings to this conference).
Extensive analyses of both the energy spectrum and composition have been performed by EAS-TOP and KASCADE. EAS-TOP has analysed its data through simultaneous measurements of the electromagnetic and muonic shower components. These are obtained from the EAS array operated at Campo Imperatore on the mountain top 2005 m.a.s.l. (820 g/cm2) above the underground Gran Sasso Laboratories in which the MACRO detector has been located under an average depth of 1200 m rock [29]. The coincident observation of the soft charged particles in the surface array and the high energy EAS muons ( TeV) in the underground detector permits – despite large fluctuations of the muon number – a reconstruction of the CR energy spectrum for “light” and “heavy” primaries. The result, depicted in figure 3, shows that the energy spectrum of the light primaries is beginning to diminish at about 5 PeV, whilst the heavy component may be signaling its change in the spectrum at least a decade higher in energy.
The results corroborate those of KASCADE shown in figure 4. KASCADE is located at sea-level (110 m.a.s.l.) in Karlsruhe, Germany, and measures the electromagnetic, muonic, and hadronic EAS components using a very dense detector array and a hadronic calorimeter [30]. The analysis of the data takes advantage of the effect that for given energy, primary Fe-nuclei result in more muons and fewer electrons at ground as compared to proton primaries. Specifically, in the energy range and at the atmospheric depth of KASCADE, a Fe-primary yields about 30 % more muons and almost a factor of two fewer electrons as compared to a proton primary. The basic quantitative procedure of KASCADE for obtaining the energy and mass of the CRs is a technique of unfolding the observed two-dimensional electron vs truncated muon number spectrum into the energy spectra of primary mass groups [20]. The problem can be considered a system of coupled Fredholm integral equations of the form
where the probability
is another integral equation with the kernel function factorizing into three parts. Here, describes the shower fluctuations, i.e. the 2-dim distribution of electron and truncated muon number for fixed primary energy and mass, describes the trigger efficiency of the experiment, and the reconstruction probabilities, i.e. the distribution of and that is reconstructed for given true numbers , of electron and truncated muon numbers. The probabilities are obtained from CORSIKA simulations using QGSJET-01 [23] and Sibyll 2.1 [24] as high-energy and GHEISHA [31] as low-energy hadronic interaction models and a moderate thinning procedure. Smaller samples of fully simulated showers were generated for comparison. The simulated data are then fed into the detector Monte Carlo programme and the response is parameterized as a function of energy and mass. Because of the large shower fluctuations, unfolding of all 26 energy spectra ranging from protons to Fe-nuclei is clearly impossible. Therefore, 5 elements (p, He, C, Si, Fe) were chosen as representatives for the entire distribution. More mass groups do not improve the -uncertainties of the unfolding but may result in mutual systematic biases of the reconstructed spectra.
The results of such an unfolding are presented in figure 4. Shown are the spectra of the p, He, and C mass-groups based on the response matrices obtained from the two interaction models. Clearly, there are common features but also differences in the energy distributions. In each of the distributions a distinct break in the spectrum is observed which is increasing towards higher energy with increasing primary mass. In both cases the He flux is higher than the proton flux. This finding may be surprising at first sight, but it is already suggested by extrapolating the He and proton spectra with their different slopes from lower energies towards the knee (see figure 2). The spectrum of the Si group (see figure 14 and 15 in Ref. [20]) indicates a knee at even higher energies. The Fe spectrum (figure 2) shows large differences when performing the unfolding either with the QGSJET or Sibyll model demonstrating that such analyses are limited at present mostly by uncertainties of the hadronic interaction models. Despite these differences in the individual spectra, the all-particle spectra of KASCADE (see figure 1), obtained by summing up the energy spectra of all mass groups (p - Fe) coincide very nicely for the two interaction models. Thus, it can firmly be stated that the knee in the all particle spectrum is caused by light (p and He) primaries. Obviously, also the mean mass composition (e.g. expressed in terms on the mean logarithmic mass [32]) increases above the knee.
A more detailed investigation [20] shows that the QGSJET model performs reasonably well at high energies but exhibits some problems at PeV energies. Sibyll, on the other hand, describes the data rather well in the knee region but suffers from a muon deficit at higher energies. Therefore, it suggests a more prominent contribution of heavy primaries at high energies. It should be emphasized, that this muon deficit of Sibyll applies to muons only. Muons at energies of several 100 GeV, such as observed by underground experiments like AMANDA and IceCube, seem to be described rather well by Sibyll [33]. Very recently, a new interaction model, called EPOS has been released [34]. Most importantly, it provides a better description of baryon-antibaryon production at high energies. A preliminary analysis shows that the muon number increases more rapidly with energy than in QGSJET or Sibyll with the muon density being about 40 % higher at eV compared to QGSJET-01 calculations. It will be interesting to repeat the unfolding of the CR energy spectra employing this model to verify whether the present deficiencies of the interaction models will be resolved.
The unfolded KASCADE energy spectra can directly be compared to phenomenological calculations of astro- and particle physics related models or can be used to infer information about the CR sources. An example is shown in figure 5 taken from Ref. [11]. It is concluded that the data provide support for the supernova picture of CR origin, i.e. the distinct knee near 3 PeV would be related to emission by the free expansion phase of SNRs. However, a question arises about how to fill the gap from the iron knee at about eV to the ankle at eV. These CRs may originate from SN type II explosions into dense stellar winds where the interaction generates much stronger magnetic fields. This may result in rigidities up to at least V (component ‘B’ in figure 5), especially from a few abnormally high speed/low mass ejections [11].
A very important question is whether the present data allow to distinguish a knee of constant rigidity () from that of constant energy per nucleon (), such as is predicted by particle physics interpretations of the knee or by the cannonball model. Unfortunately, changes only from in case of He to for Fe nuclei. Hence, the question about the rigidity dependence needs to be answered basically by comparing the energy spectra of p and He primaries. Ironically, these are the two primaries which are most strongly affected by EAS fluctuations, so that their energy resolutions are deteriorated substantially. In fact, overlaying the p and He spectra of figure 4 using and abscissas does not give a clear answer; Sibyll exhibits a slight preference for charge scaling and QGSJET for mass scaling. It is hoped, that the situation will improve somewhat with better models becoming available. Improving on the data side seems more difficult because of two reasons: statistical errors are already much smaller than systematical ones and (presently not yet included) data from larger zenith angles are subject to even stronger EAS fluctuations.
3 THE SECOND KNEE AND ANKLE: TRANSITION FROM GALACTIC TO EXTRAGALACTIC COSMIC RAYS
Besides the prominent knee in the all-particle spectrum, additional structures are observed at about eV and eV, known as the second knee and the ankle, respectively (see Figs. 1 and 5). The ankle has been reported convincingly by a number of experiments, but there is still no consensus about the existence of a second knee. This is because of both the weakness of the structure making it difficult to detect and because of only few experimental data, most of which are either at their upper or lower limit of detectable energies. A blow-up of the data between eV and eV is shown in figure 6. It includes measurements by Akeno [35], Fly’s Eye (stereo) [36], Haverah Park [37], Yakutsk [38], and HiRes II (mono) [39]. Akeno has provided the first hint of a change in the index of the power-law energy spectrum around eV. The steepening of the spectrum was confirmed by Haverah Park and is indicated also in the Fly’s Eye and more recent HiRes data. A recent re-analysis of the Yakutsk 1974-2004 data agrees well with the Akeno data providing additional support for the existence of a second knee at about eV. The ankle at eV was first observed by Haverah Park, Akeno, and Yakutsk and is traditionally explained in terms of the transition from galactic to EGCRs. The key point here is that one expects the galactic magnetic field to lose its efficiency at about this energy as the gyro-radius of a particle at charge in a -Gauss field, , becomes comparable to the thickness of the galactic disk. It then becomes natural to think of hard EGCRs starting to penetrate into the galaxy and dominating the flux at higher energies (see figure 5 for illustration).
Figure 5 also provides an intuitive explanation for the second knee: it would primarily be caused by the break of the galactic Fe component. As Hillas pointed out [11], an extra component ‘B’ would be needed in order to make up the well-measured total CR flux at several eV for which he considered SNae Type II explosions into dense stellar winds (see chapter 2.2). Naïvely, the second knee in this picture is expected at eV or even lower if the knee is composed of p and He primaries as suggested by figure 4. This is almost a factor of 10 lower than reported by Akeno and others. A scaling of the knee position with would bring the Fe-knee up to approx. eV, but still too low to fit the classical picture.
Ignoring this puzzle for a moment, also characteristic changes of the CR composition are expected in this traditional picture of the knees and ankle. Up to the knee, the composition would follow the standard source composition dominated by p and He primaries. Between the first and second knee the composition would change to become iron dominated, and above the ankle it would be dominated by extragalactic protons.
However, the ‘folklore’ about the second knee and ankle and its related transition from galactic to EGCRs is not free of dispute and has received much attention recently. Back in the 80s, Berezinsky and collaborators have pointed out an inevitable feature of the - eV EGCR spectrum: if EGCRs consist of protons mostly, they would suffer - besides the GZK effect - from energy losses associated with the production of pairs in the CMB photon field [40]. This would result in a modulation of the all-particle energy spectrum to what is called a “pair-production dip” between - eV. In such a way, the turn over from the left- to the right hand side of the ‘dip’ would mimic the ankle. Moreover, since the Bethe-Heitler pair production works effectively only for protons [41], the ankle can then be interpreted as a signature of a pure proton EGCR component and the galactic-extragalactic transition must occur at much lower energies than in the traditional picture, possibly around the second knee.
How can the two models be discriminated? The most critical observation is provided by a measurement of the chemical composition in the energy range around eV: In the dip model a strong dominance of protons, and in the ankle model a strong dominance of iron nuclei is expected. A recent confrontation of the two models to existing data has been performed by Allard et al. [42]. The authors conclude that the all-particle energy spectrum is reproduced equally well by the two models. However, based on a comparison of the mean mass composition, analyzed in terms of the mean depth of the shower maximum, , they favour the traditional model. Figure 7 compares the data of various experiments with the dip- and ankle-model of [42]. Here, only CORSIKA / QGSJET-01 simulations are shown, because QGSJET-01 is the interaction model providing the most consistent description of experimental data in this energy region. Clearly, this direct comparison with QGSJET-01 does not seem to give preference to any of the two models. Also shown are predictions of the cannonball model for two choices of penetrability of EGCRs into the Galaxy [10]. It should be noted, that in the latter case, is constructed by a simplified model described in Ref. [46] instead of using full EAS simulations. Evidently, better data are required before definite conclusions can be drawn about the transition from Galactic to extra-galactic CRs.
4 ANISOTROPIES
Another key observation in cosmic ray astrophysics is the directional distribution of the particles. That distribution will depend on any galactic magnetic fields and hence will be energy (rigidity) dependent. However, with very limited exceptions, which are not individually statistically significant, there is no observed deviation from isotropy above the knee of the energy spectrum, and any anisotropies at lower energies are themselves very small [47, 48]. Probably, the most comprehensive data at energies from a few to several hundred TeV have been obtained by the Tibet AS experiment. Besides revealing fine details of known anisotropies, the data support the picture of corotation of low energy CRs with the local Galactic magnetic environment and they may indicate an anisotropy around the Cygnus region [49]. However, a contamination of TeV ’s in the data sample cannot be excluded at present.
A non-uniform distribution in of the arrival directions, suggestive of a source direction, in the energy range - eV has been reported by the AGASA [50] and similarly by the SUGAR collaboration [51]. However, neither of those observations on their own is clearly statistically significant. Moreover, the Pierre Auger Collaboration has also started to analyse the galactic centre region. These results, obtained with much larger exposure than of AGASA and SUGAR, do not support that finding and instead provide an upper bound on a point-like flux of CRs from the Galactic Centre. Even in absence of CR point sources, such data may be regarded as the possible beginning of a new era in cosmic ray astrophysics in which we can begin directional cosmic ray astronomy. The possibility of having a source to observe may indeed open up new frontiers for the Pierre Auger Observatory [53, 54].
As already pointed out, the low level of CR anisotropy even at energies above the knee is considered the most serious challenge to the standard model of the origin of galactic CRs from diffuse shock acceleration [11]. Figure 8 shows a collection of data expressed in terms of the Rayleigh amplitudes . The thin lines represent a CR diffusion model [55] predicting anisotropies on a scale of to depending on particle energy and strength and structure of the galactic magnetic field. However, the model fails to describe the all-particle spectrum considerably. Assuming a simple rigidity model of , Hillas estimates anisotropies at a level of 5 %, 16 %, and 180 % at eV, eV, and eV, respectively [11]. In case of a scaling, the values would go down to 0.6 %, 1.1 %, and 3.7 % which is still in contradiction to the experimental data of figure 8.
As already mentioned, the CB-model [10] predicts much lower levels of anisotropies than models in which CRs diffuse away from the central realms of the Galaxy, where most SN explosions take place. A CB, on the contrary, is considered a continuous source of CRs along its trajectory from the galactic disk into the galactic halo. Along its trajectory, the source intensity depends on the local and previously traversed ISM density. Thus, the source of CRs is very diffuse and the directional anisotropy of CRs at the Earth s location is expected to be very small and to vary little with energy.
5 SUMMARY AND OUTLOOK
Diffusive shock acceleration in SNRs is considered a viable mechanism for accelerating cosmic rays and it naturally leads to a power-law spectrum in rigidity. However, many fundamental questions related to the assumption of SNRs being the sources of galactic cosmic rays are still open. These questions include, amongst others, the absence of TeV -radiation from a large fraction of SNRs, the origin of the knee in the cosmic ray spectrum, the low level of global anisotropies in their arrival direction, the transition of galactic to extragalactic CRs and its related question about the existence of a second knee and about the origin of the ankle.
The deconvolution of the all-particle CR spectrum into energy spectra of individual mass-groups by current KASCADE data [20] has advanced the field quite a lot. Such kind of data contain much more information than the all-particle spectrum and the mean mass of CRs (expressed mostly by and ) alone. However, there remain large uncertainties, which still allow alternative interpretations. Most prominently, a definite answer about an (rigidity) or scaling of the knee position cannot be given at present. However, there is still some room for improving the data quality and, despite enormous progress already made, there are also better hadronic interaction models being developed which are hoped to eliminate the still existing shortcomings of the present models such as Sibyll 2.1 or QGSJET01 [34].
At energies above eV data become very sparse and we are far from understanding the transition from galactic to extragalactic CRs. Although the ankle in the CR spectrum at about eV is often interpreted as the signature of the transition from a steeply falling galactic CR-spectrum to a slightly harder extragalactic spectrum, alternative explanations are possible. Sometimes the second knee at about eV is considered as indication for the transition to extragalactic CRs, but this explanation would require fine-tuning of the injection spectra of the different galactic and extragalactic sources. Two particular models were discussed in detail, the dip- [41] and the ankle-model [11]. Current data on do not allow to exclude any of the two models. The transition from galactic to extragalactic CRs occurs in the energy region of the second knee and is distinctly seen only if iron and proton spectra are measured separately.
In conclusion, the fundamental question about the origin of high energy CRs below the GZK energy remains far from being answered. As a consequence, the interest in studying CRs from about to eV with high quality state of the art EAS detectors has grown worldwide and several new experiments are being prepared or planned for. These include KASCADE-Grande (already in operation) [56] as well as low-energy extensions of Auger by High Elevation Auger Telescopes (HEAT) and an infill array with extra muon detectors, as well as the Telescope Array (TA) and its low-energy extension TALE [57]. These detectors can reliably solve the problem of measuring the energy spectrum and mass composition in the transition region and complement the measurements performed at the highest energies by the Pierre Auger Observatory.
Acknowledgments Its a pleasure to thank the organizers for their invitation to the CRIS 2006 workshop which was conducted in a very pleasant and fruitful atmosphere. The author is grateful to M. Risse for carefully reading the manuscript. The work of the group at University Wuppertal is supported in part by the Helmholtz VIHKOS Institute and by the German Ministry for Research and Education.
References
- [1] G.V. Kulikov and G.B. Khristiansen, Zh. Eksp. Teor. Fiz. 35 (1958) 635
- [2] K. Greisen, Phys. Rev. Lett. 16 (1966) 748, and G.T. Zatsepin and V.A. Kuz’min; Sov. Phys. JETP Lett. (Engl. Transl.), 4 (1966) 78
- [3] P.O. Lagage C.J. and Cesarsky, Astron. Astrophys. 118 (1983) 223 and 125, 249
- [4] E.G. Berezhko, H.J. Völk, Astron. Astrophys. 357 (2000) 283
- [5] L. O’C. Drury, Contemp. Phys. 35 (1994) 231
- [6] E.G. Berezhko and L.T. Ksenofontov, J. Exp. Theor. Phys. 89, (1999) 391
- [7] A.D. Erlykin and A.W. Wolfendale, J. Phys. G23 (1997) 979
- [8] J. Candia, L.N. Epele, E. Roulet, Astropart. Phys. 17 (2002) 23
- [9] S.I. Nikolsky, Nucl. Phys. B (Proc. Suppl.) 39A (1995) 157
- [10] A. Dar and A. de Rújula, arXiv:astro-ph/0606199. See also A. de Rújula proceedings to this conference arXiv:hep-ph/0608092
- [11] M.A. Hillas, J. Phys. G31 (2005) R95
- [12] F. Aharonian et al. (HESS Collaboration), Nature 432 (2004) 75.
- [13] F. Aharonian et al. (HESS Collaboration), Astron. Astrophys. 449 (2006) 223
- [14] F. Aharonian et al. (HESS Collaboration), A&A 437 (2005) L7
- [15] F. Aharonian et al. (HESS Collaboration), Astrophys. J. 636 (2006) 777
- [16] D. Müller et al., 29th International Cosmic Ray Conference Pune 3 (2005) 89
- [17] K. Asakimori et al., ApJ 502 (1998) 278.
- [18] V.A. Derbina et al. ApJ 628 (2005) L41
- [19] J. Hörandel, arXiv:astro-ph/0508014
- [20] T. Antoni et al. (KASCADE-Collaboration), Astropart. Phys. 24 (2005) 1
- [21] M. Amenomori et al. (The Tibet AS Collaboration), Phys.Lett. B632 (2006) 58
- [22] D. Heck et al., Report FZKA 6019, Forschungszentrum Karlsruhe (1998)
- [23] N.N. Kalmykov and S.S. Ostapchenko, Phys. Atom. Nucl. 56 (1993) 346
- [24] R. Engel et al., Proc. Int. Cosmic Ray Conf., Salt Lake City (USA) 1 (1999) 415
- [25] M.L. Cherry, to be published, J. Phys. Conf. Ser.; arXiv:astro-ph/0512329
- [26] N.M. Budnev et al., ICRC Pune (2005) p.101; arXiv:astro-ph/0511215
- [27] S.P. Swordy et al., Astropart. Phys. 18 (2002) 129
- [28] K.-H. Kampert, J. Phys. G (Nucl. Part. Phys.) 27 (2001) 1663
- [29] M. Aglietta et al. (EAS-TOP and MACRO Collaborations), Astropart. Phys. 20 (2004) 641.
- [30] T. Antoni et al. (KASCADE-Collaboration), Nucl. Instr. Meth. A513 (2003) 490
- [31] H. Fesefeldt, Report PITHA-85/02, RWTH Achen (1985)
- [32] K.-H. Kampert; Conference Proceedings Vol. 85, SIF, Bologna, 2003, ISBN 88-7438-011-9, p.485-493; arXiv:astro-ph/0212348
- [33] T. Montaruli, private communication (2006)
- [34] T. Pierog, K. Werner, arXiv:astro-ph/0611311
- [35] M. Nagano et al., J. Phys. G18 (1992) 423
- [36] D.J. Bird et al., Phys. Rev. Lett. 71 (1993) 3401
- [37] M.A. Lawrence, R.J.0. Reid and A.A. Watson, J. Phys. 17 (1991) 733
- [38] A. V. Glushkov and M. I. Pravdin, JETP 101 (2005) 88
- [39] G. Thomson et al. (HiRes Collaboration), arXiv:astro-ph/0609403
- [40] V.S. Berezinsky, S.I. Grigor’eva, Astron. Astropys. 199 (1988) 1
- [41] R. Aloisio et al., Astropart. Phys. (2006) in press; arXiv:astro-ph/0608219
- [42] D. Allard, E. Parizot, A.V. Olinto, Astropart. Phys. (2006) in press; arXiv:astro-ph/0512345
- [43] R.U. Abbasi et al. (HiRes Collaboration), ApJ 622 (2005) 910
- [44] T. Abu-Zayyad et al., Phys. Rev. Lett. 84 (2000) 4276
- [45] B.N. Afanasiev Proceedings of Tokyo Workshop on techniques for the Study of extremely high energy cosmic rays, 1993
- [46] R. Wigmans, Astropart. Phys. 19 (2003) 379
- [47] R.W. Clay, M.A. McDonough, A.G.K. Smith, 25th ICRC, Vol. 4 (1997) 185
- [48] T. Antoni et al. (KASCADE Collaboration), Astrophys. J. 604 (2004) 687
- [49] M. Amenomori et al.(The Tibet AS Collaboration), Astrophys. J. 604 (2004) 687
- [50] N. Hayashida et al. (AKENO Collaboration), Astropart. Phys. 10 (1999) 303
- [51] J.A. Bellido et al., Astropart. Phys. 15 (2001) 167
- [52] J. Abraham et al. (Pierre Auger Collaboration), Astropart. Phys. (in press); arXiv:astro-ph/0607382
- [53] A. Letessier-Selvon et al. (Pierre Auger Collaboration), talk given at this conference
- [54] A. Cuoco, talk given at this conference; arXiv:astro-ph/0609577
- [55] J. Candia, S. Mollerach, E. Roulet, J. Cosmol. Astropart. Phys. (JCAP) 05 (2003) 003
- [56] F. DiPierro et al. (KASCADE-Grande Collaboration), Proceedings to this conference
- [57] K. Martens et al., Proceedings to this conference