A broadband spectroscopic search for CO line emission in HDF850.1: the brightest submillimetre object in the Hubble Deep Field North
Abstract
Using the 100-m Green Bank Telescope, we have conducted a cm-wavelength search for CO J=1-0 line emission towards the high-redshift, far-infrared luminous object, HDF850.1 over the redshift interval 3.3 5.4. Despite the wealth of existing multi-wavelength observations, and the recent identification of a galaxy counterpart in deep band (2.2 m) imaging, an unambiguous spectroscopic redshift has not yet been obtained for this object. A far-infrared-to-radio wavelength photometric redshift technique however, predicts a 90% probability that the redshift is in the range, 3.3 5.4 (equivalent to an observed redshifted CO J=1-0 emission line frequency, 26.5 18.0 GHz), making HDF850.1 a potential occupent of the ‘high-redshift tail’ of submm selected galaxies. We have also conducted a search for CO J=2-1 line emission over the narrower redshift range, 3.9 4.3. Although we do not detect any CO line emission in this object, our limits to the CO line luminosity are in broad agreement with the median value measured in the current sample of high-redshift, submm selected objects detected in high-J CO line emission, but not sufficient to fully test the validity of the photometric redshift technique.
keywords:
galaxies: starburst – galaxies: individual: HDF850.1 – radio lines: galaxies – cosmology: observations1 Introduction
In recent years, blank-field extragalactic surveys at submillimetre/millimetre (hereafter submm) wavelengths have revealed a population of dusty galaxies undergoing vigorous star formation in the young Universe (e.g. Smail, Ivison & Blain 1997; Hughes et al. 1998; Barger et al. 1998; Bertoldi et al. 2000; Scott et al. 2002; Borys et al. 2003; Greve et al. 2004; Laurent et al. 2005). Independent methods of redshift determination for these objects imply that the majority lie at, z (Aretxaga et al. 2003, 2005; Chapman et al. 2003a, 2005). Thus their inferred star formation rates are in the range, 100 to 1000 M⊙ yr-1, and arguably require large reservoirs of molecular gas for fuelling such high levels of sustained activity. Measuring the total molecular gas mass contained within the interstellar medium (ISM) of a high-redshift submm galaxy (hereafter SMG) is most effectively accomplished through observations of redshifted molecular CO line emission.
Over the past 15 years, observing CO line emission in high-redshift objects has become a powerful means of constraining the physical conditions of the gas within their molecular ISM (for an excellent review see Solomon & Vanden Bout 2005). The luminosity in the CO J=1-0 line is the optimal estimator of the total molecular gas mass yet, for practical reasons, in gas-rich objects at high-redshift (z ), searches are normally first conducted for emission from high-J (Jupper 2) CO line transitions, and subsequent searches for CO J=1-0 emission are carried out if the mm-wavelength searches for high-J CO lines are successful. This approach can bias the sample of objects detected in CO line emission to those with hotter, and denser gas.
To date, high-J CO line emission has been detected in 14 SMGs (Frayer et al. 1998, 1999; Neri et al. 2003; Genzel et al. 2003; Downes & Solomon 2003; Sheth et al. 2004; Kneib et al. 2005 Greve et al. 2005; Tacconi et al. 2006), while the CO J=1-0 line has been detected in only one of these (Hainline et al. 2006). In addition to the faintness of molecular emission lines in high-redshift SMGs, searches have been hindered by the limited spectral bandwidth of current mm-wavelength facilities, generally covering 1700 km s-1 at 3 mm, while the typical SMG CO linewidth is 800 km s-1 FWHM. This narrow bandwidth can also be restrictive as galactic outflows in many high-redshift SMGs may lead to velocity offsets between the redshifts derived from Ly and CO emission lines. In some SMGs this difference may be greater than 600 km s-1 (e.g. Greve et al. 2005), due possibly to galactic outflows, or scattering of Ly photons by dust. As CO emission-line frequencies are not expected to be biased with respect to the systematic redshift, broadband spectroscopic searches for CO line-emission should be a powerful means of obtaining redshifts for the SMG population.
Educated searches for mm-to-cm wavelength molecular CO line emission in luminous, dusty galaxies without redshifts, will become feasible in the near future as wideband spectrometers are available on large mm-to-cm wavelength telescopes, for example the 100-m Green Bank Telescope (GBT111The Green Bank Telescope is a facility of the National Radio Astronomy Observatory, operated by Associated Universities, Inc. under a Cooperative Agreement with the National Science Foundation.; Jewell & Prestage 2004), or the 50-m Large Millimeter Telescope (LMT222http://www.lmtgtm.org). In order to obtain redshift estimates, and to guide the frequency tunings of these spectroscopic searches for molecular line emission from SMGs, some groups have developed photometric redshift techniques which exploit the far-infrared-to-radio wavelength correlation in star-forming galaxies (Helou et al. 1985), or adopt template far-infrared spectral energy distributions (SEDs) based on nearby galaxies (Carilli & Yun 1999, 2000; Dunne, Clements & Eales 2000a; Rengarajan & Takeuchi 2001; Hughes et al. 2002; Aretxaga et al. 2003; Wiklind 2003; Hunt & Maiolino 2005). This technique has the potential to provide redshift estimates for large samples of SMGs with individual accuracies, 0.3, when photometric flux measurements of three or more far-infrared-to-radio wavelengths are available (Aretxaga et al. 2005).
The GBT is the only operational mm-to-cm wavelength telescope in the world with instruments that have both sufficient spectral line sensitivity and receiver bandwidth to conduct guided searches for CO line emission in SMGs at redshifts . This lower redshift limit is set by the current GBT frequency limit of 60 GHz and the CO J=1-0 line rest frequency of 115.2712 GHz. Given this restriction, an excellent candidate for conducting a blind search for CO line emission is HDF850.1 (Hughes et al. 1998), one of the most well studied SMGs, and the brightest 850 m source in the confusion limited JCMT/SCUBA survey of the northern Hubble Deep Field. Due partly to the extreme optical faintness ( 23.5, ) of the gravitationally lensed galaxy counterpart to HDF850.1 (Dunlop et al. 2004), the redshift of this object has proven elusive. A wealth of deep rest-frame far-infrared-to-radio wavelength observations of HDF850.1 provide the basis for a photometric redshift z4.10.5 (Yun & Carilli 2002; Aretxaga et al. 2003). In principle, HDF850.1 presents an ideal target for the GBT with which to test the accuracy of our photometric redshift technique, and thus has motivated a GBT search for CO J=1-0 and CO J=2-1 line emission over the redshift interval, 3.3 5.4.
We present the results of a GBT search for CO J=1-0 line emission in HDF850.1 over the redshift interval, 3.3 5.4, and a search for CO J=2-1 line emission over the narrower redshift interval, 3.9 4.3. Throughout this work, we adopt the following -dominated cosmological parameters: km s-1 Mpc-1, , (Spergel et al. 2003, 2006).
2 Observations and Data Reduction
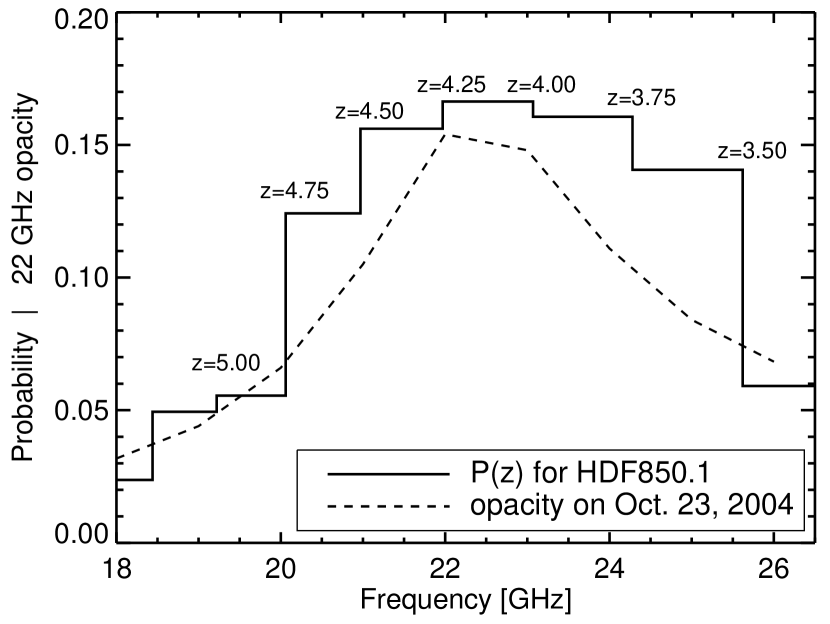
The far-infrared-to-radio wavelength photometric redshift estimate of Aretxaga et al. (2003) implies an 86 to 90% probability that HDF850.1 has a redshift in the range, 3.3 5.4. Over this redshift interval, the 115.2712 GHz CO J=1-0 line is redshifted into the 18.0 to 26.5 GHz frequency window of the K-band receiver on the GBT. Motivated by this prediction, we have obtained a complete K-band spectrum of HDF850.1 in order to search for redshifted CO J=1-0 line emission.
Observations in nod mode were carried out with the GBT K-band receiver during October 2004 and May 2005. The position center adopted for the on-source beam was that of the mm-wavelength counterpart detected with the Plateau de Bure Interferometer (PdBI) by Downes et al. (1999). All of the K-band observations were conducted under reasonably dry conditions, with an average 22 GHz zenith opacity, . The nearby quasar 3C295 was used for pointing purposes, as well as baseline and flux calibration throughout the K-band observations. To correct for slowly varying, large-scale spectral baseline features, the observations were made by alternately nodding two beams separated by 178.8′′, between the source and blank sky. The GBT spectrometer allows a maximum instantaneous frequency coverage of 800 MHz bandwidth in each of 4 independent quadrants. For the observations presented here, one pair of quadrants was used to measure a 1.5 GHz wide spectra on the source, while the other pair measured blank sky in the off-beam. A total of 6 tunings (or sequences) were therefore used to cover the entire K-band window. Each spectral channel was 0.39 MHz wide so that the velocity resolution varied from 4.4 km s-1 to 6.5 km s-1 across the band. A total of 28.2 hours of integration time was devoted to the HDF850.1 K-band spectrum. The time spent on each 1.5 GHz tuning sequence was varied to compensate for the increased opacity towards the center of the band, due to the 22 GHz atmospheric water vapour line. The goal was to obtain a spectrum with uniform noise across the K-band. Overheads such as pointing, focusing, acquisition of baseline calibration spectra, and follow-up of potential CO line detections, amounted to an additional factor of 2 increase in the observing time.
In December 2005, a search was also conducted for CO J=2-1 emission using the GBT Q-band receiver (40 to 48 GHz), over the redshift interval, 3.91 4.25. As in the case of the K-band observations, the nod observing mode was adopted, while the spectrometer was set up in wide bandwidth, low resolution mode. The velocity resolution varied from 2.5 km s-1 to 2.7 km s-1 across our Q-band spectrum. As there is a dearth of bright, compact calibration sources at these higher frequencies, the primary flux calibrator was 3C286, while the nearby quasar 1153+495 (17o separation) was used for pointing.
Obtaining quality spectra with the GBT Q-band receiver generally requires low wind speeds (3 m s-1), and an extremely dry, stable atmosphere. Only on a single night in December 2005, was data obtained under just such conditions, with a median and negligible wind speeds. Despite acceptable Q-band weather conditions during this, and possibly one other observing shift, only the left polarization Q-band spectra is included in our analysis, as the majority of the right polarization spectra suffer from a severe baseline ripple of unknown origin (see §2.1).
Both the K-band and Q-band spectra were reduced using the gbtidl333http://gbtidl.sourceforge.net data analysis package. For a series of consecutive scans, a co-added spectrum is produced following the standard procedures described by Vanden Bout, Solomon & Maddalena (2004), which are only outlined here for completeness.
For simplicity, we will consider the spectrum in only one quadrant, and
one polarization from each of the two beams in the discussion that follows.
Let us refer to these spectra
as and , where one of the two beams is always pointed
‘ON’ the source, while the ‘OFF’ beam is observing blank sky separated from
the source by 178.8′′in azimuth. A single scan is the time that one beam
spends on-source before nodding to the off-source position, when the
other beam
is nodded onto the source. For our observations, a scan duration of 1 minute,
during which one beam is on-source before nodding to the off-source position,
was adopted. This scan duration is chosen so as to minimize the frequency
dependent variation in the sky brightness temperature between successive
scans, while also spending less time on overheads such as nodding.
Assuming that begins
on-source at scan , then a series of normalized spectra are produced by
subtraction of the off-source scan from the on-source scan
(note that from this point on, the dependance will not be made
explicit):
etc….
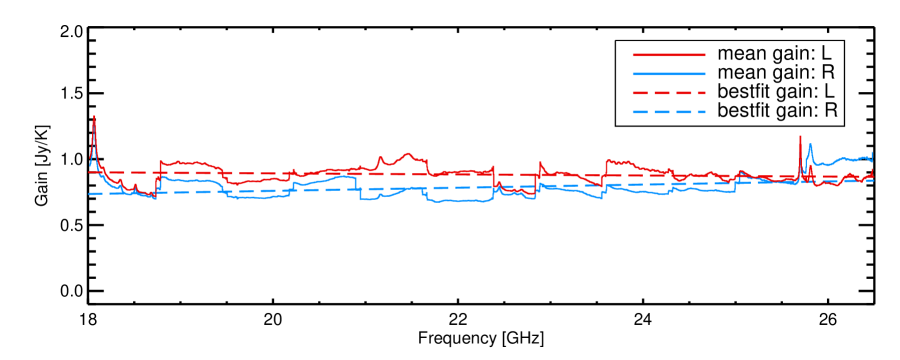
It is important that each normalized spectrum be created from the ‘ON’-‘OFF’ scan pair that travel down the same signal path (ie. the signal from a single beam and polarization), so that any path-dependent sources of baseline structure may be properly subtracted. An average of these normalized spectra is then calculated, with each spectrum weighted by the inverse square of the system temperature, . The units of this mean spectrum are then calibrated from [K] to [Jy] using the best-fit gain curves shown for the K-band observations in Figure 2. The gain curves were derived from observations of objects with known (and non-variable) radio flux densities (3C295 for the K-band spectrum, and 3C286 for the Q-band spectrum).
The left and right polarization spectra are analyzed separately so that any potential detection of CO line emission would have to be confirmed in both polarizations. A large fraction of the data (53%) were considered unusable due to various forms of spectral baseline irregularities and contamination which could not be removed reliably during the data reduction process (see §2.1). We attempted to use spectra of the bright pointing sources to correct the baseline shapes in these spectra (Vanden Bout, Solomon & Maddalena 2004), however we found that this did not improve our results. After removal of the poor quality data, the total on-source integration time devoted to the final K-band spectra is 12.3 hours in the left polarization spectra, and 13.9 hours in the right polarization spectra (see Table 1).
| Seq.# | [GHz] | (L/R) [hrs] | (L/R) [mJy] |
|---|---|---|---|
| K1 | 2.7 / 3.1 | 0.58 / 0.69 | |
| K2 | 2.2 / 1.8 | 0.51 / 0.61 | |
| K3 | 2.1 / 3.1 | 0.50 / 0.52 | |
| K4 | 1.8 / 2.6 | 0.60 / 0.46 | |
| K5 | 1.5 / 1.2 | 0.98 / 0.85 | |
| K6 | 1.9 / 2.1 | 0.77 / 0.72 |
2.1 Spectral Baselines
A major obstacle faced by searches for faint, broad emission lines, is the presence of variations in the spectral baseline shape, with a characteristic scale similar to the expected CO linewidths. These features are not uncommon in mm/cm wavelength spectra obtained with single-dish instruments, and can easily be mistaken for detections of weak, broad emission lines. There are a number of instrumental, as well as atmospheric effects which may produce spectral baseline artefacts. Here, we summarize a few such artefacts which have been identified in our GBT (K and Q-band) spectra of HDF850.1:
-
•
Weather variations over short timescales (on order of the length of a single scan of 1 minute duration) may result in inaccurate subtraction of the atmospheric contribution to the system temperature across the band. This is particularly problematic at Q-band frequencies, where clouds passing overhead may lead to rapid changes in the temperature of the atmosphere within a single beam.
-
•
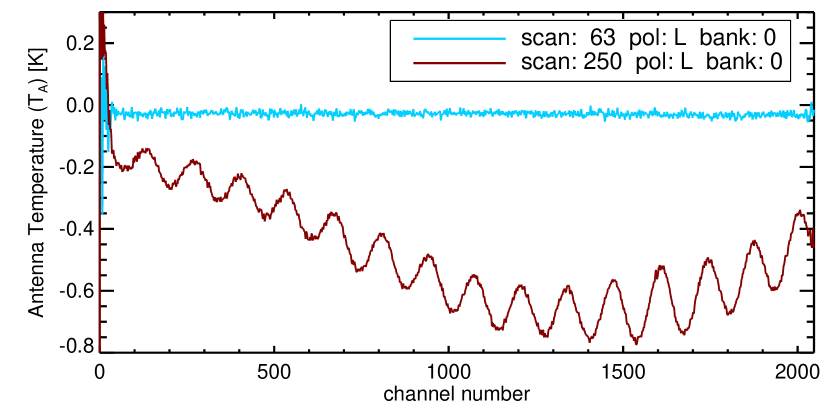
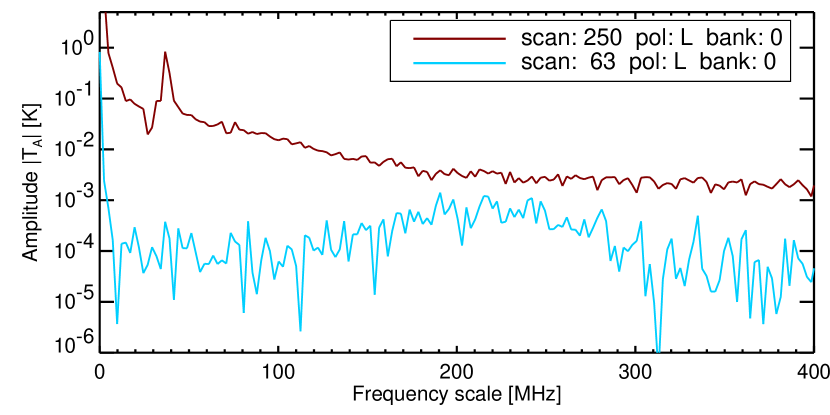
There may be interference from sources along the path of the analog signal, originating at the receiver on the telescope and travelling to the spectrometer backend in the GBT control room. An example of this is the 50 MHz ripple which appears in the left polarization K-band spectra taken during May, 2005 (Figure 3), and is due to temperature variations in the equipment room where the spectrometer is located. These variations cause standing waves in the connectors which manifest themselves as ripples in the spectral baseline.
-
•
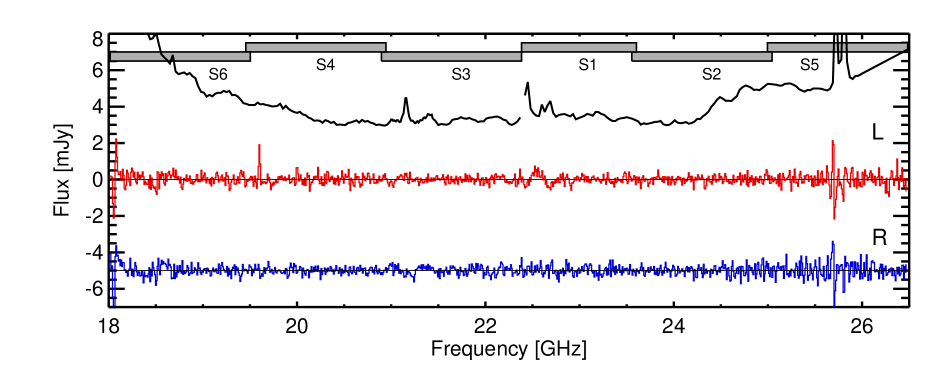
Resonances in the receiver feeds may cause a loss of power at certain frequencies, leading to emission or absorption lines, sometimes referred to as ‘suck-outs’. When calculating from the on-source and off-source spectra, there will be a feature which is either in emission or absorption, depending on whether the power loss is in the on, or the off-beam. These ‘suck-outs’ are apparent in the K-band receiver temperature curve shown in Figure 4(a) (e.g. at frequencies of 22.6 GHz and 25.7 GHz), and may also be present in the Q-band receiver system (however at present, no high-resolution receiver temperature data are available for this receiver).
-
•
A high-frequency ripple severely affected the right polarization Q-band spectra taken in December, 2005 (but may also be present in the left polarization at a lower amplitude), and is of an unknown origin.
Data which was infected by any of these artefacts was not included when creating the final spectra. Thus 53 of the original data were discarded.
3 Results and Discussion
We do not find any evidence for CO J=1-0 line emission in our K-band spectra. Figure 4(a) shows the final K-band spectra of HDF850.1 over the observed frequency range, = 18.0 to 26.5 GHz. Due to the presence of residual baseline features, 53 of the raw data are not included in the final, co-added spectra shown here. The most noticeable contaminant of our spectra are the receiver resonance features, appearing at various frequencies along the K-band receiver temperature spectra (top curve, Figure 4(a)). These resonances originate within the feed horns and their amplitudes depend strongly on the weather conditions. Although these features prevent us from placing any constraints on the presence of CO J=1-0 line emission over certain redshift intervals, we are still able to obtain CO J=1-0 line luminosity limits over much of the K-band window.
3.1 CO line luminosity limits
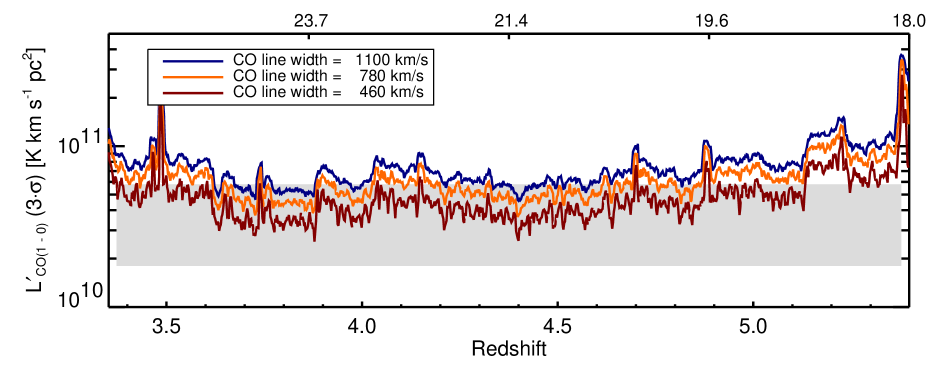
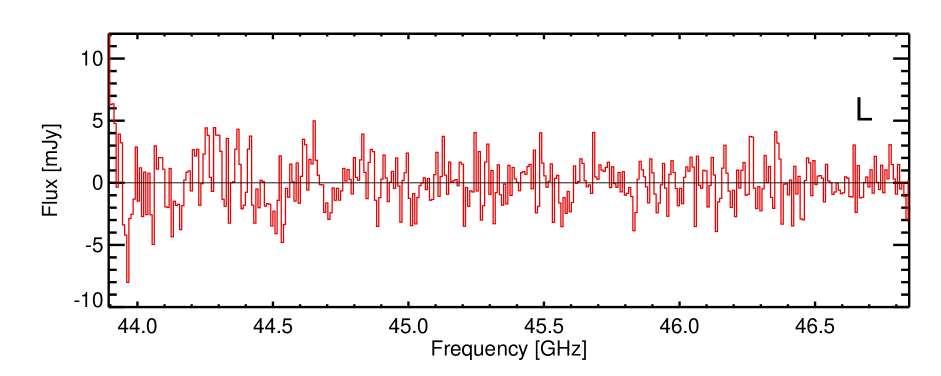
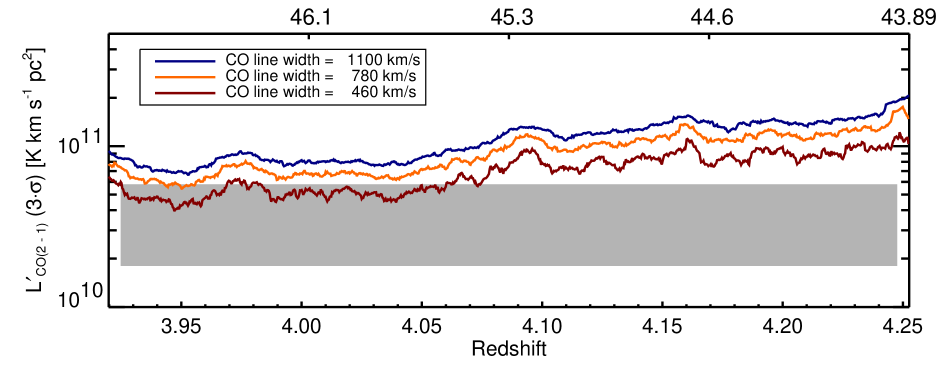
We calculate 3- upper limits to the CO J=1-0 and CO J=2-1 line luminosities across the available K-band and Q-band spectra, respectively. We assume a range of CO line widths, = 460, 780 and 1100 km s-1, which represent the first, median and third quartiles of the linewidths in the first 12 SMGs detected in high-J CO line emission (see Greve et al. 2005). The 3- upper limit to the CO line integrated intensity is given by (e.g. Isaak, Chandler & Carilli 2004), (in units of Jy km s-1), where the velocity width of a channel, , and the r.m.s. per channel, , both vary across the combined spectra. The limits to the integrated line intensity are converted to 3- upper limits to the CO line luminosity, , following the expression given by Solomon, Downes & Radford (1992). These limits are shown in Figure 4(b) for the CO J=1-0 line in the K-band spectra, and in Figure 5(b) for the CO J=2-1 line in the Q-band spectrum. For comparison, we also plot the median CO line luminosity measured in the first 12 SMGs detected in high-J (Jupper 2) CO line emission (see Greve et al. 2005).
The fact that neither CO J=1-0 , or CO J=2-1 line emission is detected in HDF850.1, can be explained by three possible scenarios; i) the total molecular gas mass in this object is low, resulting in CO line emission that is weaker than our line luminosity limits, ii) the frequency of the emission line coincides with that of a receiver resonance feature, or iii) the redshift of this object is such that the emission frequency of the CO J=1-0 line is outside the range accessible to the K-band receiver, a possibility which has a 10-14 probability according to the photometric redshift estimate of Aretxaga et al. (2003).
Under the assumption that i) is the correct scenario, the limits to the CO J=1-0 line luminosity can be used to estimate the limits on the total molecular gas mass, , in HDF850.1. Adopting the relationship: ( M⊙(K km s-1 pc), appropriate for nearby ultraluminous infrared galaxies (Downes & Solomon 1998), we can estimate an upper limit to the molecular gas mass contained within HDF850.1, under the assumption that its redshift is in the range, 3.3 5.4. The 3- limit to the CO J=1-0 line luminosity is in the range, K km s-1 pc2, depending on the assumed line width and redshift. By first accounting for a lensing amplification factor of 3 (Dunlop et al. 2004), these limits on the CO line luminosity translate directly to a molecular gas mass, M⊙. The lensing amplification factor has been calculated for the FIR/submm emission region, which we are assuming is co-spatial with the low-J CO line emission region, resulting in an equal lensing factor. This assumption may not be valid, but without high angular resolution observations of both the FIR/submm and the low-J CO emission line regions, it remains uncertain.
3.2 CO and Far-Infrared luminosities
We can assess whether the CO line luminosity limits achieved here, are sufficient to have detected CO line emission over the observed redshift interval, by considering the CO line luminosity () predicted by the estimated far-infrared luminosity () of HDF850.1 within the context of the locally observed relation. In nearby galaxies there exists a well-established correlation between far-infrared luminosity and CO line luminosity (e.g. Young & Scoville 1991), though it is unclear whether this relation truly arises from a direct dependance of star-formation rate (as traced by ) on the total molecular gas mass (as traced by ). Furthermore, this relationship appears to deviate from a power-law at high far-infrared luminosities ( L⊙), which are characteristic of the SMG population. Despite the uncertainties in this relation, we converted the estimated far-infrared luminosity in HDF850.1 to an expected CO J=1-0 line luminosity, in order to determine if our limits on the CO J=1-0 and CO J=2-1 line luminosities are sufficiently sensitive for us to have confidently expected a CO detection.
Following Neri et al. (2003) and Greve et al. (2005), we calculate the far-infrared luminosity for HDF850.1 according to, L⊙ (Blain et al. 2002), under the assumption of a modified greybody with dust temperature K, and emissivity index , where is the observed 850 m flux density. Although various measurements of the 850 m flux density in HDF850.1 exist in the literature, the differences are not significant and we adopt the original value presented by Hughes et al. (1998), mJy. This leads to an estimated far-infrared luminosity, L⊙ (where is the magnification factor due to gravitational lensing, believed to be 3; Dunlop et al. 2004).
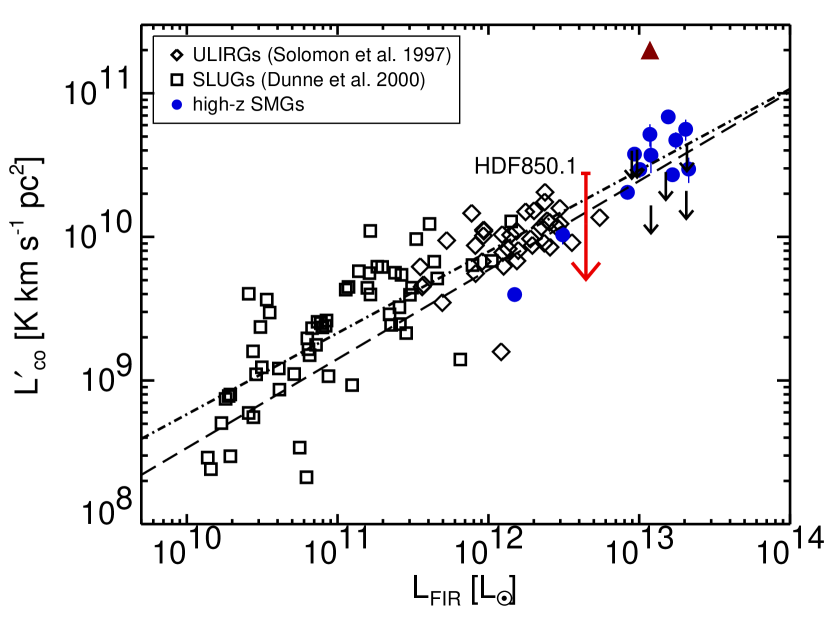
In Figure 6, we compare the estimated limits on the parameter space obtained here for HDF850.1, with the relation observed in other SMGs and various low-redshift galaxy samples. The ultraluminous infrared galaxy (ULIRG) sample observed in CO J=1-0 by Solomon et al. (1997) is also included, along with the SLUGS sample of Dunne et al. (2000b) with CO J=1-0 line luminosities taken from the literature (Sanders et al. 1985, 1986, 1991; Young et al. 1995; Casoli et al. 1996; Chini, Krügel & Lemke 1996; Maiolino et al. 1997; Solomon et al. 1997; Lavezzi & Dickey 1998). More recent measurements of the nuclear CO J=1-0 and CO J=3-2 line emission in a subset of the SLUGS are presented in Yao et al. (2003). The SMG sample consists of those objects in which searches have been conducted for high-J CO line emission (Frayer et al. 1998, 1999; Neri et al. 2003; Genzel et al. 2003; Sheth et al. 2004; Greve et al. 2005; Kneib et al. 2005; Tacconi et al. 2006), and the one object, SMM J13120+4242 at z=3.4, for which the CO J=1-0 line has been detected (Hainline et al. 2006). The far-infrared luminosities of these objects are calculated following the same prescription as that adopted for HDF850.1, with submm/mm flux densities taken from the literature (Smail et al. 1997, 1998; Ivison et al. 1998; Barger, Cowie, & Sanders 1999; Dey et al. 1999; Cowie, Barger, & Kneib 2002; Scott et al. 2002; Chapman et al. 2003b, 2005; Greve et al. 2004). For the purpose of comparison with the nearby galaxies detected in CO J=1-0 , we follow Greve et al. (2005) and assume that for the high-J CO lines observed in SMGs, , corresponding to optically-thick, thermalized CO emission. These data are plotted in Figure 6, with appropriate corrections applied to both and to account for magnification by gravitational lensing in the 6 SMGs believed to be lensed (assuming co-spatial far-infrared and CO emission line regions).
Also plotted in Figure 6 is a fit to the relation derived from a combined sample of ULIRGs and SMGs by Greve et al. (2005) where . We find a similar relation when we fit to the luminosities in the combined low-redshift LIRGs/ULIRGs and SMG sample plotted here, . These fits may be used to compare the estimated far-infrared luminosity in HDF850.1 to the measured CO line luminosity limits. After correcting for amplification by gravitational lensing, the estimated far-infrared luminosity in HDF850.1 makes it one of the least intrinsically luminous SMGs that has been searched for CO line emission, as most in the sample are believed to be unlensed (see Greve et al. 2005). Adopting the estimate for in HDF850.1, the fit to the relation by Greve et al. (2005) would predict, K km s-1 pc2, while the fit presented here would predict, K km s-1 pc2. These values are generally lower than the 3- CO line luminosity limits achieved in our K-band and Q-band spectra.
We are unable to draw any conclusions as to the validity of the photometric redshift technique applied to HDF850.1. Although we have removed 53% of the original K-band data due to various spectral baseline irregularities, a further decrease in the noise would still not be sufficient to obtain an limit that was significantly inconsistent with the expected CO content, given the uncertainties and the dispersion in the estimated gas masses of SMGs with CO detections. The CO J=1-0 and CO J=2-1 line luminosity limits presented here are not of sufficient depth to exclude the presence of CO line emission within the redshift interval, 3.3 5.4.
4 Conclusions
We present a broadband, GBT spectroscopic search for CO J=1-0 and CO J=2-1 line emission in the high-redshift SMG, HDF850.1 using the K-band (18.0 to 26.5 GHz) and Q-band (40.0 to 48.0 GHz) receivers. Although we do not detect any CO line emission in this object, our constraints on the CO line luminosity are approaching that predicted by the far-infrared luminosity within the context of the local relation. These GBT results are still consistent with HDF850.1 lying in the redshift interval, 3.3 5.4, based on our previous rest-frame far-infrared-to-radio photometric redshift estimate.
The GBT has recently been successful in detecting the CO J=1-0 line in 3 quasar host galaxies; APM 08279+5255 at z=3.9, PSS J2322+1944 at z=4.1 and BR 1202-0725 at z=4.7 (Riechers et al. 2006), while Hainline et al. (2006) present a detection of CO J=1-0 line emission in the SMG SMM J13120+4242 at z=3.4. These 4 objects detected in CO J=1-0 line emission with the GBT, were previously known to exhibit strong high-J CO line-emission, and therefore to contain large masses of warm molecular gas. With these prior high-J CO detections, the redshifts for the molecular emission-line regions were constrained to 100 km s-1 enabling a more efficient use (i.e. a narrower frequency search) of their available GBT observing time. Given the prior uncertainty in both the redshift and CO line intensity of HDF850.1, our experiment is quite distinct from the ‘tuned’ GBT observations described above. This is the first broad-bandwidth cm-wavelength search for CO-line emission in a high-redshift object (guided by a radio-to-FIR photometric redshift), with no previous detections of molecular line emission or an optical redshift.
Considering future possibilities, the gaseous medium within SMGs is expected and perhaps already shown to be warm and dense, and hence the high-J CO line transitions should be more intense than the J=1-0 transition (Weiss et al. 2005). At z (typical of the SMG population) the high-J (J 2) CO transitions are redshifted into the GHz atmospheric windows. Thus we are optimistic that CO line searches, using broadband mm-wavelength receivers on sensitive facilities such as the LMT, PdBI or CARMA, will be more successful in obtaining unambiguous spectroscopic redshifts for the optically obscured SMG population of starburst galaxies.
Acknowledgments
We are very grateful to the entire Green Bank staff for their help and patience throughout the course of these observations. In particular, we would like to thank Carl Bignell, Ron Maddalena, Dana Balser, Karen O’Neil, Tony Minter, Frank Ghigo, Glen Langston, Brian Mason, Jay Lockman, Phil Jewell and Richard Prestage. J.W. would like to thank Paul Kondratko for informative discussions on GBT data reduction. J.W. thanks the Department of Astrophysics at INAOE for a graduate student scholarship and the SAO for the funding provided by a predoctoral student fellowship. D.H.H., J.W. and I.A. are supported by CONACYT grant 39953-F. This work is partially funded by CONACYT grant 39548-F. We thank the anonymous referee for helpful suggestions.
References
- Aretxaga et al. (2003) Aretxaga, I., Hughes, D. H., Chapin, E. L., Gaztañaga, E., Dunlop, J. S., & Ivison, R. J. 2003, MNRAS, 342, 759
- Aretxaga et al. (2005) Aretxaga, I., Hughes, D. H., & Dunlop, J. S. 2005, MNRAS, 358, 1240
- Barger et al. (1998) Barger A.J., Cowie L.L., Sanders D.B., Fulton E., Tanigushi Y., Sato Y., Kawara K., Okuda H., 1998, Nat, 394, 248
- (4) Barger, A.J., Cowie, L.L., & Sanders, D.B. 1999, ApJ, 518, L5
- Bertoldi (2000) Bertoldi F., Menten K. M., Kreysa E., Carilli C. L., Owen F., 2000, 24th meeting of the IAU, Joint Discussion 9, Manchester, England.
- Blain et al. (2002) Blain, A. W., Smail, I., Ivison, R. J., Kneib, J.-P., & Frayer, D.T. 2002, Phys. Rep., 369, 111
- Borys et al. (2003) Borys C., Chapman S.C., Halpern M., Scott D., 2003, MNRAS, 344, 385
- Carilli & Yun (1999) Carilli C.L. & Yun M.S., 1999, ApJ, 513, L13
- Carilli & Yun (2000) Carilli C.L. & Yun M.S., 2000, ApJ, 530, 618
- (10) Casoli F., Dickey J., Kazës I., Boselli A., Gavazzi G., Jore K., 1996, A&AS, 116, 193
- Chapman et al. (2003a) Chapman S.C., et al. , 2003a, Nature, 422, 695
- Chapman et al. (2003b) Chapman, S.C. et al. 2003b, ApJ, 585, 57
- Chapman et al. (2005) Chapman S.C., et al. , 2005, ApJ, 622, 772
- (14) Chini R., Krügel E., Lemke R., 1996, A&AS, 118, 47
- (15) Cowie, L.L., Barger, A.J., & Kneib, J.-P. 2002, AJ, 123, 2197
- (16) Dey, A., et al. 1999, ApJ, 519, 610
- Downes & Solomon (1998) Downes, D. & Solomon P.M. 1998, ApJ, 507, 615
- Downes et al. (1999) Downes D., et al., 1999, A&A, 347, 809
- Dunlop et al. (2004) Dunlop J., et al. , 2004, MNRAS, 350, 769
- Dunne et al. (2000a) Dunne L., Clements D.L., Eales S.A., 2000a, MNRAS, 319, 813
- Dunne et al. (2000b) Dunne L., Eales S.A., Edmunds M., Ivison R.J., Alexander P., Clements D.L., 2000b, MNRAS, 315, 115
- Frayer et al. (1998) Frayer, D.T. et al. 1998, ApJ, 506, L7
- Frayer et al. (1999) Frayer, D.T. et al. 1999, ApJ, 514, L13
- Genzel et al. (2003) Genzel, R. et al. 2003, ApJ, 584, 633
- Greve et al. (2004) Greve T.R., Ivison R.J., Bertoldi F., Stevens J.A., Dunlop J.S., Lutz D., Carilli C.L., 2004, MNRAS, 354, 779
- Greve et al. (2005) Greve T.R. et al. 2005, MNRAS, 359, 1165
- Hainline (2006) Hainline, L.J., Blain, A.W., Greve, T.R., Chapman, S.C., Smail, I., & Ivison, R.J., 2006, ApJ, 650, 614
- Helou et al. (1985) Helou, G., et al., 1985, ApJ, 298, L7
- Hughes et al. (1998) Hughes D.H., et al., 1998, Nat, 394, 241
- Hughes etal. (2002) Hughes D.H., et al., 2002, MNRAS. 335, 871
- (31) Hunt, L.K. & Maiolino, R., 2005, ApJ, 626, L15
- Isaak, Chandler & Carilli (2004) Isaak, K., Chandler, C., & Carilli, C. 2004, MNRAS, 348, 1035
- (33) Ivison, R.J. et al. 1998, MNRAS, 298, 583
- (34) Jewell, P.R., & Prestage, R.M. 2004, Proc. SPIE, 5489, 312
- (35) Kneib, J.-P. et al. 2005, A&A, 434, 819
- (36) Laurent, G.T. et al. 2005, ApJ, 623, 742
- (37) Lavezzi T. E., Dickey J. M., 1998, AJ, 115, 405
- (38) Maiolino R., Ruiz M., Rieke G. H., Papadopoulos P., 1997, ApJ, 485, 552
- Neri et al. (2003) Neri R. et al. 2003, ApJ, 597, L113
- (40) Rengarajan T.N. & Takeuchi T.T., 2001, PASJ, 53, 433
- (41) Riechers, D.A. et al. 2006, ApJ, 650, 604
- (42) Sanders D. B., Mirabel I. F., 1985, ApJ, 298, L31
- (43) Sanders D. B., Young J. S., Soifer B. T., Schloerb F. P., Rice W. L., 1986, ApJ, 305, L45
- (44) Sanders D. B., Scoville N. Z., Soifer B. T., 1991, ApJ, 370 158
- (45) Scott S. E. et al. 2002, MNRAS, 331, 817
- (46) Sheth, K., et al. 2004, ApJ, 614, L5
- Smail, Ivison & Blain (1997) Smail I., Ivison R.J., Blain A.W., 1997, ApJ, 490, L5
- (48) Smail I., Ivison R.J., Blain A.W. & Kneib, J.-P. 1998, ApJ, 507, L21
- Solomon, Downes & Radford (1992) Solomon P. M., Downes D., & Radford S. J. E., 1992, ApJ, 398, L29
- (50) Solomon P. M., Downes D., Radford S. J. E., Barrett J. W., 1997, ApJ, 478, 144
- Solomon & Vanden Bout (2005) Solomon P. M., & Vanden Bout P. A., 2005, ARA&A, 43, 677
- Spergel et al. (2003) Spergel D. N., et al., 2003, ApJS, 148, 175
- Spergel et al. (2006) Spergel D. N., et al., 2006, astroph/0603449
- Tacconi et al. (2005) Tacconi, L. et al. 2006, ApJ, 640, 228
- Vanden Bout et al. (2004) Vanden Bout P. A., Solomon P. M. & Maddalena R.J., 2004, ApJ, 614, L97
- Weiß et al. (2005) Weiss A., Downes D., Walter F., Henkel C., 2005, A&A, 440, L45
- (57) Wiklind T., 2003, ApJ, 588, 736
- (58) Yao, L., Seaquist, E.R., Kuno, N., & Dunne, L. 2003, ApJ, 588, 771
- Young & Scoville (1991) Young J. S., Scoville N. Z., 1991, ARA&A, 29, 581
- Young et al. (1995) Young J. S. et al., 1995, ApJS, 98, 219
- Yun & Carilli (2002) Yun M.S. & Carilli C.L., 2002, ApJ, 568, 88