SGRs in nearby galaxies: rate, luminosity function and fraction among short GRBs
Abstract
It was suggested that some of the short-duration Gamma-Ray Bursts (GRB) are giant flares of Soft Gamma-ray Repeaters (SGR) in nearby galaxies. To test this hypothesis, I have constructed a sample of short GRBs, detected by the Inter-Planetary Network (IPN), for which the position is constrained by at least one annulus on the celestial sphere. For each burst, I have checked whether its IPN - error region coincides with the apparent disk of one of bright, star-forming galaxies found within Mpc. I find a single match of GRB 000420B with M74, which could, however, be due to a chance coincidence. I estimate the IPN efficiency as a function of fluence and derive the galaxy sample completeness. I find that assuming there is a cut-off in the observed energy distribution of SGR flares at erg, the fraction of SGRs among short GRBs with fluence above erg cm-2 is () at the () confidence level. I estimate the number of active SGRs in each one of the galaxies in the sample, and combine it with the distances to these galaxies, the IPN efficiency, and the SGR flare energy distribution (Cheng et al.), to derive the rate of giant flares with energy above erg. I find that the rate of such giant flares is about yr-1 per SGR. This rate is marginally consistent with the observed Galactic rate, of a single giant flare with energy above erg in 30 years. Comparison of the Galactic rate with the inferred extragalactic rate implies a gradual cut-off (or steepening) of the flare energy distribution at erg ( confidence). Using the Galactic SGR flare rate, I set a lower limit of one percent on the fraction of SGR flares among short GRBs.
Subject headings:
gamma rays: bursts: individual: (GRB 000420B, GRB 000526B, GRB 051103) — stars: neutron — galaxies: individual (M74, NGC 7331)1. Introduction
The rate of Soft Gamma-ray Repeater (SGR) giant flares and their fraction among short-duration Gamma Ray Bursts (GRB; Kouveliotou et al. 1993) are important ingredients for the understanding of giant flares in the context of the magnetar model (Duncan & Thompson 1992; Paczynski 1992; for a recent review see Woods & Thompson 2006).
The large energy release from the 2004 December 27 giant flare, combined with some similarities between the temporal and spectral properties of giant flares and short GRBs, has re-ignited the idea that some or all of the short GRBs are in fact SGR giant flares in nearby galaxies (e.g., Dar 2005; Hurley et al. 2005; Palmer et al. 2005; Nakar et al. 2006). Additional support to this hypothesis came from the observed Galactic rate of giant flares with energy above erg, of one in 30 years among four active Galactic SGRs.
A limit on the fraction of SGRs among short GRBs was obtained by Nakar et al. (2006), who searched the error quadrilateral of six, well-localized, Inter-Planetary Network (IPN) GRBs for relatively nearby galaxies. They put a upper limit of ( confidence limit; CL) on the fraction of SGRs among bright short GRBs.
Lazzati, Ghirlanda, & Ghisellini (2005), inspected the spectra of 76 Burst And Transient Source Experiment (BATSE) short bursts. They found three GRBs whose spectra are well described by a black body model, and bursts for which a fit with a black body model is not excluded. Lazzati et al. (2005) then argued, based on the gamma-ray light curves of these short GRBs, that none of them were likely SGR bursts. They derived a limit on the fraction of SGR bursts among bright BATSE events of ( CL). I note that the Lazzati et al. (2005) results are based on the assumption that all the giant flares have similar light curves. However, this assumption is based on a small number of observed giant flares. If I relax the Lazzati et al. (2005) assumption about the temporal characteristics of giant flares, but keep their assumption regarding the spectral properties of SGRs (and there are up to 18 SGR flares in their sample), their result poses an upper limit on the fraction of SGRs among bright short GRBs of , at the CL.
Recently, two possible detections of extragalactic SGRs were claimed: Crider (2006) detected a s periodicity in the tail of the gamma-ray light curve of GRB 970110. He suggested that this burst may be an SGR flare in NGC 6946. Golenetskii et al. (2005) reported the detection of GRB 051103, which includes the nearby galaxy M81 in its error quadrilateral (see Ofek et al. 2006 and Frederiks et al. 2006 for follow-up observations and discussion).
Another quantity related to the fraction of SGRs among short GRBs is the rate of SGR giant flares. This rate is the consequence of the total energy available for SGRs, which in the context of the magnetar model is provided by the magnetic field of neutron star.
Recently, Stella et al. (2005) argued that the rate of SGR giant flares, with energy above erg, is about yr-1. They obtained this result by using a uniform prior (see however, Duncan 2001) on the observed rate. They further argued that about 70 giant flares, with energy above erg, are expected during the lifetime of an SGR, and concluded that magnetic fields of G are needed in order to explain the energy source of SGRs.
Popov & Stern (2005) attempted to find extragalactic SGRs by searching the BATSE catalog for short GRBs that spatially coincide with the Virgo cluster. They used this search to put an upper limit on the rate of giant flares with energy above erg, of yr-1. However, this limit was obtained by assuming that of all SGR giant flares is in the range of 0.05 to 0.7 s, and by ignoring the BATSE positional uncertainty. A similar limit was obtained by Palmer et al. (2005).
In this paper I match the IPN (§2) short GRBs with nearby galaxies (§3). Contrary to previous efforts, I do not introduce any assumptions about the temporal or spectral properties of SGR giant flares. I present, in §4, the search for IPN short-duration GRBs that spatially coincide with nearby galaxies. In §5, I use the results of this search to calculate the rate of SGR giant flares and confront it with the rate estimated based on the Galactic SGRs. I finally discuss the results in §6.
2. The IPN sensitivity
The Inter-Planetary Network (IPN; e.g., Laros et al. 1997; Hurley et al. 1999) is a set of gamma-ray detectors on board several spacecraft in the solar system. The IPN uses GRB photon arrival times to triangulate their celestial positions. Each pair of spacecraft constrain the GRB position to an annulus on the celestial sphere. The area of IPN - error regions is typically two orders of magnitude smaller than BATSE error circles. In fact, IPN positions were used to calibrate BATSE positional errors (Briggs et al. 1999).
Here I have use the IPN catalog111http://www.ssl.berkeley.edu/ipn3/interpla.html; version 2005 December 17 – For reference, this IPN catalog version is available from htpp://astro.caltech.edu/eran/GRB/IPN/NearbyGal/CatIPN.txt.ver17122005 containing all IPN-triangulated GRBs observed from 1990 November 12, to 2005 October 31222This catalog does not contain GRB 051103 which may have originated in the nearby galaxy M81 (Ofek et al. 2006; Frederiks et al. 2006).. Figure 1 shows a histogram of the integrated four-channel fluence for BATSE-triggered short-duration GRBs ( s; empty bars), as well as all short-duration GRBs triggered both by BATSE and an additional IPN detector (i.e., that have at least one annulus constraint; filled bars).
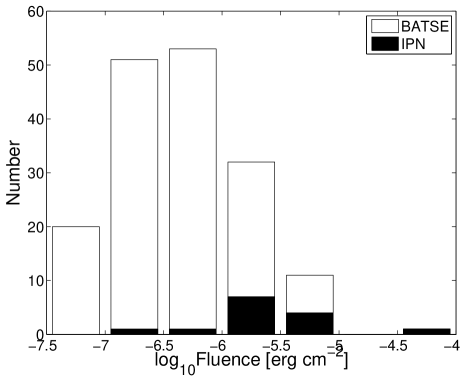
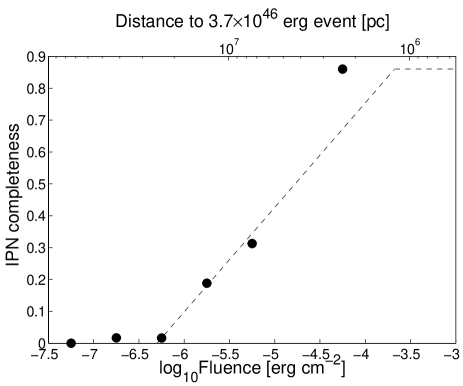
Figure 2 shows the approximate all-sky IPN completeness as a function of BATSE integrated four-channel fluence. Completeness here is calculated from the ratio of the two histograms in Fig. 1, multiplied by the exposure completeness of the Konus/Wind and BATSE short-duration GRB sample that is presented in the next section. I estimated the exposure completeness to be about (). This is based on the fact Konus/Wind started to work only in 1994 (11 yrs out of 15 yrs), and the exposure completeness of BATSE, which worked 4 yrs without Konus/Wind, is about 333Calculated from the BATSE all-sky exposure map http://cossc.gsfc.nasa.gov/docs/cgro/cossc/batse/4Bcatalog/4b_exposure.html. The dashed line shows an approximation to this completeness function given by:
| (1) |
where is the fluence. BATSE sensitivity is almost complete down to a fluence of about erg cm-2, in which the IPN efficiency drops to about ten percent. Therefore, the sensitivity function (Eq. 1) is an approximation to the IPN absolute mean efficiency. However, I will show in §3 that the results are not very sensitive to the exact shape of this completeness function.
3. Selection of the GRB and galaxy samples
I selected from the IPN catalog all GRBs with a - error region constrained by at least one annulus with semi-width smaller than one degree (1260). I further selected from this list all GRBs that were triggered by BATSE (752) and have s (29 events). The duration at which a GRB has an equal probability of being a short- or long-duration GRB is about s (Donaghy et al. 2006). As SGR giant flares have durations shorter than 2 s, the upper limit on the fraction of SGR giant flares among short-duration GRBs derived in this paper is conservative.
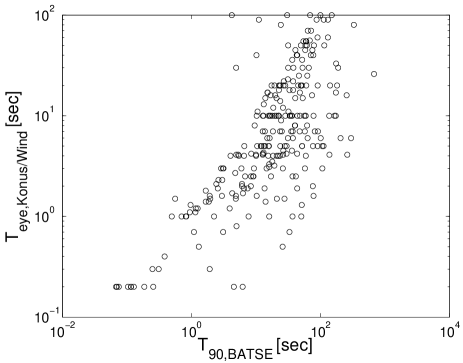
In addition, I searched for short-duration GRBs among the Konus/Wind satellite observations (Cline et al. 2003). A catalog of short GRBs detected by Konus/Wind was published by Mazets et al. (2004), however, some of the GRBs in this catalog were classified as long GRBs by BATSE. Therefore, instead of using this catalog I used the following statistical approach: I inspected by eye the Konus/Wind light curves for which an IPN annulus constraint is available, and selected all the bursts that have a total duration of less than two seconds. Due to the differences between the BATSE and Konus/Wind detectors, this sample is contaminated by long GRBs (which appear like short GRBs for the Konus/Wind detector). Figure 3 shows the BATSE vs. the duration estimated by eye () of GRBs that were triggered by both BATSE and Konus/Wind.
I found 83 Konus/Wind bursts with s and annulus semi-width of less than one deg. Of these 83 events, 37 were detected by BATSE, of which 23 were classified by BATSE as long-duration bursts (i.e., s). Therefore, the Konus/Wind sample has () contamination by long GRBs. Given this contamination factor, I estimate that the actual number of short bursts, among these 46 remaining events, is . Finally, I compiled a list of 75 events: 29 BATSE events with s and 46 Konus/Wind events with s. This list contains about () short bursts.
Next, I selected a sample of bright star-forming galaxies within Mpc from a modified version of the Tully (1988) nearby galaxies catalog. The selected galaxies have absolute magnitude , reside at distances less than 20 Mpc, and have morphological types other than E or S0. Introducing the last criterion, I assume that SGRs form predominantly in young stellar populations (see however, Levan et al. 2006). I excluded from this list the Large Magellanic Cloud (LMC). The nearby galaxy sample contains 316 galaxies, which are listed along with their basic properties in Table 1. Also listed in this table are the far Infra-Red (IR) fluxes and estimated supernova (SN) rates in these galaxies derived in §5.
| Name | R.A. J2000.0 Dec. | aaApparent blue magnitude, ,corrected for Galactic extinction, and for the external galaxy extinction (see Tully 1988). | bbAbsolute blue magnitude as calculated from the corrected distance and apparent extinction-corrected magnitude.,ddThe distances listed in the Tully (1988) catalog are based on galaxy recession velocities, assuming an Hubble constant km s-1 Mpc-1. I corrected all the distances in this catalog by a factor of (; i.e., to convert to km s-1 Mpc-1), and recalculated the absolute magnitude accordingly. | Ang. Diam. | DistanceccDistances are based on recession velocities, assuming km s-1 Mpc-1.,ddThe distances listed in the Tully (1988) catalog are based on galaxy recession velocities, assuming an Hubble constant km s-1 Mpc-1. I corrected all the distances in this catalog by a factor of (; i.e., to convert to km s-1 Mpc-1), and recalculated the absolute magnitude accordingly. | TypeeeGalaxy type, see Tully (1988) for details. | IR FluxffThe total observed far IR flux, , calculated by summing the fluxes of the IRAS sources found within the galaxy radius from the galaxy position. | SN rateggSN rate estimated by normalizing the absolute far IR flux to that of NGC 253, and assuming this galaxy has SN yr-1 (Pietsch et al. 2001). |
|---|---|---|---|---|---|---|---|---|
| [mag] | [mag] | [arcmin.] | [Mpc] | [Jy] | [yr-1] | |||
| N 7814 | ||||||||
| N 14 | ||||||||
| N 55 | ||||||||
| N 178 | ||||||||
| N 224 | ||||||||
| N 247 | ||||||||
| N 253 | ||||||||
| N 278 | ||||||||
| 0102-06 | ||||||||
| N 406 | ||||||||
| … | ||||||||
| N 628 | ||||||||
| N 7331 |
Note. — The first ten lines of Table 1. For convenience, I list also M74 (NGC 626) and NGC 7331 which are mentioned in this paper. The entire table is available via the electronic version.
3.1. The galaxy sample completeness
There are three factors which affect the completeness of this galaxy sample: (1) galaxies behind the Galactic plane; (2) star formation in galaxies not included in the sample; and (3) the fact that the sample is volume limited. I estimated these incompleteness factors below.
To estimate the completeness of the galaxy sample (Table 1) due to Galactic obscuration, I calculated the number of galaxies in this catalog as a function of Galactic latitude, . I then extrapolated the number of galaxies from the unobscured regions (i.e., deg) to the obscured regions. Based on this extrapolation, I estimated the completeness of the galaxy sample to be about .
Next, I estimated, , the fraction of star formation within galaxies with relative to the total star formation within 20 Mpc. I calculated the far Infra-Red (IR) flux444Based on Infra-Red Astronomical Satellite (IRAS) point source catalog, version 2.0, IPAC (1986) of the galaxies, defined by , where and are the m and m fluxes, respectively. This quantity is a good estimator of the star formation rate in galaxies (Helou et al. 1988). Given the galaxy distances, I summed the absolute far-IR flux of all the galaxies (excluding E0/S0) brighter than within ten Mpc and divided it by the absolute far-IR flux of all galaxies (excluding E0/S0) brighter than . Note that I use a distance cut of ten Mpc in order to avoid incompleteness due to missing faint galaxies. I found that .
The galaxy sample contains galaxies within Mpc. However, SGR giant flares can be observed to larger distances. To estimate the survey volume completeness, I divide the expected number of SGR flares (assuming constant number density of SGRs) that can be observed by the IPN up to a distance of , by the total observable number of IPN SGR flares:
| (2) |
where is the distance, is the completeness function (Eq. 1), and is the break in the flare energy distribution. I weighted the number of flares of energy , , by the empirical factor, with (Cheng et al. 1996).
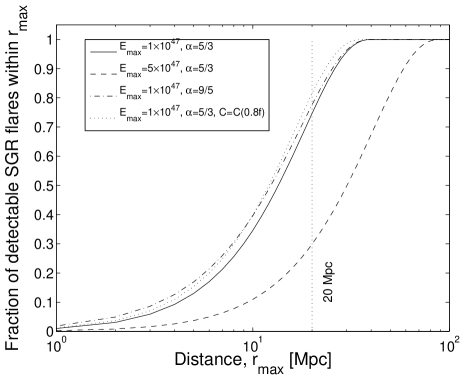
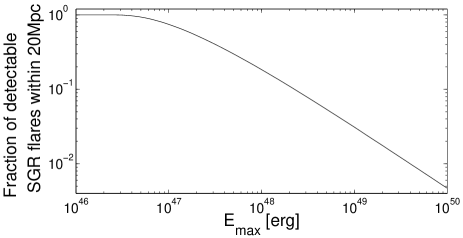
Figure 4 shows as a function of the distance , for four different combinations of , and (see legend). It is clear that the volume completeness is not sensitive to small changes in , nor to the exact shape of the completeness function. However, the completeness, Mpc is sensitive to the break energy, . Fig 5 shows the volume completeness, Mpc, as a function of . A reasonable value for is erg, which roughly corresponds to the total magnetic energy available for a G neutron star. Assuming erg, the volume-completeness of our survey is Mpc, while if erg, then the survey completeness drops to (see however §5).
4. The Search for SGR flares from Nearby Galaxies
For each burst in the short GRB sample, I searched for overlap between its IPN - error region and the apparent disk of one of the galaxies in Table 1. The IPN constraints include one or more annuli on the celestial sphere. In addition to the annuli, the IPN database occasionally contains constraints from individual instruments: ecliptic latitude constraints from Konus/Wind; error radii from various satellites; and/or planet blocking regions (i.e., in cases that Earth or Mars blocked part of the detector field of view). Some of these error regions (e.g., BATSE; WATCH Sazonov et al. 1998; COMPTEL Kippen et al. 1998; EGRET Gonzalez et al. 2004; PHEBUS Tkachenko et al. 2002; SIGMA Claret et al. 1994; BeppoSAX Guidorzi et al. 2004; HETE Vanderspek et al. 2003) are given at the - confidence. For these error radii I added known systematic errors (i.e., deg for BATSE; Briggs et al. 1999) and translated all the errors, which I assumed are circular555Note that error regions for GRB positions obtained by some of the spacecraft are not circular and normally distributed, to - errors.
To avoid incompleteness due to the positional inaccuracies of the Tully (1988) catalog, the galaxy diameter used in the search was increased by one arcminute.
I have found two matches between the short GRB candidates and the galaxies listed in Table 1. The first, GRB 000420B, coincides with the position of the nearby Sc-type galaxy M74. Fig 6 shows a Galaxy Evolution Explorer (GALEX) near UV-band image, emphasizing the star-forming regions in M74, with the IPN annulus overlayed (solid lines).
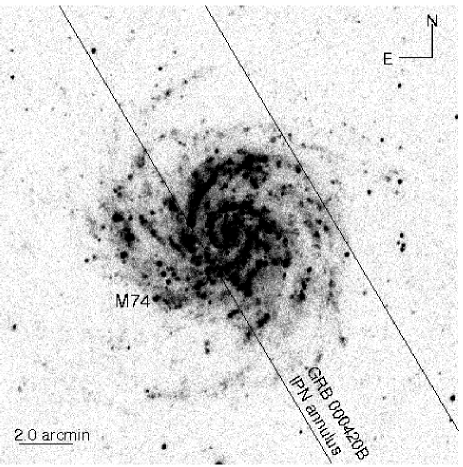
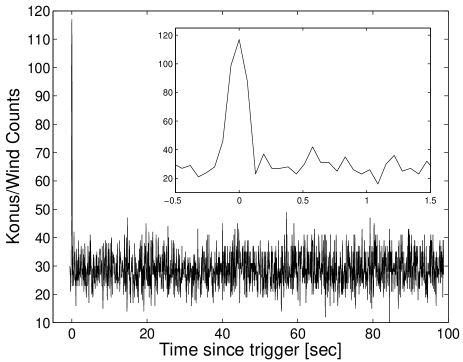
GRB 000420B was detected by Konus/Wind at UTC 2000 April 20 11:44:31666On April 20th, M74 is about six deg from the Sun, and its gamma-ray light curve is shown in Fig. 7.
Note that I did not detect, using a Scargle (1982) periodogram, any periodic signal in the light curve within s after the GRB spike.
The second match, GRB 000526B coincides with the position of the galaxy NGC 7331. However, as seen in Figure 8, this galaxy has an elongated shape (while in the search I assumed the galaxies are round) and the IPN annulus does not coincide with the galaxy apparent disk or any star forming regions within this galaxy.
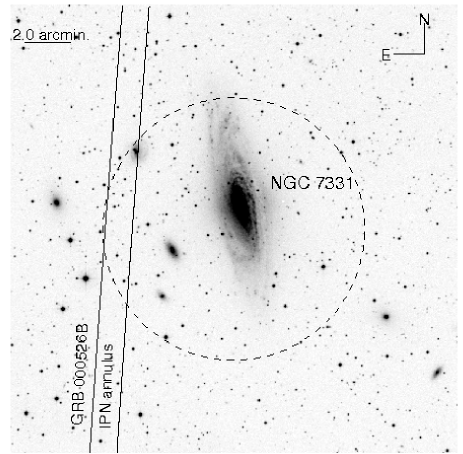
I note there is a smaller galaxy within the NGC 7331 group that does fall within the IPN annulus. However, this galaxy does not pass the absolute magnitude cut, and the a-priori probability to find an SGR flare from such a galaxy is small. Therefore, I conclude that GRB 000526B is unlikely to be associated with NGC 7331.
I have estimated the probability for a chance coincidence between the short-GRB IPN error regions and the galaxy sample. This was done by randomizing the positions of the 316 galaxies over the celestial sphere, and searching for a match with one of the IPN short-GRBs in the list. I repeated this simulation 1000 times and found that the expectancy number of matches is and the probability to find two matches is , and three or more matches is . Note that since the actual galaxy positions are correlated and the IPN constraints are coordinate dependent (e.g., Konus/Wind ecliptic latitude constraint) this simulation does not mimic the search process accurately. However, it indicates that such a chance coincidence is possible. Therefore, I cannot securely identify GRB 000420B with M74.
Given the product of the completeness factors, (see §3), and conservatively assuming that the search yielded a single SGR candidate among 47 short GRBs, I put an upper limit on the fraction of SGRs among short GRBs of (), at the one sided () CL (Gehrels 1986). Assuming that GRB 000420B is indeed an SGR flare in M74, the fraction of SGRs among short GRBs is about ().
5. The rate of giant flares
A closely related quantity to the fraction of SGR giant flares among short GRBs is the rate of SGR giant flares, which I estimate below.
Among the four active SGRs in the Galaxy (including the LMC), a single giant flare with energy above erg was observed in the last 30 years. Therefore, the derived rate of giant flares with energy above erg (Hurley et al. 2005) is yr-1 per SGR ( confidence interval; CI; Gehrels 1986), where is the distance to SGR 180620 in 15 kpc units (Corbel & Eikenberry 2004).
Next, using the results of §4, I estimate the rate of SGR giant flares, and compare it with the rate derived from the Galactic SGR giant flare. Assuming that all the SGRs have identical flare properties (i.e., the same cut-off energy and ), then the rate of giant flares, with energy above , per year per SGR, , is given by:
| (3) |
where is the time span of observations ( yrs), is the observed number of SGR flares in the -th galaxy (), (Cheng et al. 1996), is the number of active SGRs in the -th galaxy, and is the completeness function (Eq. 1). To estimate , I use the total far-IR flux (see §3) of the galaxies (Table 1) as an estimator for the star formation rate (Helou et al. 1988). I converted the far-IR flux to the SN rate, , by normalizing the far-IR flux of each galaxy to that of NGC 253, which I assumed has SN yr-1 (Pietsch et al. 2001). The far-IR flux along with the derived SN rate for each galaxy in this sample are listed in Table 1. Finally, the number of SGRs in the -th galaxy, , is:
| (4) |
where, is the number of active SGRs in the Milky-Way galaxy (four), and the SN rate in our Galaxy, , was set to yr-1.
Now I can compare the observed Galactic rate of giant flares with the rate implied by the extragalactic survey. Figure 9 shows contours of equal (i.e., the rate in Eq. 3 calculated assuming a single SGR flare was detected in the sample, ), as a function of the giant flare energy and the cut-off energy, . The labels on the contours denote the SGR giant flare rate in yr-1 per SGR. The confidence region on the rate of giant flares, with energy above erg, as implied by the Galactic SGR observation (i.e., yr-1 per SGR) is shown as the light-gray region on the left side of the Figure, and the - lower limit (i.e., approximately yr-1) is marked as a bold line. The estimated energy with its uncertainty, of the 2004 December 27 giant flare, assuming a distance of kpc to SGR 180620, is marked as dark-gray region on the right side of the figure. For convenience, I plot on the upper axis of Figure 9 the distance to SGR 180620 which corresponds to the energy of the 2004 December 27 giant flare. Plotted on the right-axis is the approximate magnetic field, , corresponding to (, where I set the neutron star radius, , to ten km).
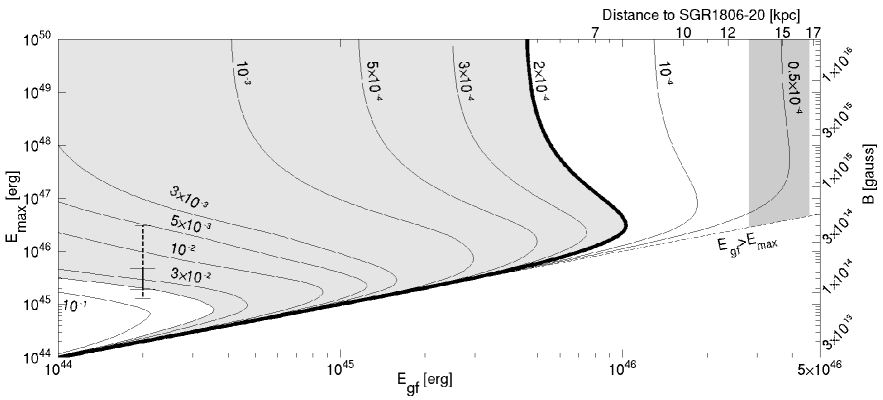
Apparently, there is a conflict between the Galactic rate of SGR giant flares and the rate implied by the extragalactic survey which predicts a giant flare rate of yr-1 (assuming erg). There are several ways to explain this contradiction: The observed number of SGR flares in the search, , is subject to Poisson error ( CL); The estimate of (Eq. 4) is subject to errors through the SN rate estimate, and to Poisson error in the number of active SGRs in the Galaxy (; CL); The distance to SGR 180620 may be smaller than kpc (e.g., 12kpc, Figer et al. 2004; 6–10 kpc, Cameron et al. 2005), and therefore shifting the dark-gray zone (i.e., energy of the 2004 December 27 giant flare) in Fig. 9 to the left; Moreover, the value of the power-law index may be different from (e.g., Götz et al. 2006; ), and the luminosity function model is an approximation. In reality the energy distribution (i.e., ) is probably not terminated abruptly at , as different SGRs may be born with different magnetic fields. I note that although the tentative detection of a single extragalactic SGR has a large Poisson uncertainty (, at the CL), the actual rate cannot be much smaller than one, or it will not be consistent with the observed Galactic rate of giant flares with energy above erg.
Interestingly, the Galactic rate of giant flares with energy above erg is yr-1 per SGR (The errors are the 1 and 2- CL, respectively; assuming three777These are: 1979 March 5 (SGR 052666); 1998 August 27 (SGR 190014); and 2004 December 27 (SGR 180620). Note that, SGR flares are correlated (see also §6) and therefore Poisson statistics can be used only if the flares were originated from different objects – as in this case. giant flares were observed in 30 yrs). This rate is indicated by the error-bar in the left-hand side of Fig. 9. The solid line is the - CI, and the dashed line is the - CI implied by the Galactic rate. In order to reconcile the Galactic rate with the extragalactic rate, a gradual break (or steepening) in the flare energy distribution is required at erg (at the CL).
I note that if I adopt the value of found by Götz et al. (2006), then the inferred rate of giant flares with energy above erg will be even lower (by about ) than the rate based on . Moreover, for I find that , at the CL.
To conclude, this analysis shows that: erg at the CL; the rate of SGR giant flares is yr-1 per SGR; and the fraction of SGR flares among short-duration GRBs cannot be much smaller than one percent, otherwise it will be inconsistent with the Galactic rate.
6. Discussion
The fraction of SGR flares among short GRBs and the rate of SGR giant flares are closely related issues. Measurements of these quantities are important for the understanding of the SGR flare mechanism and magnetic field strength. Below I discuss the possibility of observing additional extragalactic flares and the implications of the measured SGR giant flare rate for the magnetic field strength in the context of the magnetar model.
The derived fraction of SGRs among short GRBs implies that about five to extragalactic SGR flares were observed by BATSE. Moreover, I estimate that the Swift satellite may find an extragalactic SGR every several years, and that the Gamma-Ray Large Area Space Telescope will localize about – extragalactic SGRs per year. Based on the analysis presented in this paper, it would be surprising if both GRB 000420B and the recently discovered GRB 051103 (Golenetskii et al. 2005; Ofek et al. 2006; Frederiks et al. 2006) were not associated with M74 and M81, respectively.
Verifying that a GRB is indeed an extragalactic SGR flare requires either the detection of persistent X-ray emission, which is beyond our current observational capabilities, or the detection of additional flare activity. The fact that SGR flares are correlated may increase the probability of observing additional flare activity from extragalactic SGRs. The observed time between low-energy SGR flares follows a log-normal distribution (Laros et al. 1987; Hurley et al. 1994; Cheng et al. 1996). Therefore, it is more appropriate to express the typical time between bursts using the log-normal-mean, , and -standard deviation, . Assuming a flare rate of yr-1, then , the expectation value of the time between giant flares, with energy above erg, is yr. Since the expectancy value of log-normal distribution is given by , and assuming (Hurley et al. 1994) is independent of energy, the log mean for giant flares is . Interestingly, the cumulative log-normal distribution suggests that given these parameters (i.e., ; ), the probability to observe a second giant flare of an SGR within ten years from the first flare (given a sufficient energy source) is . Therefore, if GRB 000420B is associated with M74, and/or GRB 051103 is associated with M81, there is a fair chance to see another flare from these galaxies in the next decade. Furthermore, I note that if more than one burst per SGR will be observed, the use of Poisson statistics will considerably overestimate the flare rate.
As discussed in §1, Stella et al. (2005) argued that about 70 giant flares, with energy above erg, are expected from an SGR during its life-time, and claimed that SGR magnetic fields are in excess of G. My analysis, however, shows that the giant flare rate is two orders of magnitude smaller than that estimated by Stella et al. (2005), and therefore, magnetic fields of G can provide the required energy source. The giant flare rate I derive, yr-1 per SGR, suggests that within the lifetime of an SGR, - yrs, it would have of order unity giant flares with energy above erg.
To summarize, I searched for a spatial coincidence of IPN GRBs with galaxies within 20 Mpc. I have found a single SGR candidate, possibly located within M74. However, this match could be a chance coincidence. Currently, the best way to test the hypothesis that GRB 000420B arose in M74 is to detect additional SGR flares from this galaxy. As SGR activity is correlated, the expected waiting time to a second flare from the same SGR is not necessarily long. I use the results to place an upper limit on the fraction of SGRs among short GRBs with fluence above erg cm-2, of at the CL. This limit is consistent with the recent finding of Nakar et al. (2006) and Lazzati et al. (2005), but contrary to the latter paper it does not depend on the assumption that all SGR giant flares have the same light curve and spectrum. I note that this limit is based on the assumption that magnetars form predominantly in young stellar populations (see however Levan et al. 2006). I roughly estimate the efficiency of the IPN to detect giant flares in each of the galaxies in the sample, and find that the rate of giant flares, with energy above erg, is yr-1 per SGR. Finally, I show that the SGR flare luminosity function is consistent with a single power-law with a gradual cutoff or steepening below erg ( erg), at the CL, for ().
References
- Briggs et al. (1999) Briggs, M. S., Pendleton, G. N., Kippen, R. M., Brainerd, J. J., Hurley, K., Connaughton, V., & Meegan, C. A. 1999, ApJS, 122, 503
- Cameron et al. (2005) Cameron, P. B., et al. 2005, Nature, 434, 1112
- Cheng et al. (1996) Cheng, B., Epstein, R. I., Guyer, R. A., & Young, C. 1996, Nature, 382, 518
- Claret et al. (1994) Claret, A., et al. 1994, A&A, 287, 824
- Cline et al. (2003) Cline, T. L., et al. 2003, AIP Conf. Proc. 662: Gamma-Ray Burst and Afterglow Astronomy 2001: A Workshop Celebrating the First Year of the HETE Mission, 662, 143
- Corbel & Eikenberry (2004) Corbel, S., & Eikenberry, S. S. 2004, A&A, 419, 191
- Crider (2006) Crider, A. 2006, astro-ph/0601019
- Donaghy et al. (2006) Donaghy, T. Q., et al. 2006, astro-ph/0605570
- Duncan & Thompson (1992) Duncan, R. C., & Thompson, C. 1992, ApJL, 392, L9
- Duncan (2001) Duncan, R. C. 2001, AIP Conf. Proc. 586: 20th Texas Symposium on relativistic astrophysics, 586, 495
- Figer et al. (2004) Figer, D. F., Najarro, F., & Kudritzki, R. P. 2004, ApJL, 610, L109
- Frederiks et al. (2006) Frederiks, D. D., Pal’shin, V. D., Aptekar’, R. L., Golenetskii, S. V., Cline, T. L., & Mazets, E. P. 2006, astro-ph/0609544
- Gehrels (1986) Gehrels, N. 1986, ApJ, 303, 336
- Göğüş et al. (2000) Göğüş, E., Woods, P. M., Kouveliotou, C., van Paradijs, J., Briggs, M. S., Duncan, R. C., & Thompson, C. 2000, ApJL, 532, L121
- Golenetskii et al. (2005) Golenetskii, S., et al. 2005, GRB Coordinates Network, 4197, 1
- Gonzalez et al. (2004) Gonzalez, M. M., Dingus, B. L., Kaneko, Y., Preece, R. D., & Briggs, M. S. 2004, AIP Conf. Proc. 727: Gamma-Ray Bursts: 30 Years of Discovery, 727, 236
- Götz et al. (2006) Götz, D., et al. 2006, A&A, 445, 313
- Helou et al. (1988) Helou, G., Khan, I. R., Malek, L., & Boehmer, L. 1988, ApJS, 68, 151
- Hui et al. (1993) Hui, X., Ford, H. C., Ciardullo, R., & Jacoby, G. H. 1993, ApJ, 414, 463
- Hurley et al. (1994) Hurley, K. J., McBreen, B., Rabbette, M., & Steel, S. 1994, A&A, 288, L49
- Hurley et al. (1999) Hurley, K., Briggs, M. S., Kippen, R. M., Kouveliotou, C., Meegan, C., Fishman, G., Cline, T., & Boer, M. 1999, ApJS, 120, 399
- Hurley et al. (2005) Hurley, K., et al. 2005, ApJS, 156, 217
- Kippen et al. (1998) Kippen, R. M., et al. 1998, ApJ, 492, 246
- Laros et al. (1987) Laros, J. G., et al. 1987, ApJL, 320, L111
- Laros et al. (1997) Laros, J. G., et al. 1997, ApJS, 110, 157
- Lazzati et al. (2005) Lazzati, D., Ghirlanda, G., & Ghisellini, G. 2005, MNRAS, 362, L8
- Levan et al. (2006) Levan, A. J., Wynn, G. A., Chapman, R., Davies, M. B., King, A. R., Priddey, R. S., & Tanvir, N. R. 2006, MNRAS, 368, L1
- Mazets et al. (1979) Mazets, E. P., Golentskii, S. V., Ilinskii, V. N., Aptekar, R. L., & Guryan, I. A. 1979, Nature, 282, 587
- Mazets et al. (2004) Mazets, E. P., Aptekar, R. L., Frederiks, D. D., Golenetskii, S. V., Il’Inskii, V. N., Palshin, V. D., Cline, T. L., & Butterworth, P. S. 2004, Astronomical Society of the Pacific Conference Series, 312, 102
- Nakar et al. (2006) Nakar, E., Gal-Yam, A., Piran, T., & Fox, D. B. 2006, ApJ, 640, 849
- Ofek et al. (2006) Ofek, E. O., et al. 2006, ApJ, 652, 507
- Paczynski (1992) Paczynski, B. 1992, Acta Astronomica, 42, 145
- Palmer et al. (2005) Palmer, D. M., et al. 2005, Nature, 434, 1107
- Pietsch et al. (2001) Pietsch, W., et al. 2001, A&A, 365, L174
- Rekola et al. (2005) Rekola, R., Richer, M. G., McCall, M. L., Valtonen, M. J., Kotilainen, J. K., & Flynn, C. 2005, MNRAS, 361, 330
- Ribas et al. (2005) Ribas, I., Jordi, C., Vilardell, F., Fitzpatrick, E. L., Hilditch, R. W., & Guinan, E. F. 2005, ApJL, 635, L37
- Sazonov et al. (1998) Sazonov, S. Y., Sunyaev, R. A., Terekhov, O. V., Lund, N., Brandt, S., & Castro-Tirado, A. J. 1998, A&AS, 129, 1
- Scargle (1982) Scargle, J. D. 1982, ApJ, 263, 835
- Stella et al. (2005) Stella, L., Dall’Osso, S., Israel, G. L., & Vecchio, A. 2005, ApJL, 634, L165
- Tkachenko et al. (2002) Tkachenko, A. Y., Terekhov, O. V., Sunyaev, R. A., Kuznetsov, A. V., Barat, C., Dezalay, J.-P., & Vedrenne, G. 2002, Astronomy Letters, 28, 353
- Tully (1988) Tully, R. 1988, Nearby Galaxies Catalog (Cambrideg University Press)
- Vanderspek et al. (2003) Vanderspek, R., Dullighan, A., & HETE Science Team 2003, AAS/High Energy Astrophysics Division, 7,
- Woods & Thompson (2004) Woods, P. M., & Thompson, C. 2006, in Compact Stellar X-ray Sources, Eds. W.H.G. Lewin & M. van der Klis, Cambrideg University Press, astro-ph/0406133