Direct Measurement of the Ratio of Carbon Monoxide to Molecular Hydrogen in the Diffuse Interstellar Medium
Abstract
We have used archival far-ultraviolet spectra from observations made by the Space Telescope Imaging Spectrograph (STIS) of the Hubble Space Telescope and the Far Ultraviolet Spectroscopic Explorer (FUSE) to determine the column densities and rotational excitation temperatures for carbon monoxide and molecular hydrogen, respectively, along the lines of sight to 23 Galactic O and B stars. The sightlines have reddening values in the range = 0.07–0.62, thus sampling the diffuse to translucent interstellar medium. We find that the H2 column densities range from cm-2 and the CO from upper limits around cm-2 to detections as high as cm-2. CO increases with increasing H2, roughly following a power law of factor . The CO/H2 column density ratio is thus not constant, and ranges from , with a mean value of . The sample segregates into ”diffuse” and ”translucent” regimes, the former having a molecular fraction less than and mag kpc-1. The mean CO/H2 for these two regimes are and , respectively. These values are significantly lower than the canonical dark cloud value of . In six of the sightlines, the isotopic variant 13CO is observed, and the isotopic ratio we observe () is consistent with, if perhaps a little below, the average 12C/13C for the interstellar medium at large. The average H2 rotational excitation temperature is K, in good agreement with previous studies, and the average CO temperature is 4.1 K, with some sightlines showing temperatures as high as 6.4 K. The higher excitation CO is observed with higher column densities, consistent with the effects of photon trapping in clouds with densities in the 20-100 cm-3 range. We discuss the implications for the structure of the diffuse/translucent regimes of the interstellar medium and the estimation of molecular mass in galaxies.
Subject headings:
ISM: abundances, ISM: clouds, ISM: lines and bands, ISM: molecules, ISM: structureSubject headings:
ISM: abundances, ISM: clouds, ISM: lines and bands, ISM: molecules, ISM: structure1. Introduction
Molecular hydrogen (H2) is the most abundant molecule in the interstellar medium (ISM), residing primarily in the large complexes of the dense molecular clouds that account for 10-20% of the mass in the inner disk of the Galaxy (Shull & Beckwith, 1982). However, it is difficult to observe directly. H2 is a homonuclear molecule, with quadrupolar ground-state transitions that emit radiation only very weakly. Carbon monoxide (CO), in contrast, has strong ground-state transitions that produce readily observable emissions at radio wavelengths. In clouds with densities above the critical density for CO, H2 collisions dominate the ground-state excitation, and thus CO radio emission acts as a tracer of H2 in these regions.
This relationship is often characterized by the conversion factor , where is the integrated brightness temperature of the radio emission line at 2.6 mm. The value for the conversion factor is generally determined by one of the following techniques (cf. Young & Scoville, 1991): correlation of the CO emission with in clouds determined by star counts, which is then correlated with H2 by the extrapolation of the from the diffuse ISM (Savage et al., 1977); an excitation analysis of 13CO, assuming it is optically thin, 12CO is optically thick, and the 12CO/13CO is known; a virial analysis using the cloud sizes and linewidths; and comparison with -ray emission (e.g. Strong & Mattox, 1996). These techniques produce a value for of about cm-2 (K km s-1)-1, but examples of up to a factor of 10 higher can be found in the literature.
It is generally recognized that CO emission can qualitatively trace the distribution of H2 in the ISM, but because of difficulties in translating a measurement of into a column density of CO, is not a good quantitative measure of H2 (hereafter CO/H2). To relate to a relative column density ratio requires the assumption of LTE and is typically done with the unsaturated 13CO radio lines, so one must also assume excitation temperatures and abundance ratios for the two CO isotopes. This exercise gives a value of CO/H2 of about for the dense molecular clouds, but with a large uncertainty (e.g. Dickman, 1978).
The determination of CO/H2 is simplified by the direct observation of the two species in absorption. This has been done in the infrared, using vibrational transitions, and values of were found for the molecular clouds in NGC 2024 and NGC 2264 (Lacy et al., 1994). With ultraviolet observations, this direct method can be extended to the diffuse and translucent phases of the ISM, where the molecules are more susceptible to the effects of photodissociation, and thus CO/H2 is expected to vary relative to the dense clouds. Models suggest that the photodissociation of CO is sensitive, even more so than H2, to the strength of the interstellar ultraviolet radiation field, cloud geometry and the ultraviolet absorption and scattering properties of dust (van Dishoeck & Black, 1988; Kopp, Roueff, & Pineau des Forêts, 2000). Therefore the inter-relationship between CO and H2 may also be a good measure of the physical conditions and structure of the diffuse and translucent regimes of the ISM. Furthermore, there is evidence that a significant contribution to the large-scale Galactic CO emission is made by lower optical depth gas (Polk et al., 1988).
H2 is best observed in the far-ultraviolet where there are extensive dipole-allowed electronic absorption band systems. The Far Ultraviolet Spectroscopic Explorer (FUSE) has proven to be an excellent instrument for studying H2 in absorption (Rachford et al., 2002; Tumlinson et al., 2002; Gillmon et al., 2006, and others). CO also has an absorption band system throughout the ultraviolet, and a study of CO in the diffuse ISM using Copernicus was performed by Federman et al. (1980) and later reanalyzed by Crenny & Federman (2004). These observations were limited to the C-X (1088 Å) and E-X (1076 Å) absorption bands toward 48 nearby bright stars with only about one third having CO, some of those being saturated. Further, the spectral resolution () was not high enough to resolve the rotational substructure of the bands. Federman et al. (1980) concluded that measurements with a more sensitive, higher spectral-resolution instrument would allow for a better understanding of the relationship between H2 and CO across a wider range of environments.
This can be achieved using the Space Telescope Imaging Spectrograph (STIS) on board the Hubble Space Telescope, which has access to the Fourth Positive (A – X ) band system. More than a dozen absorption bands from the ground vibrational state of CO have been detected and, because of the large variance in oscillator strengths, they probe a variety of optical depths, allowing for an accurate determination of column density. Additionally, with the highest resolution grating modes (E140H) these bands can be resolved clearly into their constituent rotational structure. Because the rotational levels in the ground state of CO are closely spaced, the rotational excitation temperature of the molecule is easily determined.
Pan et al. (2005) used STIS Echelle and FUSE data to explore the CO and H2 absorptions in the Cepheus OB2 and OB3 clusters. They find evidence for systematic variations in CO/H2 in these two different star-forming regions, which they say may indicate differences in star-formation histories. In this paper, we broaden the study of CO/H2 to the diffuse molecular regime of the ISM, rather than study isolated regions. We present an analysis of 23 stars, which have been observed by both FUSE and the STIS E140H mode. The reddenings of these stars range from , complementing the Pan et al. study well, whose sightlines range from . The H2 and CO absorptions have been measured and column densities and rotational temperatures determined. These data provide a survey of the CO/H2 relationship in the diffuse to translucent molecular regime of the ISM.
2. Data and Analysis
The data presented here were retrieved from the Multimission Archive at STScI (MAST). The STIS observations employed the E140H grating, providing the highest possible spectral resolution. The wavelength coverage of STIS allows for the observation of a number of absorption bands of the CO A-X () band system. For some of the stars, though, the specific tilt of the Echelle grating allows for observation of only higher vibrational bands (), because of the more blueward wavelength coverage. The FUSE data were processed with the CalFUSE pipeline, version 2.2. The individual channels (e.g. LiF 1a, SiC 1a, etc.) were joined using an IDL shifting routine written to combine time-tagged or histogrammed FUSE data. Additionally, we obtained STIS data corresponding to five sightlines from a FUSE survey of translucent clouds (Rachford et al., 2002), from whom we obtained the H2 column densities.
2.1. Carbon Monoxide
CO has an extensive electronic absorption band system, the Fourth Positive () system, ranging from 1510 Å to shorter wavelengths. Because the energies of the rotational levels in the ground state of CO are closely spaced, the relative strengths of the individual ro-vibrational transitions are very sensitive to excitation temperature. Previous surveys, such as Federman et al. (1980) used Copernicus data, which were not able to resolve the rotational structure but the high spectral resolution of the STIS E140H grating () allows these transitions to be well-resolved from each other and provides for an accurate determination of the rotational temperature in addition to column density.
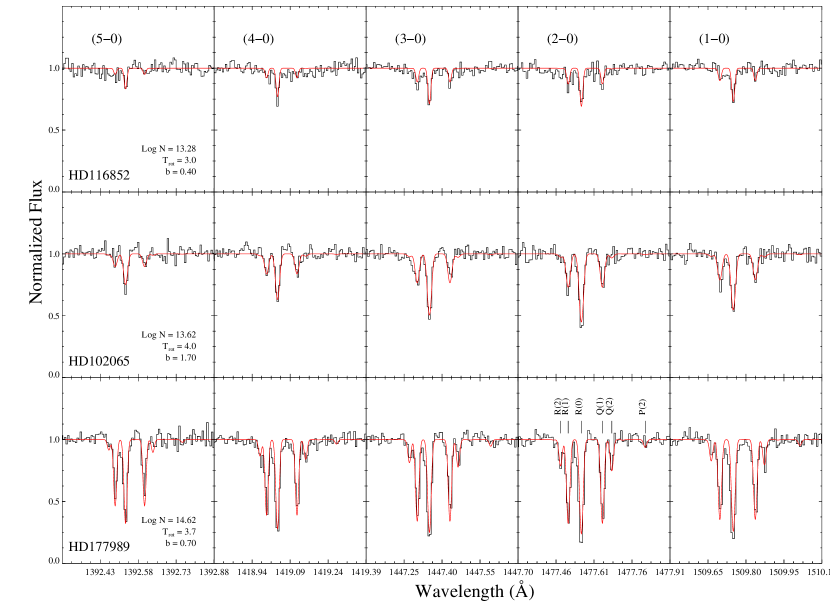
Model spectra of the ro-vibrational absorption were generated using the wavelengths and oscillator strengths of (Morton & Noreau, 1994). The best fit model was chosen using a statistic from a grid corresponding to varying column density (), rotational excitation temperature (), and Doppler line broadening parameter, . For most of the low-column sightlines, the bands (1-0) through (5-0) were fit simultaneously. For sightlines with only the shorter wavelength data, the bands starting with (7-0) and higher were fit. Figure 1 shows a sample of spectra with five bands of the A-X system range in column densities with corresponding best fit models overlaid. When the lower vibrational bands were available, the detection limit was typically cm-2. For the (7-0) band, it was cm-2. In all but four of the sightlines, CO absorption was detected, and in six of the higher column sightlines the isotopic variant 13CO was also observed.
In addition to the profile fitting, a curve-of-growth (COG) analysis was performed for each sightline. The individual ro-vibrational absorption profiles of each available band were fitted with Gaussians, their equivalent widths measured, and a COG constructed. A similar grid-search process as used in the profile fitting was employed and the , , and determined by comparison to the theoretical COG for a single velocity component. For sightlines with column densities below 1014 cm-2, the best fitted values agree with those determined from the profile fitting process within the error.

For the higher column sightlines, unresolved velocity components may influence the results. The equivalent width of an absorption line can be higher for a given total column density if the velocity structure contains unresolved non-overlapping absorption lines. This effect is more pronounced as the lines become saturated, and thus the equivalent widths of the higher oscillator strength bands are inflated, producing a COG that mimics that of a single component with higher . However, if enough unsaturated lines can be observed, then the column density determination is still robust. The combination of the STIS signal-to-noise ratio and high spectral resolution allow, in virtually all cases, for the observation of absorption lines that lie on the linear part of the COG. We noted that, for values of above km s-1, saturation effects are mild to negligible for absorption lines with an cm-2 Å.
Our initial fits of the higher column sightlines produced -values in the range . These are higher than expected for molecular material (Pan et al. (2004) find for CN, for example). We found that by limiting the fitting process to only the weaker absorptions, we were able to reproduce the lower values. In these cases, the fit was limited to those lines with , depending on the data quality, to avoid saturation effects. The application of the equivalent width cut lowered the determined value, and increased the determined by typically 0.2 dex. The need for this approach was demonstrated best by our attempts to fit the HD 24534 ( Per) sightline, the of which was increased by 0.5 dex after the application of the equivalent width cut. Twelve bands of the A-X system were clearly observed, but we could get no consistent fit from profile fitting. Also, the COG shows deviations from what would be expected for a single set of fit parameters. This is most likely because of the presence of unresolved velocity components.
The CO absorption profiles for Per have been fit before using GHRS data of the A-X system (Kaczmarczyk, 2000) as well as STIS data of the intersystem bands (Sheffer, Federman, & Lambert, 2002). Kaczmarczyk (2000) found that a two-component model, with one component having 85% of the column, was necessary to get a good profile fit of the data. He derives a column of cm-2, consistent with that found by Sheffer, Federman, & Lambert ( cm-2) as well as this study ( cm-2). In principle, the unsaturated intersystem bands, as Sheffer, Federman, & Lambert (2002) used, could also be used for the highest column density sightlines, but there were no STIS E140H data available in the archive with the appropriate wavelength coverage for any of the other stars.
2.2. Molecular Hydrogen
H2 has an extensive band system in the FUSE wavelength range (912 1110 Å at temperatures typical of the diffuse ISM) arising from electronic transitions out of the ground state () to the Lyman () and Werner () levels. These absorption lines were first used by Copernicus to characterize the average properties of the molecular phase of the ISM (Spitzer et al., 1974). More recently, FUSE has been used to compile large samples of H2 absorption data for galactic (Rachford et al., 2002; Gillmon et al., 2006) and extragalactic (Tumlinson et al., 2002) sightlines.
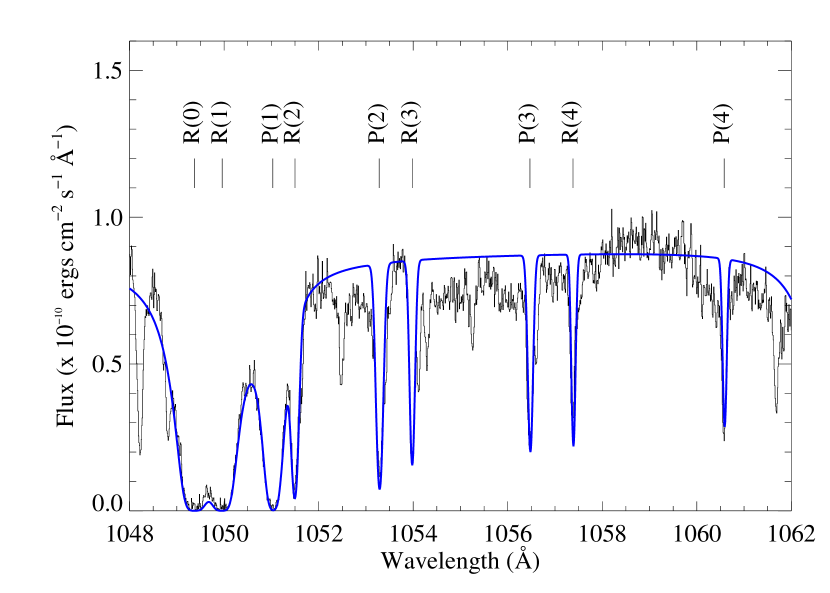
We have analyzed the H2 absorption lines in the sightlines presented here with a least-squares fitting routine that compares the data to a model spectrum. The model spectrum was constructed with a power-law fit to the stellar continuum over the wavelength region of interest ( 1035 – 1140 Å) with absorption components derived using the optical depth templates of McCandliss (2003). The continuum was placed interactively as individual adjustments were necessary in almost all cases. The optical depth templates are calculated for each line using a Voigt profile, ensuring the correct line shape for different column density regimes. Figure 2 shows a sample absorption spectrum of H2 and the best fitted model.
An iterative approach is used for absorption lines from rotational states from = 0 to = 4. A coarse grid of column densities (15.6 log (H2()) 23.0) is scanned for -values ranging from 2 to 11 km s-1. This process establishes the column to within 0.25 dex and -value to within 1 km s-1. A fine grid of column densities ( dex) is then scanned and the best fit is quoted to the nearest 0.05 dex. We feel that this is a conservative estimate of the accuracy of our H2 column density determination. As a consistency check, we compare our results for two sightlines also studied by Rachford et al. (2002). The column densities measured for HD 185418 are identical to theirs within the errors. On the other hand, HD 102065 is discrepant in log (0) by 0.2 dex.
This iterative approach proved repeatable for determining column densities for the = 0 and 1 lines. The higher-lying rotational states ( = 2 – 4) were fit with the same procedure, initially scanning a grid of column densities from cm-2. The quantitative results for these lines were less certain. Most of the lines arising from = 3 and 4 fell on the “flat” part of the curve of growth (as well as those from = 2 in a few cases), and were subject to the degeneracy between column density and -value. Additionally, some of the lines from = 2 and 3 were blended, and we found that continuum placement was even more significant when dealing with these lines. To avoid these complications, we only present the columns derived for the = 0 and 1 levels as these states contain the majority of the molecular mass at diffuse ISM temperatures.
3. Results
3.1. Column Densities and CO/H2
Table 1 summarizes the derived column densities and rotational excitation temperatures for the CO and H2 along the line of sight to each star, as well as the spectral type and reddening. For all but three of the sightlines in this study, we have obtained from the literature values for the neutral hydrogen column density; the H I column densities for HD 27778, HD 102065 and HD 203532 were determined from Ly fits to the STIS data. The spectral type for HD 102065 given in the literature of B9IV is inconsistent with the presence of weak but notable C IV 1548–1550 features typical of spectral types B1.5V or slightly later for high luminosity class (Walborn et al., 1995). Consequently, we adopt a B2V spectral type for this object (), yielding an = 0.31. Table 2 lists the column densities of the first two rotational states of H2, the column density of H I and the molecular fraction, H2H2H I)).
With both molecules there is a trend toward higher column with increased reddening (see Figure 3), though neither exhibits a tight correlation; for any given , the column density of both molecules can vary by at least an order of magnitude. The scatter is most likely a product of varying environments. The color excess is a measure of the total amount of dust along the line of sight, but may not necessarily reflect the geometrical distribution of the gas and dust; a single translucent cloud could produce the same reddening as a series of diffuse clouds – see, for example, the models of Kopp, Roueff, & Pineau des Forêts (2000).
Figure 4 shows the correlation of CO with H2. This is the tightest correlation seen in this study, roughly a power law relationship, i.e. , with . At lower H2 columns, the CO can be difficult to observe, whereas along the higher column sightlines, CO increases very quickly. This is most likely an indication of the onset of CO self-shielding, but may also be attributed to increased shielding of CO from photodissociation by either H2 or dust. Overplotted are the results from the survey by Crenny & Federman (2004), which used Copernicus data and the Cep OB data from Pan et al. (2005), who used STIS and FUSE data similarly to this work. Pan et al. note a systematic offset of the CO/H2 relationship between the Cep OB2 and OB3 clusters, further indicating that differences in the physical conditions of the clouds are playing a strong role in the scatter in this relationship.
Contours show lines of constant CO/H2. The slope of the correlation is steeper than 1 and thus there is an increasing trend of the CO/H2 with increasing column, with a steepening of the slope near a CO column of cm-2, where the self-shielding of CO becomes important. The value of CO/H2 reaches about for the highest column sightlines, and if the general trend is extrapolated to high H2 column agrees well with the value for dense clouds of about as determined by Lacy et al. (1994) for NGC 2024 and NGC 2264. This trend is well supported theoretically, such as by the models of van Dishoeck & Black (1988), which suggest that the column density ratio should increase from around in diffuse clouds to in dense clouds.
The left panel of Figure 5 shows CO/H2 as a function of reddening. Again the results of earlier studies are shown overplotted. There is a general trend toward higher ratio with increased reddening. An interesting standout from this trend are the Cep OB3 data, which appear to have far smaller CO/H2 for the than expected.

The middle panel of Figure 5 shows the ratio with respect to the molecular fraction. Below a molecular fraction of about 0.25 (the average value found in the Savage et al. 1977 study), the CO/H2 is about on average; we will consider this the “diffuse” regime. These lines of sight have a significant spread in reddening, covering , and are not well differentiated from the high CO/H2 sightlines in the plot versus reddening. The fact that they separate well from the high ratio sightlines in this plot suggests that the molecular fraction represents a better measure of a cloud’s physical condition than . This is most likely because the amount of dust tends to follow the total hydrogen along the line of sight rather than the molecular component and the destruction of these molecules is more sensitive to line-shielding than dust-shielding. Above a molecular fraction of 0.25 there is marked increase in the ratio with increasing molecular fraction, with an average value of about .

We see a similar behavior of the CO/H2 with the traditional density measure , where is the magnitudes of extinction in the band and is the distance to the star. Valencic et al. (2004) have compiled a large catalog of extinction properties to reddened Galactic O and B stars, and there is an overlap of 15 stars with this study. The right panel of Figure 5 shows CO/H2 versus this density measure. Jenniskens & Greenberg (1993) found that mag kpc-1 appears to separate the diffuse from the dense lines of sight, and our data show an increase in the CO/H2 above ; however, we would state that the division is between diffuse and translucent, as the sightlines in our study with mag kpc-1 still have CO/H2 about an order of magnitude less than that for dense clouds.
Further comparison to the Valencic et al. catalog produces no significant correlations of extinction curve parameters to the measured values of or for either CO or H2, or for CO/H2. The study of Burgh et al. (2000) indicated a correlation between the CO column density normalized by and the strength of the far-UV rise; however, that study, using data from the International Ultraviolet Explorer satellite, covered column densities ranging from (CO)= cm-2, the correlation only becoming apparent at the highest columns and steepest UV curves. It is likely that in the environments of the clouds probed in this study, shielding by H2 and self-shielding are more important in regulating the abundance of CO than dust-shielding, which may not play a significant role until (CO).
3.2. Isotopic Fractionation
For six of the sightlines, absorption lines from the isotopic variant 13CO are observed. Table 3 lists the 12CO and 13CO column densities and rotational temperatures for these sightlines. The first column of 13CO column densities are those determined if it is assumed that the two isotopes have the same rotational temperature. Also listed are the results if the temperature is allowed to be a free parameter. The results give column densities within 0.2 dex of each other. The next section will discuss the observed difference in rotational temperatures, when that parameter is left free to be fit.
The isotopic ratio 12CO/13CO ranges from about 50-70, with an average value of and we see no strong correlations with any other measurable quantity. The largest value is for Per (HD 24534), whose ratio was determined by Sheffer, Federman, & Lambert (2002) to be , in good agreement with the value found here; however, we do not see the enhanced fractionation measured along such lines of sight as those to Oph A, Oph (Federman et al., 2003), and Oph (Lambert et al., 1994), with values of , , and , respectively.
Wilson & Rood (1994) review the literature for determinations of the interstellar 12C/13C and adopt a value of ; however there is significant scatter amongst the values reported in the literature that seems to depend on the methods used, which can include from millimeter emissions of C18O (e.g. Langer & Penzias (1993) get 12C/13C) and near-infrared spectroscopy of CO vibrational bands (e.g. Goto et al. (2003) get 12C/13C). One method that is not sensitive to processes of selective fractionation (described below) is determining the 12CH+/13CH+ ratio and the recent measurements of Casassus et al. (2005) agree with a value of 78 but they interpret the scatter in their data () as a true measure of chemical heterogeneity in the local ISM.
There are two main processes that can cause 12CO/13CO to deviate from the average ISM value of the 12C/13C isotope ratio. The first is isotopic charge exchange (Watson et al., 1976), which occurs in gas where C+ is in abundance, as might be expected in translucent clouds, and enhances the 13CO because of its lower zero-point energy. The other process is selective isotopic photodissociation (Bally & Langer, 1982), which favors the more abundant, and thus more likely to self-shield, 12CO.
If isotopic exchange is more important than photodissociation we would expect 12CO/13CO = exp()(12C/13C), where is the zero point energy difference between the two isotopes ( K). The average kinetic temperature for these six sightlines is 58 K, and therefore we could expect to see as low as half the average ISM isotopic ratio. However, it is unlikely that photodissociation does not play a role, and the models of van Dishoeck & Black (1988) suggest at best only a mild relative increase in the 13CO abundance for temperatures in the range seen in this sample.
3.3. Rotational Excitation
Both the FUSE and the STIS data are of high enough resolution to resolve the individual rotational transitions of H2 and CO respectively. This allows for the determination of the rotational excitation temperature. For both molecules the relative column densities in the and states are representative of the rotational excitation temperature of the gas, , following:
where is the column density in the th rotational state, is the statistical weight, is the energy difference between the and states, and is Boltzmann’s constant.

Transitions between the ground-state rotational states of H2 are not dipole-allowed, and have lifetimes long enough that at the densities typical of diffuse and translucent clouds collisions dominate over other processes in determining the relative populations of the low-lying levels. Thus, for H2 traces the kinetic temperature of the gas. In CO, on the other hand, the rotational transitions are dipole-allowed and have short lifetimes such that the rotational excitation temperature will reflect mostly the density in the cloud, not the kinetic temperature.
The average H2 temperature in our sample is K. This agrees very well with the value derived from Copernicus observations of 61 stars with H2 columns greater than cm-2 of K (Savage et al., 1977) as well as the K of Rachford et al. (2002). The higher levels can be populated through collisions, UV- and formation-pumping, and radiative cascade and thus their relative populations may not reflect the kinetic temperature. The absorptions from these levels will not be considered in this study and should not greatly affect the column density determinations because the and 1 absorption accounts for the vast majority of the H2 column.
There is no correlation of the rotational temperatures of either H2 or CO with reddening along the line of sight, nor was any seen in either the Copernicus study or the FUSE study of Rachford et al. The rotational temperatures are also independent of total H2 column density. However, there are several interesting relationships with rotational temperature.
Rachford et al. (2002) point out that for lines of sight dominated by translucent clouds, the molecular fraction should be large while the kinetic temperature is small. Though we do not see a strong correlation (i.e. we see several sightlines with low temperature and molecular fraction) all of the sightlines with above average H2 temperature have a molecular fraction below 0.2, except for HD 185418, which has a molecular fraction of 0.49.
For CO column densities less than 1015 cm-2, the average rotational excitation temperature is K. For the higher column density sightlines, the average is K. Also, the average CO rotational temperature is K for sightlines with below average H2 temperature, and K for those above (see Figure 6). The increase of excitation with column density may be a result of “photon trapping” in clouds of higher optical depth. As the optical depth of the 2.6 mm radio line increases, it becomes more likely that the photon will be reabsorbed by another CO molecule. This hinders the radiative cooling and the collisional excitation/de-excitation process with the surrounding H2 molecules will equilibrate at a higher rotational temperature. The CO is thus sensitive to the H2 space density, the H2 kinetic temperature, and the line center optical depth, which itself depends on the column density and -value.
Using an on-line statistical equilibrium radiative transfer code,
available at
http://www.strw.leidenuniv.nl/$∼$moldata
(Schöier et al., 2005), we determined that the increase in temperature for
the higher column density sightlines is consistent with the “photon
trapping” effect in clouds with H2 space densities in the
20-100 cm-3 range, assuming our average H2 temperature as the
kinetic temperature and a -value of about 0.6 km s-1. This
code assumes a single, homogeneous cloud, which may not necessarily
represent a sightline with multiple velocity components.
Another method for increasing the rotational excitation of CO is that of radiative pumping from nearby dense clouds, as studied by Wannier, Penprase, & Andersson (1997). This effect will be proportional to the solid angle subtended by the nearby cloud as viewed from the CO along the line of sight, when the relative velocity between the absorbing and emitting clouds is zero. They point out that for sightlines with space densities in the few hundreds per cm3, and with kinetic temperatures in the range of the H2 temperatures we observe, fractions of 0.2 of 4 steradians is enough to account for the increased CO temperatures observed.
Wannier, Penprase, & Andersson (1997) point out that this effect may be differentiated from collisional excitation by observing other isotopes of CO, because the lower brightness temperature of the nearby clouds will reduce the rate of radiative pumping. Table 3 lists the 13CO temperatures derived in this study, with the isotopic temperature ratio listed in the final column. For two or possibly three of the sightlines, there is an increased relative temperature for the more abundant isotope. These are also the sightlines with the higher molecular fractions, and are perhaps sightlines that pass through the outer portions of a denser molecular cloud, where a larger fraction of its sky may be covered by optically thick, radiating gas. However, we note that the “photon trapping” could also explain the , because the less optically-thick 13CO would not have its rotational temperature enhanced by the effect.
4. Discussion
The traditional view of the ISM differentiates between diffuse and translucent clouds, where the transition occurs at about . However, recent studies (Rachford et al., 2002; Sonnentrucker et al., 2003) have suggested that there is not a clear distinction, and argue that perhaps none of the sightlines they see have truly “translucent” clouds, which models expect to show molecular fractions reaching very nearly 1. This situation could arise from having multiple “diffuse” clouds along the line of sight, adding up to a given . This would result in not necessarily being a good measure of the physical properties along a given line of sight, and our study confirms this.
It is thus more important to measure parameters that are better representative of the physical state of the clouds. The molecular fraction gives one such measure, but for reasons laid out in Rachford et al. (2002) may not allow for the unambiguous separation of diffuse and translucent sightlines. However, the CO molecule is more sensitive to photodissociative processes, and can be used to probe the transition region between diffuse and translucent clouds. Kopp, Roueff, & Pineau des Forêts (2000) model the sensitivity of the abundance of CO to the effects of geometry, dust shielding and fragmentation of the ISM. Their results suggest that if a sightline were simply a collection of small, diffuse clouds we would not expect to see an increased CO/H2 with total column density. The increase in CO/H2 that we observe with increased molecular fraction suggests that these sightlines do begin to sample the translucent regime.
We believe that the transition from low to high CO/H2 is similar to the one that hydrogen undergoes when the H2 column density gets high enough for self-shielding to take effect. The molecular fraction observed in a cloud will be dependent on the balance of the formation and the photodestruction. Savage et al. (1977) found that the molecular fraction transitions from “low” () to “high” () values at about cm-2, which corresponds to . This is also seen for high-latitude Galactic sightlines (Gillmon et al., 2006). The location of this transition is dependent on the physical conditions in the ISM, including the H2 formation rate on grains, the intensity of the interstellar radiation field, and the degree of fragmentation of molecular clouds along the line of sight. The behavior of the Galactic sightlines is in marked contrast to that of the Magellanic Clouds (Tumlinson et al., 2002), in which this transition occurs at much larger columns, perhaps because of the lower H2 formation rates and higher dissociating radiation fields. All of the sightlines in this study have total hydrogen columns above this transition value, and should be considered part of the “high” molecular fraction regime.
The values of CO/H2 that we measure for the diffuse and translucent regimes range from , in contrast with the canonical dense cloud value of . This discrepancy is consistent with the studies of de Vries et al. (1987) and Magnani et al. (1998), which find variations in the X-factor as determined from radio observations of high-latitude translucent clouds. Both studies interpret their results as variations of the CO abundance, which could have a deleterious effect on the process of determining the masses of individual clouds. It could also impact the ”weighing” of galaxies if the diffuse or translucent ISM contribute significantly to the CO radio emission. Polk et al. (1988) found, based on the ratios of integrated 12CO and 13CO emission, that a significant contribution to the total 12CO emission from a galaxy could be arising from material of moderate optical depth. In that case, applying a standard X-factor, derived from the dense clouds, would result in the underestimation of the total mass because of the lower CO/H2 in the more diffuse gas.
This difference could be particularly important for clouds subjected to intense UV radiation fields. Yao et al. (2003) found in their study of CO emission in starburst galaxies an X-factor significantly lower than the standard Galactic value. Further, they found, by virial analysis, that the clouds in these galaxies were not gravitationally bound unless the CO/H2 was 9-90 times lower than expected and suggest that the CO emission arises from nonvirialized warm and diffuse gas clouds. On the other hand, Rosolowsky et al. (2003) find no evidence in M33 for a diffuse molecular component traced by CO emission, concluding that most of the CO flux resides in the giant molecular clouds.
The direct comparison of the column densities determined from UV absorption line spectroscopy of CO and H2 provides a technique for probing the structure and chemical balance of the ISM free from many of the biases and assumptions inherent in the traditional X-factor method. If the CO J=1-0 radio emission along these lines of sight could be measured then the relationship between CO/H2 and X-factor could be checked directly. It would also be useful to use absorption spectroscopy to explore the sightlines with H2) cm-2, the regime in which we expect to see the transition from translucent to dense clouds. The power law increase in CO versus H2 seen in the diffuse/translucent regime should turn over as rises above and the CO/H2 “saturates” at the canonical dense cloud value of .
Furthermore, extragalactic environments could be explored, such as the Magellanic Clouds; however, we do expect that with the currently available archival data CO will be difficult to detect there. The study of Tumlinson et al. (2002) found that although H2 column densities as high as around cm-2 have been detected, the typical columns found in the Clouds lie in the cm-2 range. If the CO/H2 ratio were to follow the trend seen in the Galactic sample, the CO column densities would be below the STIS detection threshold. We would expect, though, that the CO/H2 would be even lower because of the lower metallicity and higher UV radiation fields seen in the Clouds. But, because models predict (Bell et al., 2006, e.g.) the CO/H2 to change with environment, if the appropriate data were taken, the technique could be used to explore the varying conditions in the diffuse/translucent ISM in other galaxies as well as our own.
References
- Bally & Langer (1982) Bally, J., & Langer, W. D. 1982, ApJ, 255, 143
- Bell et al. (2006) Bell, T. A., Roueff, E., Viti, S., & Williams, D. A. 2006, ArXiv Astrophysics e-prints, arXiv:astro-ph/0607428
- Bohlin, Savage & Drake (1978) Bohlin, R. C., Savage, B. D., & Drake, J. F. 1978, ApJ, 224, 132
- Burgh et al. (2000) Burgh, E. B., McCandliss, S. R., Andersson, B.-G., & Feldman, P. D. 2000, ApJ, 541, 250
- Casassus et al. (2005) Casassus, S., Stahl, O., & Wilson, T. L. 2005, A&A, 441, 181
- Crenny & Federman (2004) Crenny, T., & Federman, S. R. 2004, ApJ, 605, 278
- de Vries et al. (1987) de Vries, H. W., Thaddeus, P., & Heithausen, A. 1987, ApJ, 319, 723
- Dickman (1978) Dickman, R. L. 1978, ApJS, 37, 407
- Diplas & Savage (1994) Diplas, A., & Savage, B. D. 1994, ApJS, 93, 211
- Federman et al. (1980) Federman, S. R., Glassgold, A. E., Jenkins, E. B., & Shaya, E. J. 1980, ApJ, 242, 545
- Federman et al. (2003) Federman, S. R., Lambert, D. L., Sheffer, Y., Cardelli, J. A., Andersson, B.-G., van Dishoeck, E. F., & Zsargó, J. 2003, ApJ, 591, 986
- Fitzpatrick & Massa (1990) Fitzpatrick, E. L., & Massa, D. 1990, ApJS, 72, 163
- Gillmon et al. (2006) Gillmon, K., Shull, J. M., Tumlinson, J., & Danforth, C. 2006, ApJ, 636, 891
- Goto et al. (2003) Goto, M., et al. 2003, ApJ, 598, 1038
- Jenniskens & Greenberg (1993) Jenniskens, P., & Greenberg, J. M. 1993, A&A, 274, 439
- Kaczmarczyk (2000) Kaczmarczyk, G. 2000, MNRAS, 316, 875
- Kopp, Roueff, & Pineau des Forêts (2000) Kopp, M., Roueff, E., & Pineau des Forêts, G. 2000, MNRAS, 315, 37
- Lacy et al. (1994) Lacy, J. H., Knacke, R., Geballe T. R., & Tokunaga, A. T. 1994, ApJ, 428, L69
- Lambert et al. (1994) Lambert, D. L., Sheffer, Y., Gilliland, R. L., & Federman, S. R. 1994, ApJ, 420, 756
- Langer & Penzias (1993) Langer, W. D., & Penzias, A. A. 1993, ApJ, 408, 539
- Magnani et al. (1998) Magnani, L., Onello, J. S., Adams, N. G., Hartmann, D., & Thaddeus, P. 1998, ApJ, 504, 290
- McCandliss (2003) McCandliss, S. R. 2003, PASP, 115, 651
- Morton & Noreau (1994) Morton, D. C. & Noreau, L. 1994, ApJS, 95, 301
- Pan et al. (2004) Pan, K., Federman, S. R., Cunha, K., Smith, V. V., & Welty, D. E. 2004, ApJS, 151, 313
- Pan et al. (2005) Pan, K., Federman, S. R., Sheffer, Y., & Andersson, B.-G. 2005, ApJ, 633, 986
- Polk et al. (1988) Polk, K. S., Knapp, G. R., Stark, A. A., & Wilson, R. W. 1988, ApJ, 332, 432
- Rachford et al. (2002) Rachford, B. L. et al. 2002, ApJ, 577, 221
- Rosolowsky et al. (2003) Rosolowsky, E., Engargiola, G., Plambeck, R., & Blitz, L. 2003, ApJ, 599, 258
- Savage et al. (1977) Savage, B. D., Bohlin, R. C., Drake, J. F., & Budich, W. 1977, ApJ, 216, 291
- Schöier et al. (2005) Schöier, F. L., van der Tak, F. F. S., van Dishoeck, E. F., & Black, J. H. 2005, A&A, 432, 369
- Sheffer, Federman, & Lambert (2002) Sheffer, Y., Federman, S. R., & Lambert, D. L. 2002,ApJ, 572, L95
- Sonnentrucker et al. (2003) Sonnentrucker, P., Friedman, S. D., Welty, D. E., York, D. G., & Snow, T. P. 2003, ApJ, 596, 350
- Shull & Beckwith (1982) Shull, J. M. & Beckwith, S. 1982, ARA&A, 20, 163
- Spitzer et al. (1974) Spitzer, L., Cochran, W. D., & Hirshfeld, A. 1974, ApJS, 28, 373
- Strong & Mattox (1996) Strong, A. W., & Mattox, J. R. 1996, A&A, 308, L21
- Tumlinson et al. (2002) Tumlinson, J., et al. 2002, ApJ, 566, 857
- Valencic et al. (2004) Valencic, L. A., Clayton, G. C., & Gordon, K. D. 2004, ApJ, 616, 912
- van Dishoeck & Black (1988) van Dishoeck, E. F. & Black, J. H. 1988, ApJ, 334, 771
- Walborn et al. (1995) Walborn, N. R., Parker, J. W., & Nichols, J. S. 1995, Atlas of B-type Spectra from 1200 to 1900 Å (NASA RP-1363)
- Wannier, Penprase, & Andersson (1997) Wannier, P., Penprase, B. E., & Andersson, B.-G. 1997, ApJ, 487, L165
- Watson et al. (1976) Watson, W. D., Anicich, V. G., & Huntress, W. T. 1976, ApJ, 205, L165
- Wilson & Rood (1994) Wilson, T. L., & Rood, R. 1994, ARA&A, 32, 191
- Yao et al. (2003) Yao, L., Seaquist, E. R., Kuno, N., & Dunne, L. 2003, ApJ, 588, 771
- Young & Scoville (1991) Young, J. S., & Scoville, N. Z. 1991, ARA&A, 29, 581
| CO | H2 | ||||||||
|---|---|---|---|---|---|---|---|---|---|
| log | log | CO/H2 | |||||||
| Star | Sp. Type | (cm-2) | (K) | (km s-1) | (cm-2) | (K) | () | ||
| HD 24534b | B0Ve | 0.45 | 16.130.20 | 5.30.6 | 0.40.2 | 20.92 | 576 | 16. | 18.3 |
| HD 27778b | B3V | 0.38 | 16.050.14 | 6.10.5 | 0.7 | 20.79 | 566 | 18. | 07.1 |
| HD 91824 | O7V | 0.27 | 13.60 | - | - | 19.99 | 617 | . | 40 |
| HD 93205 | O3V | 0.37 | 13.230.06 | 3.40.6 | 4.31.0 | 19.84 | 10521 | 0. | 240.07 |
| HD 93222 | O7III | 0.40 | 13.360.20 | 2.81.0 | 0.70.6 | 19.80 | 7711 | 0. | 360.19 |
| HD 93840 | B1.0Ib | 0.14 | 13.380.08 | 3.60.6 | 1.1 | 19.55 | 474 | 0. | 680.21 |
| HD 102065c | B2V | 0.31 | 13.620.12 | 4.01.0 | 1.7 | 20.63 | 597 | 0. | 100.04 |
| HD 103779 | B0.5III | 0.21 | 12.35 | - | - | 19.90 | 8614 | . | 03 |
| HD 104705 | B0Ib | 0.26 | 12.980.16 | 3.40.8 | 1.0 | 19.98 | 9216 | 0. | 100.04 |
| HD 116852 | O9IV | 0.22 | 13.280.04 | 3.00.3 | 0.4 | 19.85 | 709 | 0. | 270.07 |
| HD 121968 | B1V | 0.07 | 12.30 | - | - | 18.70 | 383 | . | 40 |
| HD 152723 | O6.5III | 0.46 | 13.880.15 | 4.00.3 | 1.00.2 | 20.33 | 7310 | 0. | 360.15 |
| HD 163758 | O6.5Iaf | 0.35 | 13.420.05 | 4.50.5 | 1.30.5 | 19.85 | 8614 | 0. | 370.10 |
| HD 177989 | B0III | 0.25 | 14.620.17 | 3.70.4 | 0.70.1 | 20.23 | 525 | 2. | 41.1 |
| HD 185418 | B0.5V | 0.50 | 14.820.20 | 3.21.1 | 0.8 | 20.79 | 10521 | 1. | 10.6 |
| HD 201345 | O9p | 0.32 | 12.40 | - | - | 19.43 | 14741 | . | 09 |
| HD 203532 | B3IV | 0.32 | 15.700.17 | 5.50.3 | 0.70.1 | 20.71 | 495 | 9. | 84.5 |
| HD 206267b | O6.5V | 0.52 | 16.110.13 | 6.40.5 | 0.7 | 20.86 | 648 | 17. | 96.8 |
| HD 207198b | O9.5Ib | 0.62 | 15.530.20 | 3.71.2 | 1.00.5 | 20.83 | 668 | 5. | 02.6 |
| HD 210839b | O6Infp | 0.56 | 15.410.08 | 4.40.3 | 0.9 | 20.84 | 7210 | 3. | 71.1 |
| HD 218915 | O9.5Iab | 0.29 | 13.640.13 | 3.90.2 | 1.60.6 | 20.15 | 8614 | 0. | 310.12 |
| HD 303308 | B1.0III | 0.30 | 13.650.06 | 3.70.4 | 3.10.5 | 20.35 | 8614 | 0. | 200.05 |
| CPD -59 2603 | O7V | 0.46 | 14.150.10 | 3.20.5 | 0.6 | 20.15 | 7711 | 1. | 000.33 |
| H2 Column Densities (cm-2)a | H I | Molecular | |||
|---|---|---|---|---|---|
| Star | log (0) | log (1) | log (cm-2) | Ref. | Fraction |
| HD 24534b | 20.76 | 20.42 | 20.73 | 1 | 0.76 |
| HD 27778b | 20.64 | 20.27 | 21.20 | 4 | 0.44 |
| HD 91824 | 19.80 | 19.55 | 21.15 | 2 | 0.12 |
| HD 93205 | 19.40 | 19.65 | 21.33 | 1 | 0.06 |
| HD 93222 | 19.50 | 19.50 | 21.54 | 2 | 0.04 |
| HD 93840 | 19.45 | 18.85 | 21.04 | 1 | 0.06 |
| HD 102065 | 20.45 | 20.15 | 21.90 | 4 | 0.10 |
| HD 103779 | 19.55 | 19.65 | 21.16 | 1 | 0.10 |
| HD 104705 | 19.60 | 19.75 | 21.11 | 1 | 0.13 |
| HD 116852 | 19.60 | 19.50 | 20.96 | 1 | 0.14 |
| HD 121968 | 18.65 | 17.70 | 20.71 | 1 | 0.02 |
| HD 152723 | 20.05 | 20.00 | 21.43 | 1 | 0.14 |
| HD 163758 | 19.50 | 19.60 | 21.23 | 1 | 0.08 |
| HD 177989 | 20.10 | 19.65 | 20.95 | 1 | 0.28 |
| HD 185418 | 20.35 | 20.60 | 21.11 | 2 | 0.49 |
| HD 201345 | 18.85 | 19.30 | 20.88 | 1 | 0.07 |
| HD 203532 | 20.60 | 20.05 | 21.50 | 4 | 0.24 |
| HD 206267b | 20.64 | 20.45 | 21.30 | 3 | 0.42 |
| HD 207198b | 20.61 | 20.44 | 21.34 | 1 | 0.38 |
| HD 210839b | 20.57 | 20.50 | 21.15 | 1 | 0.53 |
| HD 218915 | 19.80 | 19.90 | 21.11 | 1 | 0.18 |
| HD 303308 | 20.00 | 20.10 | 21.45 | 1 | 0.14 |
| CPD -59 2603 | 19.85 | 19.85 | 21.46 | 1 | 0.09 |
| 12CO | 13CO | ||||||
|---|---|---|---|---|---|---|---|
| Log | Log a | Log | |||||
| Star | (cm-2) | (K) | (cm-2) | (cm-2) | (K) | 12CO/13CO | |
| HD 24534 | 16.130.20 | 5.30.6 | 14.33 | 14.300.12 | 4.10.6 | 6831 | 1.30.3 |
| HD 27778 | 16.050.13 | 6.10.5 | 14.26 | 14.280.08 | 3.90.6 | 5914 | 1.60.3 |
| HD 177989 | 14.620.17 | 3.70.2 | 12.90 | 12.820.08 | 3.90.5 | 6325 | 1.00.2 |
| HD 203532 | 15.700.17 | 5.50.5 | 13.95 | 13.970.20 | 4.80.6 | 5421 | 1.10.2 |
| HD 206267 | 16.110.17 | 6.40.6 | 14.44 | 14.420.08 | 6.40.8 | 4915 | 1.00.2 |
| HD 210839 | 15.410.04 | 4.50.2 | 13.75 | 13.700.10 | 3.50.8 | 519 | 1.30.3 |