Chandra Multiwavelength Project
X-ray Point Source Catalog
Abstract
We present the Multiwavelength Project (ChaMP) X-ray point source catalog with X-ray sources detected in 149 observations covering . The full ChaMP catalog sample is seven times larger than the initial published ChaMP catalog. The exposure time of the fields in our sample ranges from to ksec, corresponding to a deepest X-ray flux limit of . The ChaMP X-ray data have been uniformly reduced and analyzed with ChaMP-specific pipelines, and then carefully validated by visual inspection. The ChaMP catalog includes X-ray photometric data in 8 different energy bands as well as X-ray spectral hardness ratios and colors.
To best utilize the ChaMP catalog, we also present the source reliability, detection probability and positional uncertainty. To quantitatively assess those parameters, we performed extensive simulations. In particular, we present a set of empirical equations: the flux limit as a function of effective exposure time, and the positional uncertainty as a function of source counts and off axis angle. The false source detection rate is of all detected ChaMP sources, while the detection probability is better than for sources with counts and off axis angle . The typical positional offset between ChaMP X-ray source and their optical counterparts is , derived from matched sources.
- : machine-readable tables
1 Introduction
Since the cosmic X-ray background (hereafter CXRB) was discovered by Giacconi et al. (1962), there have been several X-ray missions such as , , and . The - (hereafter ) and the - - - (hereafter -) are the current powerful X-ray missions with more sensitive imaging spectroscopy and higher positional accuracy than previous missions. To investigate the formation and evolution of galaxies, clusters of galaxies, and large scale structure of the universe, these previous and current X-ray missions have provided several deep and wide extra galactic X-ray surveys (see Brandt & Hasinger (2005) and references therein for a detailed review). Bauer et al. (2004) established the X-ray number counts from the Deep Field North (CDF-N) and South (CDF-S) and found that () of the CXRB is resolved into discrete X-ray sources in the 0.5-2 keV (2-8 keV) band. Using the - observation of the Lockman Hole and the CDFs, Worsley et al. (2005) found that the resolved fractions of the CXRB are (0.5-2 keV), (2-10 keV), and ( keV), respectively. Therefore, the CXRB is predominantly resolved into discrete sources in the 0.5-2 keV and 2-10 keV bands; however, the constituents of the CXRB in the hard energy band ( keV) are still unknown.
The deepest X-ray surveys are the CDF-N (Brandt et al., 2001; Alexander et al., 2003) and the CDF-S (Giacconi et al., 2001; Rosati et al., 2002) covering small sky areas (). The faint flux limits of the CDFs are (0.5-2 keV) and (2-8 keV), respectively. The - survey of the Lockman Hole covers with an effective exposure time of (flux range of in each band) (Worsley et al., 2004). The XMM large scale structure survey (-) is a medium depth () and large area () X-ray survey (Pierre et al., 2004). The XMM medium depth survey (XMDS) pointed at the center of reaches a flux limit of in the 0.5-2 keV band (Chiappetti et al., 2005). The X-ray survey of the NDWFS Botes is a contiguous wide () and medium depth () survey and contains 4642 sources with flux limits of in the 0.5-7 keV band (Murray et al., 2005).
The Chandra Multiwavelength Project (ChaMP) is a serendipitous archival survey of X-ray sources covering a wide area () with a range of depths exposures. The main scientific goals of the ChaMP are to investigate the (1) formation and evolution of high redshift AGN, (2) properties of X-ray luminous galaxies and clusters, and (3) constituents of the CXRB. Kim, D.-W. et al. (2004a, hereafter Paper I) reported the first ChaMP X-ray source catalog including 991 near on-axis, bright X-ray sources obtained from 62 ChaMP fields and Green et al. (2004) have performed optical and spectroscopic follow up observations of a subset of these ChaMP X-ray sources.
Using the first ChaMP X-ray point source catalog and the follow up surveys of optical and spectroscopic observations, there have been several interesting results. Kim, D.-W. et al. (2004b) established the number counts of the ChaMP X-ray point sources in the 0.5-2 keV and the 2-8 keV bands, which agreed with previous studies within the uncertainties, and found that there are no significant field-to-field variations in cosmic X-ray source number density on the scale of which corresponds to a single observational field of view. Silverman et al. (2005a) found the turnover in the co-moving space density of X-ray selected, luminous type 1 AGN ( measured in the 0.3-8 keV band) to be at consistent with the optical results. The hard X-ray emitting AGNs in twenty ChaMP fields were investigated and classified as broad emission-line AGN (), narrow emission-line galaxies (), absorption line galaxies (), stars (), or clusters (). Most X-ray unabsorbed AGN () have broad emission lines and blue optical colors but there is a significant population of redder AGNs with broad optical emission lines. Most X-ray absorbed AGN () are associated with narrow emission-line galaxies, those with red optical colors being dominated by luminous, early type galaxy hosts rather than dust reddened AGN (Silverman et al., 2005b). Barkhouse et al. (2006) presented the ChaMP X-ray extended source catalog which contains 55 extended sources from 130 fields. From the overlapping optical/X-ray fields ( ) they found 115 optical cluster candidates of which 13 were detected as extended X-ray sources. A comparison of the richness of the optical-only versus X-ray/optically matched cluster samples shows that the average richness of the optical-only clusters is smaller by than the matched X-ray/optical clusters. This result suggests that the optical-only sample is either (1) composed of mainly poor systems that lack sufficient hot gas for detection in the X-rays, or (2) are contaminated by nonvirialized filaments associated with the large-scale structure. Kim, D.-W. et al. (2006) investigated the normal galaxies at intermediate redshift in the ChaMP fields and found that normal galaxies at redshift, do not show significant evolution in . They built cumulative number counts and luminosity functions of the normal galaxies, and they found that a group of NELGs appear to be heavily obscured in X-rays while the low redshift AGNs in this sample do not appear to be significantly absorbed. Also, they found two E+A galaxy candidates and they concluded that those galaxies support the merger/interaction scenario of galaxy formation from their X-ray spectra studies.
In this paper, we present the ChaMP X-ray point source catalog including X-ray point sources obtained from 149 ChaMP fields and covering a sky area of . Compared to the first ChaMP X-ray point source catalog, this catalog contains seven times more sources, covers three times more sky area, and includes fainter sources and those with larger off axis angle. We performed extensive simulations to investigate the sensitivity, source probability, and positional uncertainty of the ChaMP sources. This catalog allows more statistically robust results from X-ray point source studies. The ChaMP data reduction procedures are similar to those in Paper I, therefore, we briefly summarize and/or skip those parts which are already described in Paper I and concentrate on newly added or improved procedures. In §2, we summarize the selection criteria and properties of the ChaMP fields. In §3, the data reduction and analysis of the ChaMP are described. §4 discusses the process and results of the ChaMP simulations. The ChaMP X-ray point source catalogs are provided in §5, and a summary and conclusions are given in §6.
2 ChaMP Field Selection
We selected fields observed with ACIS at high Galactic latitude, and excluded those fields containing large extended sources, planetary observations, and local group galaxies. Fields intended by their PIs as surveys were also excluded (see Paper I). These selection criteria yield 149 ChaMP fields in cycles 1 and 2, consisting of 35 ACIS-I and 114 ACIS-S observations. 7 ACIS-I and 28 ACIS-S ChaMP fields partly overlap one another on the sky, and those sources detected in multiple observations are listed separately, for example to allow study of source variability. In Table 1, the observational parameters of 149 ChaMP fields are listed in order of right ascension.
In Figure Chandra Multiwavelength Project X-ray Point Source Catalog, we display the 149 ChaMP field locations in equatorial coordinates. Red circles represent ACIS-I at the aim point, and blue circles ACIS-S. The circle size crudely indicates the Chandra exposure time, ranging from 0.9 to 124 ksecs. The ChaMP samples are uniformly distributed over the entire celestial sphere except (by selection) the Galactic plane region. Figure Chandra Multiwavelength Project X-ray Point Source Catalog shows the number distributions of the exposure times and Galactic extinction of the ChaMP fields in top and bottom panels, respectively. The mean exposure time of the ChaMP is and the mean Galactic extinction, . The ChaMP samples cover a wide range of exposure times and the Galactic extinction of the ChaMP fields are generally much lower than those of Galactic plane (). The 62 ChaMP fields included in Paper I are represented by shaded histograms. In this study, the X-ray point source catalog includes all X-ray sources in 149 ChaMP fields as well as fainter and larger off axis angle sources, while the catalog in Paper I included only near on-axis ( or S3 chip for ACIS-S observations) and bright () sources in 62 ChaMP fields.
3 ChaMP Data Reduction
We have developed a ChaMP-specific pipeline, XPIPE, to reduce the data. The pipeline consists of three main parts; (1) data correction and data screening using the CIAO111See http://cxc.harvard.edu/ciao. package, (2) source detection using the tool in the CIAO package, and (3) source extraction using the tool (Kim, E. et al., 2006; Martini et al., 2006) based on 222See http://heasarc.gsfc.nasa.gov/docs/software/fitsio/fitsio.html. library. The data correction and data screening procedures are the same as in Paper I. We do not use sources detected in the S4 chip (CCDID=8) because of the streaking problem (see Paper I).
3.1 Source Detection
For source detection, we use the tool available in the CIAO package. consists of two parts: , convolving the data with the wavelet function for selected size scales; and , constructing a final source list and estimating various parameters for each source (Freeman et al., 2002). We run in the B band (see Table 2 for energy band definition) with a significance threshold parameter of , which corresponds to one possible spurious pixel in one CCD (see §4.3.2 for our simulation results on the probability of finding a spurious source). We select a range of scale size parameters in seven steps from 1 to 64 pixels (). To avoid finding spurious sources located at the edge of the CCD chips, a minimum of of the on-axis exposure was required for source detection. Exposure maps of the ChaMP fields were generated for each CCD at an energy of 1.5 keV with an appropriate aspect histogram 333See http://cxc.harvard.edu/ciao/threads/expmap_acis_single.. Other parameters were set at the default values given in . The positions provided by in CIAO 2.3 for off-axis sources, where the shape of the Point Spread Function (PSF) is highly asymmetrical and the background contribution to the counts in the source cell is non-negligible, are less accurate than the positions of on-axis sources (Paper I). To alleviate this problem, we applied a position refinement algorithm (P. Freeman 2003, private communication), which iteratively redetermines the position of the off-axis source until it converges on the best centroid (see Paper I for detail descriptions), to the X-ray positions determined by in CIAO 2.3. When CIAO 3.0 or later versions are used, this process is not necessary, because the position refinement algorithm has been applied in 444See http://cxc.harvard.edu/ciao/releasenotes/ciao_3.0_release.html..
The size and shape of the PSF for varies as a function of off axis angle and radial direction. uses a Mexican Hat function, a reasonable function for mirrors/detectors which are characterized by a quasi-Gaussian PSF, and which detects sources successfully in most cases. However, the off-axis PSF is asymmetric and contains sub-structure in the core, causing to detect sometimes a spurious pair of double sources. We note that the sub-structure of the off-axis PSF can be resolved by because the size of the PSF becomes larger with increasing off axis angle. This PSF effect can be corrected by a PSF deconvolution (Paper I). In Paper I, source pairs with small separations were inspected and three pairs of spurious doubles were found, bright ( a few hundreds counts) enough to deconvolve with their PSFs. In this study, to identify and correct this PSF effect, we generated a single PSF image at the median location of each overlapping pair of sources whose positional centers are very close together (see §3.2.2 for quantitative definition of large overlapping sources) and a second image using a combination of two source PSFs. We then compared the observed source image with the modeled images. To generate the PSF images, we used a PSF ray trace tool 555See http://asc.harvard.edu/chart/threads/index.html. and a detector simulation tool MARX666See http://space.mit.edu/CXC/MARX/. assuming a monochromatic energy at 1.5 keV and a source counts ratio corresponding to that of overlapping sources as determined by XPIPE.
We found twelve pairs of spurious double sources and Figure Chandra Multiwavelength Project X-ray Point Source Catalog shows the observed sources image and the modeled images for a sample pair. First, we can see that the PSF shape at this location is asymmetric () and the positional centers of the spurious double sources are located along the elongated PSF direction. The shape of the observed X-ray sources () is similar to the single PSF () rather than that of the double source PSFs (). Therefore, we conclude that has incorrectly detected a single source as a double source due to the asymmetric sub-structure in the PSF. All double sources found to be spurious are too faint ( a few hundred counts) to deconvolve with their PSFs. Therefore, we assigned the median position of the spurious double sources as the new position of the single source and half of the distance between double sources was quadratically summed to their positional uncertainties (see §4.2.1 for the positional uncertainty of the ChaMP X-ray point sources). The source counts were then extracted at the new source position (see §3.2 for the source counts extraction).
3.2 Source Properties
After detecting X-ray sources with , we extracted their X-ray properties by applying aperture photometry. Since sometimes underestimates the net counts for faint sources (see §4.3), we do not use the -determined X-ray photometry. Instead, we apply an aperture photometry source extraction tool , developed for a general purpose and applicable to both and XMM-Newton data (Kim, E. et al., 2006). We note that XPIPE detects the source positions only in the B band with and applies the same position and size for the source extraction regions in every energy band. The reliability of the ChaMP source properties using XPIPE will be discussed in §4.3.
3.2.1 Source Count Extraction Regions
With the X-ray source position determined by , we extract source counts from a circle with a encircled energy radius, determined at 1.5 keV from the PSF table 777See http://cxc.harvard.edu/cal/Hrma/psf/index.html.. A minimum radius of and maximum of are chosen to avoid small number statistics in the source counts and severe fluctuations in the background sky. The source radii in this study are slightly smaller than those in Paper I which used an older version of the PSF tables. In the top panel of Figure Chandra Multiwavelength Project X-ray Point Source Catalog, the source radius for Paper I ( ) and that for this study ( ) are displayed as a function of off axis angle. The difference between source sizes is plotted as a dashed line, indicating a significant difference at large off axis angle. The source size is reduced by a maximum of at off axis angle of and unchanged in the axis region of compared to the old source size. In the bottom panel of Figure Chandra Multiwavelength Project X-ray Point Source Catalog, the difference between source counts in this and previous studies are displayed. The reduced source radii yield an average net counts lower by in this catalog compared with Paper I.
The size of the background extraction annulus is a free parameter generally chosen within the range 2 to 5 times the source radius, depending on local and global background fluctuations. However, for point sources inside an extended source, the size of the background extraction annulus was set to 1 to 2 times the source radius because in this case local variations in the background are much more important than global variations. The ChaMP X-ray extended sources are identified by with a large wavelet and source properties extracted via fitting with a Gaussian profile and a model. The ChaMP extended source catalog used in the ChaMP point source photometry is provided in a separate paper (Barkhouse et al., 2006).
3.2.2 Net Counts
The net counts of a source in a given energy band are determined by subtracting the normalized background counts from the source counts in the source region as follows:
| (1) |
where and are the total counts in the source and background regions, respectively. The normalization factor in equation (1) is given by:
| (2) |
where and are the mean exposure times for the source and background regions, respectively, and and are the geometric areas of the two regions. To avoid contamination in the background region, we exclude other point and extended source regions within the background region. The net counts errors are derived following Gehrels (1986).
There is a significant probability that two or more sources will overlap with each other, especially at large off axis angle. Note that the PSF size increases exponentially with increasing off axis angle. For overlapping sources, simple aperture photometry overestimates the source counts. While simultaneous fitting of multiple PSFs may be a good way to deconvolve overlapping sources, this process requires sufficient counts (a few hundred), which is unusual for typical X-ray observations. Thus to determine the net counts for overlapping sources, we apply two independent correction methods as in Paper I, a small overlap correction and a large overlap correction, depending on the amount of overlapping area involved.
In the left side of Figure Chandra Multiwavelength Project X-ray Point Source Catalog, we display a schematic diagram of a small overlapping source, in which the distance between them is greater than the radius of each source but less than the sum of their radii:
| (3) |
where is the encircled energy diameter of the PSF. A small overlap is the most common overlap among X-ray sources due to their relatively low density in the ChaMP fields. The corrected net counts and for the overlapping sources S1 and S2 are estimated as follows:
| (4) | |||||
| (5) |
where and are the net counts of S1 in area and the net counts of S2 in area , respectively. and are the angles in units of radians covered by sectors and of the overlapping sources, respectively. We assumed a radially symmetric event distribution for both X-ray sources.
The right side of Figure Chandra Multiwavelength Project X-ray Point Source Catalog displays an example of large overlapping sources, where the distance is less than the radius of each source. In this case, the center of each source is located within the source region of the overlapping partner, such that the above algorithm is not applicable. To correct this large overlapping case, first, we defined the core radius of each source as follows:
| (6) |
where is the distance between two overlapping sources. has a minimum of to allow a statistically robust estimation of the counts within the core radius. The corrected net counts of the large overlapping sources and are estimated as follows:
| (7) | |||
| (8) | |||
| (9) |
where is the sum of net counts of S1 and S2 (i.e. net counts in a union area of two source regions). and are the net counts of S1 in region and the net counts of S2 in region , respectively. and are the net counts of S1 in core region and the net counts of S2 in core region , respectively. The radii of core regions and are calculated with equation (6) and have the same size. Since the core region of each source is contaminated by photons from the overlapping source, the photons in unperturbed regions ( and ) are weighted higher than those in core regions ( and ) by a factor of two. Excluding spurious sources, small and large overlap corrections were applied to and of the ChaMP sources, respectively. We note that does not include the correction procedure for a source overlapping largely with more than one source. However, only one such case is included in the ChaMP X-ray point source catalog: CXOMP J111816.9+074558, CXOMP J111816.8+074600, and CXOMP J111816.8+074557 overlap largely each other, and they are the target of the observation (OBSID=363, gravitationally lensed quasar) having a pile-up flag (flag=37, see Table 4 in §3.2.5).
3.2.3 Hardness Ratio and Colors
The X-ray point source properties are extracted in the five ChaMP specified energy bands and in the three commonly used energy bands. The used energy bands and definitions of hardness ratio (HR) and X-ray colors (C21 and C32) are listed in Table 2 and their scientific rationale was described in Paper I. The HR and X-ray colors can be calculated from the source net counts in two different energy bands according to their definitions (hereafter classical method). However, for the faint sources, the HR, C21, and C32 and their error propagations from the classical method are often unreliable or unrealistic because of negative/undetectable net counts in one band or a non-Gaussian nature. Therefore, we calculated the HR, C21, and C32 with a Bayesian approach which models the detected counts as a Poisson distribution and which gives reliable HR and X-ray colors for both low and high count sources (van Dyk et al., 2004; Park et al., 2006).
To derive the HR and X-ray colors with the Bayesian approach, we used the BEHR888See http://hea-www.harvard.edu/AstroStat/BEHR/. program (version 07-27-2006, Park et al. 2006) with the required inputs: source counts, background counts, and ratio of background area to source area in both energy bands. We assumed a non-informative, flat, prior distribution on the linear scale (). We note that the energy-dependent vignetting in the soft and hard counts is not corrected for deriving the HR. The BEHR program calculates the solution with two different method: a Gibbs sampler (Monte Carlo integration) and a Gaussian quadrature (numerical integration). The Gibbs sampler is efficient but less accurate than the Gaussian quadrature for faint sources; however, the Gaussian quadrature becomes less efficient with increasing source counts. Therefore, we used the Gibbs sampler for bright sources ( in two energy bands) and Gaussian quadrature for faint sources ( in at least one energy band), respectively. The default values were used for the remaining optional inputs. The BEHR program calculates the mode, mean, and median of the posterior probability distribution. The mean of the distribution is a robust estimator for the HR, while the mode for the X-ray colors (Park et al., 2006). In Figure Chandra Multiwavelength Project X-ray Point Source Catalog, we compare the classical method with the Bayesian approach for HR and X-ray colors. For bright sources (), the HR and X-ray colors from both methods agree well; however, for faint sources (), they do not agree, because the classical method using the Gaussian statistics fails to describe the nature of faint sources.
3.2.4 Source Flux
In general, the X-ray source flux is determined as follows:
| (10) |
where the is the energy conversion factor which converts source count rate to source flux in units of . The varies with observation date and CCD pixel position because of the temporal and spatial variations of the ACIS CCD quantum efficiency 999See http://asc.harvard.edu/cal/Acis/Cal_prods/qeDeg for the low energy QE degradation. and the vignetting effect. The temporal QE variation of the can be corrected by generating s per observation and per CCD chip. To investigate the spatial variation of the , we generated the 0.3-2.5 keV map of an ACIS-I observation including ACIS-S S2 and S3 CCD chips. Using the redistribution matrix function (RMF) and ancillary response function (ARF) files and assuming a photon index of and Galactic absorption (Stark et al., 1992) for a given observation, we derive s with 101010See http://asc.harvard.edu/sherpa/threads/index.html. in grid points with grid size of 32 pixels in each CCD chip (here after ). In Figure 1, we display the contour maps smoothed with a cubic kernel and the left panels of Figure Chandra Multiwavelength Project X-ray Point Source Catalog shows the as a function of off axis angle in each CCD chip. The spatially varies by up to .
To quantitatively see the spatial variation of the QE, we display the ratios of the over the as a function of the off axis angle in the right panels of Figure Chandra Multiwavelength Project X-ray Point Source Catalog, where the is the calculated at a single position (the aim point position for ACIS-I CCDs and at the maximum exposure positions for S2 and S3 chips) and is the vignetting correction factor which is estimated from the exposure map at each grid position. The vignetting corrected agrees well with with the exception of points that are estimated from the CCD edge and bad pixels/columns ( ). The spatial variation of the QE is shown at large off axis angle ( ); however, the deviation is less than . Therefore, in this study, we ignore the spatial variation of the QE and correct the vignetting effect to determine the source flux as follows:
| (11) |
In Table 3, the are listed per observation (OBSID) and per CCD chip and calculated at the aim point for I0-I3 of ACIS-I observation and S3 of ACIS-S observation. For the remaining chips, is calculated at the maximum exposure position. For general usage, we calculated assuming various photon indices, , 1.4, and 1.7 and Galactic absorption from Stark et al. (1992) for that observation. We provide the effective exposure time of each X-ray source corrected for the vignetting effect at the source position (see Table 5 and 6 in §5.1).
3.2.5 Source Flags
All X-ray sources in the ChaMP catalog have been visually inspected to flag those sources with various special issues, as listed in Table 4. Flags 11 to 51, 53, and 54 were determined only by visual examination. The spurious double sources due to PSF effects (flag=15 and 38) are described in detail in §3.1. Since 35 of the 149 ChaMP fields partly overlap on the sky as seen in the column of Table 1, 453 sources were likely observed more than once (flag=52) in these overlapping fields. We identified these 453 source candidates by their positions, matching sources in multiply observed fields within a confidence level positional uncertainty (see equation (12) in §4.2.1). False sources having flags from 11 to 21 and extended X-ray sources (flag=51) including the X-ray jets (flag=54) are not listed in the ChaMP X-ray point source catalogs.
To remove bad pixels/columns, we used the bad pixel file. Additional hot pixels and bad columns were identified by visually inspecting each CCD image and an event histogram as a function of chip x-coordinate (see §3.1 in Paper I for details). The bad pixels are then included in generating an exposure map, which is in turn used to calculate the count rate and flux. Although the source flux may be slightly underestimated when a bad pixel sits at a source location, the effect of a single bad pixel is considerably mitigated by the aspect dither (following a Lissajous pattern over 16x16 ). Therefore, we flagged sources within which a bad pixel/column exists as flag=31 following visual inspection.
When the source is located at the edge of the CCD chip, where the minimum exposure value in the source region is less than of the maximum exposure value, flag 61 is assigned. The edge flag 61 and overlapping flags from 62 to 68 are automatically flagged by . The overlapping flags correspond to flags in Paper I, with more detailed classes included here: the overlapping class is subclassified as either small or large overlaps (see §3.2.2 for the definition of small and large overlap).
4 ChaMP X-ray Point Source Simulations
4.1 Simulation Procedure
To investigate source reliability and sensitivity, and to establish the empirical equations for positional uncertainty on X-ray sources in the ChaMP fields, we have performed extensive simulations. The technique was based on that of Kim, D.-W. and Fabbiano (2003) and consists of three parts, (1) generating artificial X-ray sources with MARX111111See http://space.mit.edu/CXC/MARX/ and MARX 4.0 Technical Manual., (2) adding them to the observed image, and (3) detecting these artificial sources with and extracting source properties with the . We have used every observed ChaMP field for our simulations, rather than blank background sky fields, to investigate the effects of background counts and source confusion.
We used the active I0, I1, I2, and I3 CCD chips for ACIS-I, and I2, I3, S2, and S3 CCD chips for ACIS-S observations, and simulated 1,000 artificial X-ray sources per observation. The number of detected artificial sources in each field depends on the effective exposure time and the observed region of the sky with various values of . On average, of the 146,178 input artificial X-ray sources are detected in our simulations, for a total artificial X-ray sources in 149 ChaMP fields. The number of detected artificial X-ray sources is 2.3 times the ChaMP sources in the same CCD chips and observations and statistically sufficient to estimate the properties of the ChaMP fields.
The form of the assumed number counts distribution is not critical to determine the detection probability, which is determined by the ratio of input to output numbers at a given flux (Vikhlinin et al., 1995; Kim, D.-W. and Fabbiano, 2003). The actual X-ray differential number counts are described by a broken/double power law with faint and bright slopes of and , respectively, (Yang et al., 2004; Basilakos et al., 2005; Chiappetti et al., 2005) in most energy bands; however, the break flux has not been well determined. Therefore, we assumed a cumulative number counts distribution with a single power law and a slope of corresponding to a slope of in the differential number counts, taking the average of the faint and bright slopes from the literature, in the 0.3-8 keV band. The flux of an artificial source was randomly selected from the assumed number counts distribution in a flux range of , and the MARX generated the artificial sources with a flux range of including the Poisson uncertainty of the input source counts. The flux range of the detected artificial sources spans which covers the flux range of the actual ChaMP X-ray point sources, .
We assume a power law spectrum with a photon index of , because the ChaMP X-ray points sources with have (Kim, D.-W. et al. 2004b; see Figure Chandra Multiwavelength Project X-ray Point Source Catalog and Chandra Multiwavelength Project X-ray Point Source Catalog in this paper). We note that these sources cover a flux range of (0.5-2 keV) and (2-8 keV) in , respectively. Tozzi et al. (2006) performed X-ray spectral analysis for 82 X-ray bright sources in the CDF-S, and they found that the weighted mean value for the slope of the power law spectrum is . The flux range of these bright sources in the CDF-S overlaps with the faint flux end of the ChaMP sources, therefore, we assumed that the faint ChaMP sources () also have a photon index of . We assumed Galactic absorption, , (Stark et al., 1992) for each observation; however, did not include intrinsic absorption in the artificial source spectrum. The spectrum of each X-ray point source was generated using the XSPEC121212See http://xspec.gsfc.nasa.gov/. package.
The position of an artificial source was randomly selected on each CCD chip, but it was rejected if the source area at a given random position had an exposure map value with less than of the maximum. This requirement is identical to that in the ChaMP X-ray point source reduction procedure. To avoid over-crowding of the artificial sources, artificial sources per CCD were divided into several groups to be added into the observed image: while we did not allow the artificial X-ray point sources to overlap one another, we allowed overlap between artificial and real X-ray sources to provide an estimate of source confusion in each observed field. This resulted in () simulated images per ACIS-I (ACIS-S) CCD, corresponding to CCD images (event files) to run through (). Since of the artificial sources are detected on average we added only artificial sources to each simulated image. The net counts of the overlapping artificial sources with real sources were corrected following the overlapping source correction methods described in §3.2.2.
To correct the temporal QE degradation of 131313See CXC Memo on 2002 July 29 (http://cxc.harvard.edu/cal/Acis/Cal_prods/qeDeg/index.html)., we used the for each observation, as described in §3.2.4. However, because of the mis-match between calibration data used in MARX Version 4.0.8 and our analysis, there is a slight difference in the count-flux conversion. Thus we performed a set of test simulations for each CCD chip and observation to correct this mis-match and then renormalized the MARX output by as much as per CCD chip in each observation. After generating and adding artificial X-ray point sources into observed X-ray images, we detected them and extracted their source properties with exactly the same techniques as used in the ChaMP X-ray point source catalog.
4.2 Positional Uncertainty
4.2.1 Empirical Equation of Positional Uncertainty
The positional uncertainty of X-ray sources is a function of source counts, off axis angle, and background counts. To estimate the positional uncertainty in the ChaMP fields, we investigated the offset between input and detected position for the artificial sources. To estimate the positional offsets of artificial sources, first we excluded the observed X-ray sources in simulated images to avoid the confusion caused by a mixture of observed and artificial X-ray sources. Second, we matched the input and detected artificial sources within twice the input source radius. The nearest object in this matching radius was assigned as a matched pair. An object with more than one match was assigned as a pair with the nearest neighbor. We then carefully performed a visual inspection to reject incorrectly matched sources. In the top panel of Figure Chandra Multiwavelength Project X-ray Point Source Catalog, we display the positional offset of the artificial X-ray sources split into three source count categories as a function of off axis angle. Since the source position is determined by , we used the source counts measured by rather than by our aperture photometry . It appears that the positional offsets exponentially increase with off axis angle and decrease as the source count increases with a power law form.
Applying the exponential function and the power law, we derive empirical equations for the positional uncertainty of ChaMP X-ray point sources. A confidence level, these are:
| (12) |
A confidence level:
| (13) |
A confidence level:
| (14) |
Here positional uncertainty, , is in arcseconds, and off axis angle, , is in arcminutes. Source counts, , are as extracted by . The above equations are valid for the ChaMP X-ray point sources with an off axis angle, and source counts, . For ChaMP X-ray point sources located at off axis angle larger than , the positional uncertainties were assigned to be . In the bottom panel of Figure Chandra Multiwavelength Project X-ray Point Source Catalog, using equation (12)-(14), we display the positional uncertainties as a function of off axis angle for three different source counts. Figure Chandra Multiwavelength Project X-ray Point Source Catalog shows the number distributions of positional uncertainty of the ChaMP X-ray point sources from equation (12)-(14). For , , and confidence level positional uncertainty distributions, the medians are , , and , respectively.
We also investigated the dependence of the positional uncertainties on the background counts; however, it is negligible in the ChaMP sample. Since we excluded high background regions such as the Galactic plane, the background counts per unit pixel of ChaMP X-ray sources are only and there are no significant background fluctuations in these fields. However, the background effect should be carefully considered to estimate the positional uncertainties of X-ray sources when the background fluctuations are severe, such as in the Galactic plane.
4.2.2 Astrometry
To ensure accurate absolute positions for the ChaMP X-ray point sources, we apply the standard aspect offsets 141414See http://cxc.harvard.edu/cal/ASPECT/.. For the ChaMP data set, the magnitude of the mean aspect offset correction is , and the maximum is (for OBSID=521). To further check the absolute positional accuracy of our ChaMP X-ray point sources, we matched the ChaMP X-ray sources with the SDSS-DR3 151515See http://www.sdss.org/dr3/. (hereafter SDSS) optical objects, for which the absolute positional uncertainty is less than . 60 of the 149 ChaMP fields overlap with the SDSS sky regions. Using the confidence level positional uncertainty equation (equation (12) in §4.2.1), over , we searched the SDSS optical candidates of the ChaMP X-ray sources. The minimum searching radius is large enough not to miss probable partners, and the maximum searching radius corresponds to half the mean separation of the SDSS objects, thereby, reducing the number of randomly matched objects.
Some X-ray sources have more than one SDSS candidate counterpart. To decide the most appropriate SDSS counterpart for these X-ray sources, we consider their X-ray and optical properties in addition to their offsets. The X-ray sources have a typical relation between X-ray flux and optical magnitude (Manners et al., 2003; Green et al., 2004). We applied the normalized distance between ChaMP and SDSS sources with positional uncertainty and X-ray to optical flux ratio as follows:
| (15) | |||
| (16) |
where is the distance between the ChaMP and the SDSS counterpart, is the X-ray flux in the Sc band, and is the visual magnitude in the band. First, for objects with one counterpart and with , we calculated the average of and . Second, for objects with multiple counterparts, we calculated the standard deviations of and relative to the average and , and introduced a likelihood as follows:
| (17) |
where . Finally, we chose the counterpart with the lowest among the multiple counterparts as the most appropriate counterpart.
We also calculated the average as a function of optical color and optical size. We classified the SDSS sources into four groups and recalculated the average of for each group. The four groups are resolved (galaxies), unresolved with (UVX QSOs), unresolved with (M stars), and all other unresolved. We then redetermined the SDSS counterpart for each X-ray source, after repeating the above procedures. Except for 20 of pairs, the matching results were same. To confirm the matching results, we performed a visual inspection for all matched objects. In the top panel of Figure Chandra Multiwavelength Project X-ray Point Source Catalog, the positional offsets between the ChaMP and the SDSS source are plotted as a function of off axis angle. The positional offset increases exponentially with off axis angle. The bottom panel shows the number distribution of the positional offsets between the matched ChaMP and SDSS sources. The median positional offset of confirmed matched sources is .
4.3 ChaMP Source Reliability
To understand the source reliability of the ChaMP point source catalog, we have investigated the detection probability, count recovery rate, false source rate, and flux limit of each ChaMP field using the simulation results.
4.3.1 Detection Probability
The detection probability is determined by the number ratio of detected artificial sources to input artificial sources. Since the sensitivity of the CCD chip varies spatially, the detection probability is a function of off axis angle as well as a function of source counts. Figure Chandra Multiwavelength Project X-ray Point Source Catalog shows the detection probability of a source as a function of the B band counts depending on off axis angle. The detection probability decreases as the source counts decrease, and as the off axis angle increases because the sensitivity of the CCD chip decreases as the off axis angle increases. Sources with counts and off axis angle are detected with greater than probability. We note that the detection probability as a function of flux may vary with source spectral shape if the source is quite different from our assumed spectral shape ().
4.3.2 False Source Rate
We also investigated the probability of false sources in the ChaMP catalog. With simulated images, we found that false sources are of the total detected sources. of these spurious sources have counts less than . Figure Chandra Multiwavelength Project X-ray Point Source Catalog shows the false source detection rate as a function of the B band source counts () and off axis angle (). The dashed lines indicate the best linear least square fitting results:
| (18) | |||
| (19) |
where is in units of arcminutes and is the source counts extracted by . The false source detection rate increases with decreasing source counts and increasing off axis angle. To derive equation (18), we used false sources with and for equation (19), we used all false sources.
4.3.3 Counts Recovery Rate
To confirm the quality of our photometry, we investigated the count recovery rate defined by the ratio of the difference between input counts and output counts () to input counts (). First, we compared the photometry results from (aperture photometry) and . The top panel of Figure Chandra Multiwavelength Project X-ray Point Source Catalog shows the count recovery rate using ( ) and using ( ) as a function of input counts. The count recovery rate of is , regardless of input counts. This is very close to that expected, given that our choice of the source extraction radius corresponds to the 95% encircled energy. We note that our count recovery rate agrees with that of Tozzi et al. (2001) in which they applied aperture photometry to the CDF-S sources with the source extraction region defined as a circle of radius , where is modeled from the PSF. While the -determined count recovery rate is for bright sources ( ), it underestimates the counts for sources with counts . For example, recovers for sources with input counts . This is primarily because uses a smaller source extraction radius for fainter sources.
Second, we have investigated the count recovery rate of depending on the off axis angle in the bottom panel of Figure Chandra Multiwavelength Project X-ray Point Source Catalog. The recovers source counts well regardless of the off axis angle; however, the statistical errors of the count recovery rate increase as the off axis angle increases, since the background fluctuations affect off-axis sources more severely than on-axis sources due to the larger source and background extraction regions.
4.3.4 Flux Limit and Exposure Time
Using four CCD chips (I0, I1, I2, and I3 for ACIS-I observations, and I2, I3, S2, and S3 for ACIS-S observations) per ChaMP field, we derived the relation between flux limit and exposure time of the observation in each energy band. The detected artificial sources with have been selected in each CCD chip, and their minimum flux is defined as the flux limit of that CCD chip. Figure Chandra Multiwavelength Project X-ray Point Source Catalog shows the flux limits of detected artificial sources in the ChaMP fields as a function of the exposure time. The best linear least square fit results of the relation between flux limits and exposure times in each energy band are as follows:
| (20) | |||
| (21) | |||
| (22) |
| (23) | |||
| (24) | |||
| (25) |
where is the net exposure time of each CCD chip in units of after excluding any background flares (see Paper I) and the flux is estimated assuming a photon index of . The scatter of the relation is caused by the varying sensitivity and detection probability of each CCD chip and OBSID. These equations give us a representative for the flux limit of X-ray sources depending on their exposure time in the B, S, H, Bc, Sc, and Hc bands in the ChaMP fields.
5 ChaMP X-ray Point Source Catalogs
5.1 Catalogs
We found 7365 X-ray point sources in 149 ChaMP fields, after excluding false sources (flag=11-21) and sources located close to the CCD chip edges (flag=61) (see Table 4 for flag definitions). The 102 target point sources (flag=53) are included in the catalog for completeness. We note that, for scientific analysis, target sources need to be carefully handled depending on their own scientific goals because they are not random sources. For example, we excluded the target sources to determine the X-ray point source number counts (Kim, D.-W. et al., 2004b; Kim, M. et al., 2006).
Since 35 of the 149 ChaMP fields partly overlap on the sky as seen in the column of Table 1, there are sources observed more than once in these overlapping fields. For simplicity and flexible usage, we present the sources in the overlapping fields in separate tables: e.g., for the X-ray number counts research, we used only the main ChaMP catalog to derive the sky coverage avoiding complex overlapping fields (Kim, M. et al., 2006). In the main ChaMP tables (Table 5, Table 8, and Table 10), we present all sources in fields observed once and those in the overlapping fields with the longest exposure time. In the supplementary ChaMP tables (Table 6, Table 9, and Table 11), we present the sources in the overlapping fields with shorter exposure times. The main ChaMP tables list X-ray point sources in 130 ChaMP fields and the supplementary ChaMP tables list 853 sources in 19 ChaMP fields. Tables 5 and 6 contain the source position, positional uncertainty, off axis angle, source radius, effective exposure time, and flag. Tables 8 and 9 give the photometry of the X-ray point sources in eight X-ray energy bands. Tables 10 and 11 list the hardness ratio and colors such as C21 and C32 of the X-ray point sources. In Table 7, we list the same source candidates in the overlapping fields (453 pairs/triples of 926 sources) with their observation date, source counts, count rates, and positional uncertainties. We note that these candidates are identified only by their positions, matching sources in the overlapping fields within a confidence level positional uncertainty (see equation (12) in §4.2.1). These sources also have a source flag of 52 (see §3.2.5). Table 7 allows us to investigate the variability of X-ray source brightness.
The ChaMP source name is given by its right ascension and declination. We note that the position of some sources in Paper I and this paper could be slightly different because the position refinement process was applied to sources with an off axis angle of in Paper I whereas in this paper it was applied to all sources. For the sources which were published in previous papers (Kim, D.-W. et al., 2004a; Green et al., 2004; Silverman et al., 2005a, b), we use the published name, even if the source position has been changed. The full versions of the tables are available in the electronic version of this paper and also on the ChaMP web site161616See http://hea-www.cfa.harvard.edu/CHAMP., while we only present a sample of each table in this paper.
5.2 The ChaMP X-ray Point Sources
To understand the properties of the ChaMP X-ray point sources, we investigated their statistical characteristics. After eliminating source duplications in the main and supplementary ChaMP catalogs, the ChaMP X-ray point source catalog contains unique sources. To eliminate the source duplication, we selected a source having the smallest positional uncertainty among the same source candidates in Table 7: since the positional uncertainty is a function of off axis angle and source counts (see §4.2.1), this criterion automatically selects a higher quality source. With these individual sources, we display the distributions of source count, flux, off axis angle, and hardness ratio and colors of these individual sources with their median values in Figure Chandra Multiwavelength Project X-ray Point Source Catalog through Figure Chandra Multiwavelength Project X-ray Point Source Catalog, respectively. Sources with signal to noise ratio, are displayed with shaded histograms. Figures Chandra Multiwavelength Project X-ray Point Source Catalog and Chandra Multiwavelength Project X-ray Point Source Catalog show the X-ray color-color diagrams of the ChaMP X-ray point sources in four CCD chips observed with ACIS-I and ACIS-S, respectively. The grid in the X-ray color-color diagram indicates the predicted locations of sources at redshift with various photon indices () and neutral hydrogen column densities (). Sources with ( ) and sources with ( ) are plotted. Most sources have absorption in the range and the photon index, . We note that the absorbed sources () in the ChaMP sample are not statistically significant ( in at least one energy band) and so are not plotted in Figure 20 and 21.
In Table 12, we summarize the statistical properties of the ChaMP X-ray point sources: number of sources, minimum, maximum, median, and mean for the source counts, source fluxes, effective exposure times, off axis angle, hardness ratio HR, color C21, and color C32. We define the properties of typical ChaMP X-ray point source as the median values of these quantities for sources with . The typical source fluxes are (0.5-2 keV) and (2-8 keV), respectively. The typical flux ranges are (0.5-2 keV) and (2-8 keV), respectively. The flux ranges of ChaMP X-ray sources cover the flux gap between the Deep Fields and previous surveys such as and , and fully cover the flux range around the break in the X-ray number counts (Kim, M. et al., 2006).
Thanks to the ChaMP’s medium depth ( in the 0.5-8 keV), wide sky coverage area ( ), and large number of sources (), we can investigate populations and evolution models of cosmic X-ray sources with small statistical errors. The ChaMP is a serendipitous survey, therefore it is suitable for investigating the field-to-field variations of X-ray sources. In later ChaMP papers, we will provide number counts of X-ray point sources and their contributions to the CXRB, spatial angular correlations, X-ray color-color analysis, and optical/IR/radio properties of X-ray sources. Also, we will extend our study of X-ray galaxies (Kim, D.-W. et al., 2006) and X-ray galaxy clusters (Barkhouse et al., 2006) in ChaMP fields.
6 Summary and Conclusions
1. We present the full ChaMP X-ray point source catalog. The main catalog contains sources from 130 ChaMP fields and the supplementary catalog contains sources from 19 ChaMP fields which are partly overlapping in their field of view with those in the main catalog. After eliminating duplications, our catalogs contain individual point sources, in a sky area of .
2. The ChaMP X-ray sources are uniformly reduced with the ChaMP XPIPE pipeline and carefully confirmed by visual inspections. Photometry in eight X-ray energy bands, hardness ratio, and X-ray colors of ChaMP X-ray point sources are provided. To calculate the flux of ChaMP X-ray point sources, we also provide the energy conversion factors (s) for each CCD chip and observation for photon indices, , 1.4, and 1.7 and Galactic absorption, and the vignetting corrected effective exposure times.
3. To understand the sensitivity and reliability of ChaMP X-ray point sources, we have performed extensive simulations. The detection probability of ChaMP sources is greater than for source counts of and off axis angle of . The count recovery rate is regardless of source counts. tends to underestimate the net counts for faint sources ( for counts). The false source detection probability is of the total detected sources and of these have source counts of .
4. Empirical equations for the positional uncertainties were derived from the ChaMP simulations. The positional uncertainty in ChaMP fields exponentially increases with off axis angle and decreases as the source counts increase with a power law form. Background fluctuations do not affect the positional uncertainty in our ChaMP sample. The , , and confidence levels of equations for the positional uncertainties are provided.
5. The absolute positional accuracy of the ChaMP X-ray sources is , estimated by matching with optical sources.
6. The typical ChaMP X-ray point source in the 0.5-2 keV band has counts of 24.3, flux of , effective exposure time of and off axis angle of . In the 2-8 keV band, the typical source has counts of 18.9, flux of , effective exposure time of and off axis angle of .
7. The hardness ratio and X-ray colors were calculated with a Bayesian approach which models the detected counts as a Poisson distribution. The typical hardness ratio of the ChaMP X-ray source is , and X-ray colors C21 and C32 are and , respectively.
8. The flux levels (in ) of sources are (0.5-8 keV), (0.5-2 keV), and (2-8 keV), respectively. In the X-ray color-color diagram, typical ChaMP sources are located within absorption range: and within photon index range: .
We gratefully acknowledge support for this project under NASA CXC archival research grant AR4-5017X and AR6-7020X . PJG, DWK, HT, and BJW also acknowledge support through NASA Contract NAS8-03060 (CXC). MGL is in part supported by the KOSEF grant (R01-2004-000-10490-0).
Facility: CXO (ACIS)
References
- Alexander et al. (2003) Alexander, D. M., Bauer, F. E., Brandt, W. N., Schneider, D. P., Hornschemeier, A. E., Vignali, C., Barger, A. J., Broos, P. S., Cowie, L. L., Garmire, G. P., Townsley, L. K., Bautz, M. W., Chartas, G., Sargent, W. L. W. 2003, AJ, 126, 539
- Barger et al. (2003) Barger, A. J., Cowie, L. L., Capak, P., Alexander, D. M., Bauer, F. E., Fernandez, E., Brandt, W. N., Garmire, G. P., Hornschemeier, A. E. 2003, AJ, 126, 632
- Barkhouse et al. (2006) Barkhouse, W. A., Green, P. J., Vikhlinin, A., Kim, D.-W., Perley, D., Cameron, R., Silverman, J., Mossman, A., Burenin, R., Jannuzi, B. T., Kim, M., Smith, M. G., Smith, R. C., Tananbaum, H., & Wilkes, B. J. 2006, astro-ph/0603521, accepted to ApJ
- Basilakos et al. (2005) Basilakos, S., Plionis, M., Georgakakis, A., & Georgantopoulos, I. 2005, MNRAS, 356, 183
- Bauer et al. (2004) Bauer, F. E., Alexander, D. M., Brandt, W. N., Schneider, D. P., Treister, E., Hornschemeier, A. E., Garmire, G. P. 2004, AJ, 128, 2048
- Brandt et al. (2001) Brandt, W. N., Alexander, D. M., Hornschemeier, A. E., Garmire, G. P., Schneider, D. P., Barger, A. J., Bauer, F. E., Broos, P. S., Cowie, L. L., Townsley, L. K., Burrows, D. N., Chartas, G., Feigelson, E. D., Griffiths, R. E., Nousek, J. A., Sargent, W. L. W. 2001, AJ, 122, 2810
- Brandt & Hasinger (2005) Brandt, W. N., & Hasinger, G., 2005, ARA&A, 43, 827
- Chiappetti et al. (2005) Chiappetti, L., Tajer, M., Trinchieri, G., Maccagni, D., Maraschi, L., Paioro, L., Pierre, M., Surdej, J., Garcet, O., Gosset, E., Le Fevre, O., Bertin, E., McCracken, H. J., Mellier, Y., Foucaud, S., Radovich, M., Ripepi, V., Arnaboldi, M., 2005, A&A, 439, 413
- Gehrels (1986) Gehrels, N. 1986, ApJ, 303, 336
- Giacconi et al. (1962) Giacconi, R., Gursky, H., Paolini, F. R., Rossi, B. B. 1962, 9, 439
- Giacconi et al. (2001) Giacconi, R., Rosati, P., Tozzi, P., Nonino, M., Hasinger, G., Norman, C., Bergeron, J., Borgani, S., Gilli, R., Gilmozzi, R., Zheng, W. ApJ, 551, 624
- Green et al. (2004) Green, P. J., Silverman, J. D., Cameron, R. A., Kim, D.-W., Wilkes, B. J., Barkhouse, W. A., LaCluyz, A., Morris, D., Mossman, A., Ghosh, H., Grimes, J. P., Jannuzi, B. T., Tananbaum, H., Aldcroft, T. L., Baldwin, J. A., Chaffee, F. H., Dey, A., Dosaj, A., Evans, N. R., Fan, X., Foltz, C., Gaetz, T., Hooper, E. J., Kashyap, V. L., Mathur, S., McGarry, M. B., Romero-Colmenero, E., Smith, M. G., Smith, P. S., Smith, R. C., Torres, G., Vikhlinin, A., Wik, D. R. 2004, ApJS, 150, 43
- Freeman et al. (2002) Freeman, P. E., Kashyap, V., Rosner, R., & Lamb, D.Q. 2002, ApJS, 138, 185
- Hasinger et al. (1993) Hasinger, G., Burg, R., Giacconi, R., Hartner, G., Schmidt, M., Trumper, J., & Zamorani, G. 1993, A&A, 275, 1
- Kim, D.-W. and Fabbiano (2003) Kim, D.-W., & Fabbiano, G. 2003, ApJ, 586, 826
- Kim, D.-W. et al. (2004a) Kim, D.-W., Cameron, R. A., Drake, J. J., Evans, N. R., Freeman, P., Gaetz, T. J., Ghosh, H., Green, P. J., Harnden, F. R., Jr., Karovska, M., Kashyap, V., Maksym, P. W., Ratzlaff, P. W., Schlegel, E. M., Silverman, J. D., Tananbaum, H. D., Vikhlinin, A. A., Wilkes, B. J., & Grimes, J. P. 2004a, ApJS, 150, 19 (Paper I)
- Kim, D.-W. et al. (2004b) Kim, D.-W., Wilkes, B. J., Green, P. J., Cameron, R. A., Drake, J. J., Evans, N. R., Freeman, P., Gaetz, T. J., Ghosh, H., Harnden, F. R., Jr., Karovska, M., Kashyap, V., Maksym, P. W., Ratzlaff, P. W., Schlegel, E. M., Silverman, J. D., Tananbaum, H. D., & Vikhlinin, A. A. 2004b, ApJ, 600, 59
- Kim, D.-W. et al. (2006) Kim, D.-W., Barkhouse, W. A., Green, P. J., Kim, M., Mossman, A., Schlegel, E., Silverman, J. D., Aldcroft, T., Anderson, C., Kashyap, V., Tananbaum, H., & Wilkes, B. J. 2006, accepted to ApJ
- Kim, E. et al. (2006) Kim, E. et al. 2006, in preparation
- Kim, M. et al. (2006) Kim, M. et al. 2006, submitted to ApJ
- Manners et al. (2003) Manners, J. C., Johnson, O., Almaini, O., Willott, C. J., Gonzalez-Solares, E., Lawrence, A., Mann, R. G., Perez-Fournon, I., Dunlop, J. S., McMahon, R. G., Oliver, S. J., Rowan-Robinson, M., & Serjeant, S. 2003, MNRAS, 343, 293
- Martini et al. (2006) Martini, P., Kelson, D. D., Kim, E., Mulchaey, J. S., Athey, A. A. 2006, astro-ph/0602496, accepted to ApJ
- Moretti et al. (2003) Moretti, A., Campana, S., Lazzati, D., & Tagliaferri, G. 2003, ApJ, 588, 696
- Murray et al. (2005) Murray, S. S., Kenter, A., Forman, W. R., Jones, C., Green, P. J., Kochanek, C. S., Vikhlinin, A., Fabricant, D., Fazio, G., Brand, K., Brown, M. J. I., Dey, A., Jannuzi, B. T., Najita, J., McNamara, B., Shields, J., Rieke, M., 2005, ApJS, 161, 1
- Park et al. (2006) Park, T., Kashyap, V. L., Siemiginowska, A., van Dyk, D. A., Zezas, A., Heinke, C., Wargelin, B. J. 2006, astro-ph/0606247, accepted to ApJ
- Pierre et al. (2004) Pierre, M., Valtchanov, I., Altieri, B., Andreon, S., Bolzonella, M., Bremer, M., Disseau, L., Dos Santos, S., Gandhi, P., Jean, C., Pacaud, F., Read, A., Refregier, A., Willis, J., Adami, C., Alloin, D., Birkinshaw, M., Chiappetti, L., Cohen, A., Detal, A., Duc, P.-A., Gosset, E., Hjorth, J., Jones, L., LeFevre, O., Lonsdale, C., Maccagni, D., Mazure, A., McBreen, B., McCracken, H., Mellier, Y., Ponman, T., Quintana, H., Rottgering, H., Smette, A., Surdej, J., Starck, J.-L., Vigroux, L., White, S. 2004, Journal of Cosmology and Astroparticle Physics, 9, 11
- Rosati et al. (2002) Rosati, P., Tozzi, P., Giacconi, R., Gilli, R., Hasinger, G., Kewley, L., Mainieri, V., Nonino, M., Norman, C., Szokoly, G., Wang, J. X., Zirm, A., Bergeron, J., Borgani, S., Gilmozzi, R., Grogin, N., Koekemoer, A., Schreier, E., Zheng, W. 2002, ApJ, 566, 667
- Silverman et al. (2005a) Silverman, J. D., Green, P. J., Barkhouse, W. A., Cameron, R. A., Foltz, C., Jannuzi, B. T., Kim, D.-W., Kim, M., Mossman, A., Tananbaum, H., Wilkes, B. J., Smith, M. G., Smith, R. C., Smith, P. S. 2005, ApJ, 624, 630
- Silverman et al. (2005b) Silverman, J., Green, P., Barkhouse, W., Kim, D.-W., Aldcroft, T., Cameron, R., Wilkes, B., Mossman, A., Ghosh, H., Tananbaum, H., Smith, M., Smith, R., Smith, P., Foltz, C., Wik, D., Jannuzi, B. 2005, ApJ, 618, 123
- Stark et al. (1992) Stark, A. A. et al. 1992, ApJS, 79,77
- Tozzi et al. (2001) Tozzi, P., Rosati, P., Nonino, M., Bergeron, J., Borgani, S., Gilli, R., Gilmozzi, R., Hasinger, G., Grogin, N., Kewley, L., Koekemoer, A., Norman, C., Schreier, E., Szokoly, G., Wang, J. X., Zheng, W., Zirm, A., Giacconi, R. 2001, ApJ, 562, 42
- Tozzi et al. (2006) Tozzi, P., Gilli, R., Mainieri, V., Norman, C., Risaliti, G., Rosati, P., Bergeron, J., Borgani, S., Giacconi, R., Hasinger, G., Nonino, M., Streblyanska, A., Szokoly, G., Wang, J. X., & Zheng, W. 2006, A&A, 451, 457
- van Dyk et al. (2004) van Dyk, D. A., Park, T., Kashyap, V. L., & Zezas, A. 2004, American Astronomical Society, HEAD meeting, 8, 16.27, ”Computing Hardness Ratios with Poissonian Errors”
- Vikhlinin et al. (1995) Vikhlinin, A., Forman, W., Jones, C., & Murray, S. S. 1995, ApJ, 451, 542
- Worsley et al. (2004) Worsley, M. A., Fabian, A. C., Barcons, X., Mateos, S., Hasinger, G., & Brunner, H. 2004, MNRAS, 352, L28
- Worsley et al. (2005) Worsley, M. A., Fabian, A. C., Bauer, F. E., Alexander, D. M., Hasinger, G., Mateos, S., Brunner, H., Brandt, W. N., & Schneider, D. P., 2005, MNRAS, 357, 1281
- Yang et al. (2004) Yang, Y., Mushotzky, R. F., Steffan, A. T., Barger, A. J., & Cowie, L. L. 2004, AJ, 128, 1501
| Obs. | Sequence | Target | R.A. | Decl. | Obs. | Exposure | Aim Point | CCD | Multi | Paper I | |
|---|---|---|---|---|---|---|---|---|---|---|---|
| ID | Number | Name | (J2000) | (J2000) | Date | () | Detector | Used | ID | Used | |
| (1) | (2) | (3) | (4) | (5) | (6) | (7) | (8) | (9) | (10) | (11) | (12) |
| 520 (catalog ADS/Sa.CXO#obs/520) | 800028 | MS 0015.9+1609 | 4.06 | 2000 Aug 18 | 60.99 | ACIS-I | 01236 | Y | |||
| 1595 (catalog ADS/Sa.CXO#obs/1595) | 700211 | 3C9 | 4.16 | 2001 Jun 10 | 13.27 | ACIS-S | 235678 | ||||
| 2098 (catalog ADS/Sa.CXO#obs/2098) | 700288 | LBQS 0019+0107 | 2.92 | 2001 Dec 08 | 4.70 | ACIS-S | 235678 | ||||
| 2099 (catalog ADS/Sa.CXO#obs/2099) | 700289 | LBQS 0021-0213 | 2.95 | 2001 Aug 20 | 6.65 | ACIS-S | 235678 | ||||
| 929 (catalog ADS/Sa.CXO#obs/929) | 800105 | CL 0024+17 | 4.19 | 2000 Sep 06 | 36.72 | ACIS-S | 245678 | ||||
| 2100 (catalog ADS/Sa.CXO#obs/2100) | 700290 | LBQS 0025-0151 | 2.81 | 2001 Oct 31 | 4.40 | ACIS-S | 235678 | ||||
| 2101 (catalog ADS/Sa.CXO#obs/2101) | 700291 | LBQS 0029+0017 | 2.41 | 2001 Jun 20 | 3.82 | ACIS-S | 235678 | ||||
| 2242 (catalog ADS/Sa.CXO#obs/2242) | 900069 | GSGP4X:048 | 1.69 | 2000 Dec 18 | 6.66 | ACIS-S | 235678 | 12 | Y | ||
| 2243 (catalog ADS/Sa.CXO#obs/2243) | 900070 | GSGP4X:057 | 1.76 | 2000 Oct 30 | 8.75 | ACIS-S | 235678 | 13 | |||
| 2244 (catalog ADS/Sa.CXO#obs/2244) | 900071 | GSGP4X:069 | 1.62 | 2000 Oct 30 | 6.86 | ACIS-S | 235678 | 12 | Y | ||
| 2245 (catalog ADS/Sa.CXO#obs/2245) | 900072 | GSGP4X:082 | 1.43 | 2000 Oct 30 | 6.52 | ACIS-S | 235678 | 12 | Y | ||
| 2246 (catalog ADS/Sa.CXO#obs/2246) | 900073 | GSGP4X:091 | 1.62 | 2001 Jan 13 | 8.49 | ACIS-S | 235678 | 13 | |||
| 2247 (catalog ADS/Sa.CXO#obs/2247) | 900074 | GSGP4X:109 | 1.37 | 2000 Nov 07 | 10.88 | ACIS-S | 235678 | 12 | Y | ||
| 2248 (catalog ADS/Sa.CXO#obs/2248) | 900075 | GSGP4X:114 | 1.55 | 2000 Nov 08 | 10.11 | ACIS-S | 235678 | 13 | Y | ||
| 2179 (catalog ADS/Sa.CXO#obs/2179) | 700369 | PSS 0059+0003 | 3.01 | 2001 Sep 18 | 2.58 | ACIS-S | 235678 | ||||
| 521 (catalog ADS/Sa.CXO#obs/521) | 800029 | CL 0107+31 | 5.49 | 1999 Oct 23 | 46.87 | ACIS-I | 01237 | Y | |||
| 813 (catalog ADS/Sa.CXO#obs/813) | 700118 | Q0059-2735 | 1.97 | 2000 May 15 | 4.29 | ACIS-S | 235678 | ||||
| 2180 (catalog ADS/Sa.CXO#obs/2180) | 700370 | BRI 0103+0032 | 3.15 | 2001 Sep 18 | 3.61 | ACIS-S | 235678 | ||||
| 342 (catalog ADS/Sa.CXO#obs/342) | 700014 | NGC 526A | 2.09 | 2000 Feb 07 | 5.78 | ACIS-S | 235678 | Y | |||
| 2129 (catalog ADS/Sa.CXO#obs/2129) | 700319 | 3C 47 | 5.71 | 2001 Jan 16 | 39.89 | ACIS-S | 235678 | ||||
| 814 (catalog ADS/Sa.CXO#obs/814) | 700119 | Q0135-4001 | 1.97 | 2000 Jan 02 | 3.82 | ACIS-S | 23678 | ||||
| 2181 (catalog ADS/Sa.CXO#obs/2181) | 700371 | SDSS0150+0041 | 2.82 | 2001 Aug 31 | 2.74 | ACIS-S | 235678 | ||||
| 913 (catalog ADS/Sa.CXO#obs/913) | 800089 | CL J0152.7-1357 | 1.61 | 2000 Sep 08 | 34.81 | ACIS-I | 012367 | Y | |||
| 2223 (catalog ADS/Sa.CXO#obs/2223) | 800162 | NGC 741 GROUP | 4.43 | 2001 Jan 28 | 24.72 | ACIS-S | 235678 | ||||
| 2081 (catalog ADS/Sa.CXO#obs/2081) | 700271 | SDSS021102-000910 | 2.72 | 2001 Jan 09 | 3.80 | ACIS-S | 235678 | ||||
| 1642 (catalog ADS/Sa.CXO#obs/1642) | 700258 | HE0230-2130 | 2.27 | 2000 Oct 14 | 8.35 | ACIS-S | 123678 | Y | |||
| 135 (catalog ADS/Sa.CXO#obs/135) | 700120 | Q0254-334 | 2.26 | 2000 Feb 15 | 0.94 | ACIS-S | 235678 | 1 | |||
| 815 (catalog ADS/Sa.CXO#obs/815) | 700120 | Q0254-334 | 2.26 | 2000 Jan 02 | 1.16 | ACIS-S | 23678 | 1 | |||
| 525 (catalog ADS/Sa.CXO#obs/525) | 800033 | MS 0302.7+1658 | 10.94 | 2000 Oct 03 | 8.95 | ACIS-I | 01236 | Y | |||
| 796 (catalog ADS/Sa.CXO#obs/796) | 600099 | SBS 0335-052 | 4.98 | 2000 Sep 07 | 46.81 | ACIS-I | 012367 | Y | |||
| 624 (catalog ADS/Sa.CXO#obs/624) | 200049 | LP 944-20 | 1.44 | 1999 Dec 15 | 40.94 | ACIS-S | 23678 | Y | |||
| 2182 (catalog ADS/Sa.CXO#obs/2182) | 700372 | BRI 0401-1711 | 2.30 | 2001 Aug 03 | 3.35 | ACIS-S | 235678 | ||||
| 418 (catalog ADS/Sa.CXO#obs/418) | 700090 | MITG J0414+0534 | 11.31 | 2000 Apr 02 | 7.34 | ACIS-S | 123678 | 3 | |||
| 1628 (catalog ADS/Sa.CXO#obs/1628) | 700244 | MITG J0414+0534 | 11.31 | 2001 Feb 05 | 8.72 | ACIS-S | 123678 | 3 | |||
| 421 (catalog ADS/Sa.CXO#obs/421) | 700093 | MITG J0414+0534 | 11.31 | 2000 Aug 16 | 6.56 | ACIS-S | 123678 | 3 | |||
| 936 (catalog ADS/Sa.CXO#obs/936) | 900008 | AX J0431-0526 | 4.89 | 2000 Oct 03 | 3.81 | ACIS-I | 012367 | ||||
| 902 (catalog ADS/Sa.CXO#obs/902) | 800078 | MS 0451.6-0305 | 5.18 | 2000 Oct 08 | 41.53 | ACIS-S | 235678 | Y | |||
| 346 (catalog ADS/Sa.CXO#obs/346) | 700018 | PICTOR A | 4.12 | 2000 Jan 18 | 25.44 | ACIS-S | 23678 | Y | |||
| 914 (catalog ADS/Sa.CXO#obs/914) | 800090 | CL J0542.8-4100 | 3.59 | 2000 Jul 26 | 48.72 | ACIS-I | 01236 | Y | |||
| 1602 (catalog ADS/Sa.CXO#obs/1602) | 700218 | Q0615+820 | 5.27 | 2001 Oct 18 | 43.08 | ACIS-S | 235678 | ||||
| 377 (catalog ADS/Sa.CXO#obs/377) | 700049 | B2 0738+313 | 4.18 | 2000 Oct 10 | 26.91 | ACIS-S | 235678 | Y | |||
| 838 (catalog ADS/Sa.CXO#obs/838) | 700143 | 3C 200 | 3.69 | 2000 Oct 06 | 10.07 | ACIS-S | 235678 | Y | |||
| 1643 (catalog ADS/Sa.CXO#obs/1643) | 700259 | APM08279+5255 | 3.91 | 2000 Oct 11 | 6.87 | ACIS-S | 123678 | Y | |||
| 2130 (catalog ADS/Sa.CXO#obs/2130) | 700320 | 3C 207 | 4.14 | 2000 Nov 04 | 22.90 | ACIS-S | 235678 | Y | |||
| 818 (catalog ADS/Sa.CXO#obs/818) | 700123 | Q0842+3431 | 3.41 | 2000 Jan 22 | 4.07 | ACIS-S | 23678 | ||||
| 1708 (catalog ADS/Sa.CXO#obs/1708) | 800103 | CL 0848.6+4453 | 2.73 | 2000 May 03 | 59.39 | ACIS-I | 012367 | 8 | Y | ||
| 927 (catalog ADS/Sa.CXO#obs/927) | 800103 | CL 0848.6+4453 | 2.73 | 2000 May 04 | 122.18 | ACIS-I | 012367 | 8 | Y | ||
| 1596 (catalog ADS/Sa.CXO#obs/1596) | 700212 | 0902+343 | 2.28 | 2000 Oct 26 | 9.68 | ACIS-S | 235678 | Y | |||
| 2452 (catalog ADS/Sa.CXO#obs/2452) | 800166 | RX J0910+5422 | 1.99 | 2001 Apr 24 | 63.83 | ACIS-I | 01236 | 11 | |||
| 2227 (catalog ADS/Sa.CXO#obs/2227) | 800166 | RX J0910+5422 | 1.98 | 2001 Apr 29 | 104.25 | ACIS-I | 01236 | 11 | Y | ||
| 419 (catalog ADS/Sa.CXO#obs/419) | 700091 | RX J0911.4+0551 | 3.70 | 1999 Nov 02 | 24.55 | ACIS-S | 01237 | 4 | Y | ||
| 1629 (catalog ADS/Sa.CXO#obs/1629) | 700245 | RXJ0911.4+0551 | 3.70 | 2000 Oct 29 | 9.13 | ACIS-S | 123678 | 4 | Y | ||
| 839 (catalog ADS/Sa.CXO#obs/839) | 700144 | 3C 220.1 | 1.90 | 1999 Dec 29 | 17.14 | ACIS-S | 23678 | Y | |||
| 805 (catalog ADS/Sa.CXO#obs/805) | 600108 | I ZW 18 | 1.99 | 2000 Feb 08 | 24.49 | ACIS-S | 235678 | Y | |||
| 2453 (catalog ADS/Sa.CXO#obs/2453) | 700285 | 3C 228 | 3.14 | 2001 Apr 23 | 9.13 | ACIS-S | 235678 | 10 | |||
| 2095 (catalog ADS/Sa.CXO#obs/2095) | 700285 | 3C 228 | 3.13 | 2001 Jun 03 | 13.69 | ACIS-S | 235678 | 10 | |||
| 926 (catalog ADS/Sa.CXO#obs/926) | 800102 | MS 1008.1-1224 | 6.74 | 2000 Jun 11 | 43.87 | ACIS-I | 012367 | Y | |||
| 937 (catalog ADS/Sa.CXO#obs/937) | 900009 | AX J1025+4714 | 1.28 | 2000 Jun 07 | 1.99 | ACIS-I | 012367 | ||||
| 2102 (catalog ADS/Sa.CXO#obs/2102) | 700292 | LBQS 1029-0125 | 4.89 | 2001 May 30 | 4.40 | ACIS-S | 235678 | ||||
| 512 (catalog ADS/Sa.CXO#obs/512) | 800020 | EMSS 1054.5-0321 | 3.67 | 2000 Apr 21 | 75.60 | ACIS-S | 123678 | Y | |||
| 915 (catalog ADS/Sa.CXO#obs/915) | 800091 | CL J1113.1-2615 | 5.52 | 2000 Aug 13 | 101.35 | ACIS-I | 012367 | Y | |||
| 2209 (catalog ADS/Sa.CXO#obs/2209) | 800148 | 3C254 | 1.91 | 2001 Mar 26 | 28.38 | ACIS-S | 23678 | ||||
| 363 (catalog ADS/Sa.CXO#obs/363) | 700035 | PG 1115+080 | 4.01 | 2000 Jun 02 | 24.42 | ACIS-S | 123678 | 2 | Y | ||
| 1630 (catalog ADS/Sa.CXO#obs/1630) | 700246 | PG1115+080 | 4.01 | 2000 Nov 03 | 9.73 | ACIS-S | 123678 | 2 | Y | ||
| 868 (catalog ADS/Sa.CXO#obs/868) | 700173 | PG 1115+407 | 1.91 | 2000 Oct 03 | 17.37 | ACIS-I | 012367 | Y | |||
| 1660 (catalog ADS/Sa.CXO#obs/1660) | 800128 | V 1121+2327 | 1.30 | 2001 Apr 23 | 68.19 | ACIS-I | 01236 | ||||
| 819 (catalog ADS/Sa.CXO#obs/819) | 700124 | UM 425 | 4.09 | 2000 Apr 07 | 2.55 | ACIS-S | 235678 | ||||
| 424 (catalog ADS/Sa.CXO#obs/424) | 700096 | PMN J1131+0455 | 3.46 | 2000 Dec 15 | 6.37 | ACIS-S | 123678 | ||||
| 2126 (catalog ADS/Sa.CXO#obs/2126) | 700316 | 3C263 | 1.15 | 2000 Oct 28 | 29.15 | ACIS-S | 235678 | Y | |||
| 898 (catalog ADS/Sa.CXO#obs/898) | 800074 | B1138-262 | 4.95 | 2000 Jun 06 | 23.50 | ACIS-S | 235678 | Y | |||
| 536 (catalog ADS/Sa.CXO#obs/536) | 800044 | MS 1137.5+6625 | 1.18 | 1999 Sep 30 | 114.61 | ACIS-I | 012367 | Y | |||
| 874 (catalog ADS/Sa.CXO#obs/874) | 700179 | 1156+295 | 1.66 | 2000 Jun 29 | 94.57 | ACIS-I | 012367 | ||||
| 2183 (catalog ADS/Sa.CXO#obs/2183) | 700373 | SDSS1204-0021 | 2.13 | 2000 Dec 02 | 5.19 | ACIS-S | 235678 | ||||
| 2083 (catalog ADS/Sa.CXO#obs/2083) | 700273 | SDSS120823+001027 | 1.99 | 2001 Mar 18 | 4.52 | ACIS-S | 235678 | ||||
| 2103 (catalog ADS/Sa.CXO#obs/2103) | 700293 | LBQS 1205+1436 | 2.56 | 2002 Mar 08 | 5.59 | ACIS-S | 235678 | ||||
| 2104 (catalog ADS/Sa.CXO#obs/2104) | 700294 | LBQS 1208+1535 | 2.66 | 2002 Mar 08 | 4.01 | ACIS-S | 235678 | ||||
| 2106 (catalog ADS/Sa.CXO#obs/2106) | 700296 | LBQS 1216+1103 | 2.14 | 2001 Mar 18 | 4.14 | ACIS-S | 235678 | ||||
| 1662 (catalog ADS/Sa.CXO#obs/1662) | 800130 | V 1221+4918 | 1.43 | 2001 Aug 05 | 77.01 | ACIS-I | 01236 | ||||
| 2486 (catalog ADS/Sa.CXO#obs/2486) | 900080 | CHVC125 | 2.73 | 2001 Dec 24 | 20.54 | ACIS-S | 235678 | 15 | |||
| 938 (catalog ADS/Sa.CXO#obs/938) | 900010 | AX J1227+4421 | 1.34 | 2000 Oct 04 | 4.75 | ACIS-I | 012367 | ||||
| 2484 (catalog ADS/Sa.CXO#obs/2484) | 900080 | CHVC125 | 2.71 | 2001 Oct 25 | 23.94 | ACIS-S | 235678 | 15 | |||
| 2253 (catalog ADS/Sa.CXO#obs/2253) | 900080 | CHVC125 | 2.69 | 2002 Jan 14 | 43.95 | ACIS-S | 235678 | 15 | |||
| 1712 (catalog ADS/Sa.CXO#obs/1712) | 790054 | 3C 273 | 1.79 | 2000 Jun 14 | 12.04 | ACIS-S | 456789 | Y | |||
| 2107 (catalog ADS/Sa.CXO#obs/2107) | 700297 | LBQS 1231+1320 | 2.57 | 2001 Aug 07 | 5.82 | ACIS-S | 235678 | ||||
| 2108 (catalog ADS/Sa.CXO#obs/2108) | 700298 | LBQS 1235+0857 | 1.74 | 2001 Mar 18 | 5.33 | ACIS-S | 235678 | ||||
| 820 (catalog ADS/Sa.CXO#obs/820) | 700125 | LBQS 1235+1807B | 1.96 | 2000 Jan 21 | 1.24 | ACIS-S | 23678 | ||||
| 2109 (catalog ADS/Sa.CXO#obs/2109) | 700299 | LBQS 1239+0955 | 1.79 | 2001 Jul 25 | 5.06 | ACIS-S | 235678 | ||||
| 821 (catalog ADS/Sa.CXO#obs/821) | 700126 | Q1246-0542 | 2.17 | 2000 Feb 08 | 5.38 | ACIS-S | 235678 | ||||
| 2084 (catalog ADS/Sa.CXO#obs/2084) | 700274 | PC 1247+3406 | 1.23 | 2001 Mar 24 | 4.52 | ACIS-S | 235678 | ||||
| 1031 (catalog ADS/Sa.CXO#obs/1031) | 700389 | Mrk 231 | 1.25 | 2000 Oct 19 | 23.30 | ACIS-S | 235678 | ||||
| 2210 (catalog ADS/Sa.CXO#obs/2210) | 800149 | 3C280 | 1.15 | 2001 Aug 27 | 49.80 | ACIS-S | 235678 | ||||
| 325 (catalog ADS/Sa.CXO#obs/325) | 800063 | S-Z CLUSTER | 1.37 | 1999 Dec 03 | 80.61 | ACIS-S | 23678 | Y | |||
| 2228 (catalog ADS/Sa.CXO#obs/2228) | 800167 | RX J1317.4+2911 | 1.04 | 2001 May 04 | 108.09 | ACIS-I | 01236 | Y | |||
| 2110 (catalog ADS/Sa.CXO#obs/2110) | 700300 | LBQS 1331-0108 | 2.31 | 2001 Mar 18 | 4.96 | ACIS-S | 235678 | ||||
| 415 (catalog ADS/Sa.CXO#obs/415) | 700087 | NGC 5273 | 0.96 | 2000 Sep 03 | 1.44 | ACIS-S | 235678 | ||||
| 2249 (catalog ADS/Sa.CXO#obs/2249) | 900076 | RXJ13434+0001 | 1.90 | 2001 Jan 08 | 9.53 | ACIS-S | 235678 | 14 | |||
| 2250 (catalog ADS/Sa.CXO#obs/2250) | 900077 | F864X:052 | 2.02 | 2001 Jan 08 | 8.74 | ACIS-S | 235678 | ||||
| 2251 (catalog ADS/Sa.CXO#obs/2251) | 900078 | F864X:012 | 1.93 | 2001 Jan 08 | 9.54 | ACIS-S | 235678 | 14 | |||
| 809 (catalog ADS/Sa.CXO#obs/809) | 700114 | MRK 273X | 1.09 | 2000 Apr 19 | 40.93 | ACIS-S | 012367 | Y | |||
| 507 (catalog ADS/Sa.CXO#obs/507) | 800015 | RX J1347-114 | 4.88 | 2000 Apr 29 | 9.90 | ACIS-S | 235678 | Y | |||
| 2229 (catalog ADS/Sa.CXO#obs/2229) | 800168 | RX J1350.0+6007 | 1.76 | 2001 Aug 29 | 54.86 | ACIS-I | 01236 | ||||
| 1588 (catalog ADS/Sa.CXO#obs/1588) | 700204 | 3C294 | 1.21 | 2000 Oct 29 | 19.02 | ACIS-S | 235678 | Y | |||
| 578 (catalog ADS/Sa.CXO#obs/578) | 890023 | 3C295 | 1.34 | 1999 Aug 30 | 15.80 | ACIS-S | 235678 | 7 | Y | ||
| 2254 (catalog ADS/Sa.CXO#obs/2254) | 900081 | 3C295 | 1.34 | 2001 May 18 | 87.48 | ACIS-I | 012367 | 7 | |||
| 930 (catalog ADS/Sa.CXO#obs/930) | 800106 | H1413+117 | 1.80 | 2000 Apr 19 | 24.09 | ACIS-S | 456789 | Y | |||
| 2024 (catalog ADS/Sa.CXO#obs/2024) | 600158 | RXJ1416.4+2315 | 1.91 | 2001 Sep 05 | 14.47 | ACIS-S | 235678 | ||||
| 541 (catalog ADS/Sa.CXO#obs/541) | 800049 | V1416+4446 | 1.24 | 1999 Dec 02 | 29.67 | ACIS-I | 01236 | Y | |||
| 1657 (catalog ADS/Sa.CXO#obs/1657) | 800125 | MACS J1423.8+2404 | 2.48 | 2001 Jun 01 | 18.23 | ACIS-I | 01236 | ||||
| 367 (catalog ADS/Sa.CXO#obs/367) | 700039 | Q1422+231 | 2.69 | 2000 Jun 01 | 26.75 | ACIS-S | 123678 | ||||
| 907 (catalog ADS/Sa.CXO#obs/907) | 800083 | QB 1429-008A,B | 3.54 | 2000 Mar 31 | 21.32 | ACIS-I | 01236 | Y | |||
| 2111 (catalog ADS/Sa.CXO#obs/2111) | 700301 | LBQS 1442-0011 | 3.69 | 2001 May 30 | 3.98 | ACIS-S | 235678 | ||||
| 2112 (catalog ADS/Sa.CXO#obs/2112) | 700302 | LBQS 1443+0141 | 3.47 | 2001 Mar 23 | 5.84 | ACIS-S | 235678 | ||||
| 939 (catalog ADS/Sa.CXO#obs/939) | 900011 | AX J1510+0742 | 2.45 | 2000 Jun 01 | 4.54 | ACIS-I | 012367 | ||||
| 800 (catalog ADS/Sa.CXO#obs/800) | 600103 | CB 58 | 1.35 | 2000 Jun 06 | 43.55 | ACIS-S | 235678 | ||||
| 800 (catalog ADS/Sa.CXO#obs/800) | 600103 | CB 58 | 1.35 | 2000 Jul 07 | 43.55 | ACIS-S | 235678 | ||||
| 2085 (catalog ADS/Sa.CXO#obs/2085) | 700275 | SDSSJ153259-003944 | 6.25 | 2001 Mar 26 | 4.99 | ACIS-S | 235678 | ||||
| 869 (catalog ADS/Sa.CXO#obs/869) | 700174 | ARP 220 | 4.28 | 2000 Jun 24 | 54.18 | ACIS-S | 235678 | Y | |||
| 822 (catalog ADS/Sa.CXO#obs/822) | 700127 | SBSG 1542+541 | 1.27 | 2000 Mar 22 | 4.05 | ACIS-S | 235678 | ||||
| 326 (catalog ADS/Sa.CXO#obs/326) | 800064 | 3C 324 | 4.30 | 2000 Jun 25 | 31.95 | ACIS-S | 235678 | Y | |||
| 981 (catalog ADS/Sa.CXO#obs/981) | 200088 | HD141569 | 9.59 | 2001 Jun 23 | 2.62 | ACIS-I | 012367 | ||||
| 2086 (catalog ADS/Sa.CXO#obs/2086) | 700276 | SDSS160501-011220 | 8.92 | 2001 Jun 24 | 4.54 | ACIS-S | 235678 | ||||
| 427 (catalog ADS/Sa.CXO#obs/427) | 700099 | CLASS 1608+656 | 2.68 | 2000 Jan 20 | 4.88 | ACIS-S | 01237 | ||||
| 2127 (catalog ADS/Sa.CXO#obs/2127) | 700317 | 3C330 | 2.83 | 2001 Oct 16 | 40.23 | ACIS-S | 235678 | ||||
| 2184 (catalog ADS/Sa.CXO#obs/2184) | 700374 | SDSS1621-0042 | 7.26 | 2001 Sep 05 | 1.27 | ACIS-S | 235678 | ||||
| 546 (catalog ADS/Sa.CXO#obs/546) | 800054 | MS 1621.5+2640 | 3.59 | 2000 Apr 24 | 29.57 | ACIS-I | 01236 | Y | |||
| 615 (catalog ADS/Sa.CXO#obs/615) | 200040 | VB 8 | 13.40 | 2000 Jul 10 | 8.54 | ACIS-S | 456789 | Y | |||
| 2221 (catalog ADS/Sa.CXO#obs/2221) | 800160 | 53W002 CLUSTER | 2.29 | 2001 Nov 01 | 35.97 | ACIS-S | 23678 | ||||
| 548 (catalog ADS/Sa.CXO#obs/548) | 800056 | RX J1716.9+6708 | 3.71 | 2000 Feb 27 | 50.35 | ACIS-I | 01236 | Y | |||
| 841 (catalog ADS/Sa.CXO#obs/841) | 700146 | 3C 371 | 4.84 | 2000 Mar 21 | 9.43 | ACIS-S | 456789 | Y | |||
| 1899 (catalog ADS/Sa.CXO#obs/1899) | 300047 | DQ HERCULIS | 3.63 | 2001 Jul 26 | 43.70 | ACIS-S | 235678 | 9 | |||
| 2503 (catalog ADS/Sa.CXO#obs/2503) | 300047 | DQ HERCULIS | 3.63 | 2001 Jul 29 | 20.90 | ACIS-S | 235678 | 9 | |||
| 830 (catalog ADS/Sa.CXO#obs/830) | 700135 | JET OF 3C 390.3 | 4.16 | 2000 Apr 17 | 22.71 | ACIS-S | 235678 | Y | |||
| 842 (catalog ADS/Sa.CXO#obs/842) | 700147 | PKS 2005-489 | 5.03 | 2000 Oct 07 | 5.17 | ACIS-I | 012367 | ||||
| 551 (catalog ADS/Sa.CXO#obs/551) | 800059 | MS 2053.7-0449 | 4.95 | 2000 May 13 | 42.34 | ACIS-I | 01236 | 6 | Y | ||
| 1667 (catalog ADS/Sa.CXO#obs/1667) | 800135 | MS 2053.7-0449 | 4.95 | 2001 Oct 07 | 43.23 | ACIS-I | 01236 | 6 | |||
| 2036 (catalog ADS/Sa.CXO#obs/2036) | 600170 | IRAS 20551-4250 | 3.82 | 2001 Oct 31 | 34.31 | ACIS-S | 235678 | ||||
| 1626 (catalog ADS/Sa.CXO#obs/1626) | 700242 | PKS 2135-14 | 4.65 | 2001 Oct 07 | 14.44 | ACIS-S | 235678 | ||||
| 928 (catalog ADS/Sa.CXO#obs/928) | 800104 | MS 2137.3-2353 | 3.57 | 1999 Nov 18 | 29.09 | ACIS-S | 23678 | Y | |||
| 1644 (catalog ADS/Sa.CXO#obs/1644) | 700260 | HE2149-2745 | 2.33 | 2000 Nov 18 | 9.18 | ACIS-S | 123678 | Y | |||
| 2113 (catalog ADS/Sa.CXO#obs/2113) | 700303 | LBQS 2154-2005 | 2.71 | 2001 Sep 04 | 3.91 | ACIS-S | 235678 | ||||
| 2114 (catalog ADS/Sa.CXO#obs/2114) | 700304 | LBQS 2201-1834 | 2.79 | 2001 Aug 03 | 4.98 | ACIS-S | 235678 | ||||
| 1479 (catalog ADS/Sa.CXO#obs/1479) | 980429 | LEONID ANTI-RADIANT | 2.49 | 1999 Nov 17 | 20.02 | ACIS-I | 01236 | Y | |||
| 2185 (catalog ADS/Sa.CXO#obs/2185) | 700375 | BRI 2212-1626 | 2.65 | 2001 Dec 16 | 2.73 | ACIS-S | 235678 | ||||
| 1694 (catalog ADS/Sa.CXO#obs/1694) | 900053 | PROTO CLUSTER | 4.61 | 2001 Jul 10 | 75.27 | ACIS-S | 235678 | ||||
| 789 (catalog ADS/Sa.CXO#obs/789) | 600092 | HCG 92 | 7.74 | 2000 Jul 09 | 19.60 | ACIS-S | 235678 | Y | |||
| 431 (catalog ADS/Sa.CXO#obs/431) | 700103 | EINSTEIN CROSS | 5.35 | 2000 Sep 06 | 21.89 | ACIS-S | 123678 | 5 | Y | ||
| 1632 (catalog ADS/Sa.CXO#obs/1632) | 700248 | 2237+0305 | 5.34 | 2001 Dec 08 | 8.06 | ACIS-S | 123678 | 5 | |||
| 918 (catalog ADS/Sa.CXO#obs/918) | 800094 | CL J2302.8+0844 | 5.05 | 2000 Aug 05 | 106.09 | ACIS-I | 012367 | Y | |||
| 861 (catalog ADS/Sa.CXO#obs/861) | 700166 | Q2345+007 | 3.81 | 2000 May 26 | 65.00 | ACIS-S | 123678 | Y | |||
| 861 (catalog ADS/Sa.CXO#obs/861) | 700166 | Q2345+007 | 3.81 | 2000 Jun 27 | 65.00 | ACIS-S | 123678 | Y | |||
| 2115 (catalog ADS/Sa.CXO#obs/2115) | 700305 | LBQS 2350-0045A | 3.47 | 2002 May 16 | 5.09 | ACIS-S | 235678 |
Note. — Col. (1): observational ID. Col. (2): sequence number. Col. (3): target name. Col. (4) and (5): the right ascension in units of hours, minutes, and seconds, and declination in units of degrees, arcminutes, and arcseconds of the aim point in J2000. Col. (6): the galactic extinction in units of from Stark et al. (1992). Col. (7): the date of observation. Col. (8): the net exposure time estimated after removing background flares within the aim pointed CCD chip. Col. (9): aim point detector type. Col. (10): used CCD chips (CCD ID=0-3 for ACIS-I and 4-9 for ACIS-S). Col. (11): multiple observation ID indicates overlapping fields, labeled with the same ID. Col. (12): 62 ChaMP fields included in Paper I are marked as Y.
| Band | Definition |
|---|---|
| Broad (B) | keV |
| Soft (S) | keV |
| Hard (H) | keV |
| Soft1 (S1) | keV |
| Soft2 (S2) | keV |
| Conventional Broad (Bc) | keV |
| Conventional Soft (Sc) | keV |
| Conventional Hard (Hc) | keV |
| Hardness Ratio | (HcSc)(HcSc) |
| X-ray Color | (S2)(S1)=(S1/S2) |
| X-ray Color | (H)(S2)=(S2/H) |
| Obs. | CCD | ||||||||||||||||||
|---|---|---|---|---|---|---|---|---|---|---|---|---|---|---|---|---|---|---|---|
| ID | ID | B | S | H | Bc | Sc | Hc | B | S | H | Bc | Sc | Hc | B | S | H | Bc | Sc | Hc |
| (1) | (2) | (3) | (4) | (5) | (6) | (7) | (8) | (9) | (10) | (11) | (12) | (13) | (14) | (15) | (16) | (17) | (18) | (19) | (20) |
| 135 | 2 | 130.25 | 64.24 | 289.26 | 128.03 | 50.19 | 262.14 | 117.76 | 65.36 | 277.79 | 114.15 | 50.74 | 250.33 | 104.04 | 68.04 | 262.06 | 97.53 | 51.74 | 234.34 |
| 135 | 3 | 131.44 | 65.01 | 289.92 | 129.12 | 50.77 | 263.01 | 118.98 | 66.21 | 278.41 | 115.23 | 51.36 | 251.20 | 105.31 | 69.03 | 262.70 | 98.60 | 52.44 | 235.21 |
| 135 | 5 | 103.05 | 44.69 | 341.86 | 108.74 | 37.58 | 289.69 | 87.98 | 43.67 | 324.75 | 93.20 | 37.10 | 272.63 | 71.00 | 42.50 | 301.68 | 75.06 | 36.43 | 249.91 |
| 135 | 6 | 115.00 | 56.38 | 259.13 | 113.61 | 44.20 | 235.68 | 103.57 | 57.09 | 249.59 | 101.04 | 44.53 | 225.69 | 90.79 | 58.94 | 236.46 | 85.88 | 45.16 | 212.07 |
| 135 | 7 | 85.12 | 38.20 | 248.29 | 89.43 | 32.10 | 217.62 | 73.37 | 37.40 | 237.38 | 77.30 | 31.73 | 206.28 | 59.93 | 36.52 | 222.43 | 62.89 | 31.19 | 190.93 |
| 325 | 2 | 135.69 | 65.77 | 314.52 | 133.17 | 51.72 | 277.16 | 122.42 | 67.05 | 301.06 | 118.41 | 52.31 | 263.12 | 107.98 | 70.02 | 282.68 | 100.88 | 53.40 | 244.09 |
| 325 | 3 | 136.58 | 66.61 | 311.79 | 133.90 | 52.20 | 276.84 | 123.44 | 67.96 | 298.62 | 119.24 | 52.85 | 263.16 | 109.16 | 71.07 | 280.62 | 101.81 | 54.01 | 244.65 |
| 325 | 6 | 116.57 | 56.64 | 268.51 | 114.83 | 44.43 | 240.60 | 104.94 | 57.48 | 258.07 | 102.01 | 44.81 | 229.59 | 92.06 | 59.55 | 243.72 | 86.62 | 45.50 | 214.58 |
| 325 | 7 | 87.06 | 39.22 | 250.62 | 90.66 | 32.64 | 219.17 | 75.33 | 38.53 | 240.01 | 78.57 | 32.33 | 208.12 | 61.90 | 37.82 | 225.51 | 64.19 | 31.90 | 193.17 |
| 326 | 2 | 141.37 | 72.20 | 289.98 | 137.55 | 56.19 | 263.37 | 129.48 | 74.21 | 278.53 | 123.88 | 57.19 | 251.61 | 116.84 | 78.56 | 262.84 | 107.52 | 58.94 | 235.67 |
| 326 | 3 | 142.52 | 72.95 | 290.89 | 138.63 | 56.76 | 264.47 | 130.64 | 75.04 | 279.41 | 124.94 | 57.80 | 252.67 | 118.06 | 79.53 | 263.69 | 108.58 | 59.64 | 236.72 |
| 326 | 5 | 120.60 | 54.50 | 343.34 | 121.62 | 43.95 | 291.69 | 105.60 | 54.40 | 326.20 | 105.76 | 43.84 | 274.61 | 88.81 | 54.81 | 303.08 | 87.11 | 43.74 | 251.86 |
| 326 | 6 | 123.48 | 62.82 | 255.43 | 120.47 | 48.92 | 232.80 | 112.81 | 64.33 | 246.06 | 108.31 | 49.65 | 223.00 | 101.26 | 67.67 | 233.17 | 93.65 | 50.94 | 209.66 |
| 326 | 7 | 98.82 | 46.35 | 250.47 | 99.86 | 37.54 | 220.71 | 87.34 | 46.35 | 239.60 | 87.68 | 37.54 | 209.47 | 74.35 | 46.85 | 224.73 | 73.11 | 37.58 | 194.26 |
| 342 | 2 | 134.75 | 67.44 | 289.09 | 131.78 | 52.54 | 262.23 | 122.53 | 68.93 | 277.65 | 118.00 | 53.27 | 250.46 | 109.28 | 72.31 | 261.99 | 101.50 | 54.58 | 234.53 |
| 342 | 3 | 135.96 | 68.20 | 290.14 | 132.89 | 53.11 | 263.41 | 123.75 | 69.77 | 278.65 | 119.10 | 53.89 | 251.61 | 110.55 | 73.29 | 262.93 | 102.58 | 55.28 | 235.66 |
| 342 | 5 | 110.56 | 48.78 | 342.63 | 114.09 | 40.15 | 290.59 | 95.47 | 48.13 | 325.50 | 98.40 | 39.82 | 273.51 | 78.48 | 47.57 | 302.36 | 80.02 | 39.38 | 250.76 |
| 342 | 6 | 117.31 | 58.39 | 254.84 | 115.17 | 45.59 | 231.94 | 106.32 | 59.43 | 245.47 | 102.90 | 46.08 | 222.13 | 94.18 | 61.88 | 232.56 | 88.10 | 46.96 | 208.77 |
| 342 | 7 | 91.03 | 41.60 | 249.81 | 93.99 | 34.36 | 219.79 | 79.37 | 41.14 | 238.95 | 81.85 | 34.16 | 208.54 | 66.07 | 40.82 | 224.08 | 67.39 | 33.91 | 193.32 |
| 346 | 2 | 142.39 | 70.28 | 315.57 | 138.98 | 55.17 | 278.54 | 129.36 | 72.03 | 302.11 | 124.25 | 56.01 | 264.48 | 115.39 | 75.89 | 283.72 | 106.75 | 57.50 | 245.45 |
| 346 | 3 | 143.17 | 71.10 | 312.78 | 139.63 | 55.64 | 278.13 | 130.28 | 72.92 | 299.59 | 125.01 | 56.53 | 264.46 | 116.49 | 76.92 | 281.59 | 107.63 | 58.10 | 245.94 |
| 346 | 6 | 122.63 | 60.78 | 269.13 | 120.00 | 47.52 | 241.52 | 111.24 | 62.04 | 258.69 | 107.23 | 48.11 | 230.52 | 98.83 | 64.91 | 244.37 | 91.90 | 49.16 | 215.55 |
| 346 | 7 | 94.67 | 43.72 | 251.38 | 96.25 | 35.56 | 220.19 | 83.06 | 43.46 | 240.76 | 84.06 | 35.41 | 209.12 | 69.83 | 43.46 | 226.25 | 69.51 | 35.23 | 194.16 |
| 363 | 1 | 171.64 | 85.40 | 373.31 | 167.13 | 66.33 | 335.14 | 156.41 | 87.78 | 356.94 | 149.76 | 67.53 | 318.67 | 140.29 | 92.93 | 334.70 | 129.20 | 69.63 | 296.58 |
| 363 | 2 | 140.46 | 71.54 | 289.81 | 136.75 | 55.67 | 263.18 | 128.52 | 73.48 | 278.36 | 123.06 | 56.63 | 251.40 | 115.80 | 77.69 | 262.70 | 106.68 | 58.33 | 235.49 |
| 363 | 3 | 141.64 | 72.30 | 290.84 | 137.85 | 56.25 | 264.36 | 129.71 | 74.31 | 279.35 | 124.14 | 57.26 | 252.55 | 117.04 | 78.66 | 263.62 | 107.75 | 59.03 | 236.59 |
| 363 | 6 | 122.66 | 62.21 | 255.43 | 119.76 | 48.45 | 232.76 | 111.94 | 63.65 | 246.06 | 107.58 | 49.15 | 222.95 | 100.30 | 66.87 | 233.17 | 92.89 | 50.38 | 209.60 |
| 363 | 7 | 97.79 | 45.71 | 250.42 | 99.07 | 37.10 | 220.62 | 86.29 | 45.65 | 239.55 | 86.89 | 37.07 | 209.38 | 73.24 | 46.03 | 224.68 | 72.33 | 37.07 | 194.16 |
| 367 | 1 | 160.01 | 77.47 | 372.08 | 157.13 | 60.37 | 333.43 | 144.28 | 78.97 | 355.71 | 139.66 | 61.12 | 316.96 | 127.18 | 82.44 | 333.48 | 118.95 | 62.46 | 294.88 |
| 367 | 2 | 131.06 | 64.83 | 289.04 | 128.71 | 50.63 | 262.02 | 118.62 | 66.01 | 277.59 | 114.86 | 51.21 | 250.23 | 104.97 | 68.81 | 261.90 | 98.25 | 52.26 | 234.29 |
Note. — Col. (1): observation ID. Col. (2): CCD ID. Col. (3) - Col. (8): energy conversion factors in units of assumimg a photon index of in the B, S, H, Bc, Sc, and Hc bands, respectively. Col. (9) - Col. (14): energy conversion factors in units of assuming a photon index in the B, S, H, Bc, Sc, and Hc bands, respectively. Col. (15) - Col. (20): energy conversion factors in units of assuming a photon index of in the B, S, H, Bc, Sc, and Hc bands, respectively. The complete version of this table is in the electronic edition of the . The printed edition contains only a sample.
| Flag | Definition |
|---|---|
| 1n | False X-ray Sources |
| 11 | False source due to a hot pixel or by a bad bias value |
| 12 | False source due to a bad column |
| 13 | False source along the readout direction of a very strong source |
| 14 | False source due to the FEP 0/3 problem |
| 15 | Double sources detected due to the PSF effect |
| 2n | It is not certain whether it is a valid X-ray source |
| 21 | V&Ver found it might be a spurious source |
| 3n | Source properties may be subject to a large uncertainty |
| 31 | Bad pixel/column exists within source extraction radius |
| 37 | Pile-up (see POG 2004) |
| 38 | Uncertain source position by flag=015 |
| 5n | Other cases |
| 51 | Source is extended |
| 52 | Same source candidate in multiple observations |
| 53 | Target of observation |
| 54 | X-ray jet |
| 55 | Variable source (see Paper I) |
| 6n | Flagged by the automatic pipeline |
| 61 | Source region falls near the edge of the chip |
| 62 | Small portion of source region overlaps with nearby point source |
| 63 | Large portion of source region overlaps with nearby point source |
| 64 | Small portion of source region overlaps with nearby extended source |
| 65 | Large portion of source region overlaps with nearby extended source |
| 66 | Background region overlaps with a nearby point source |
| 67 | Background region overlaps with a nearby extended source |
| 68 | Source region falls inside the extended source |
| Obs. | CCD | Source | R.A. | Decl. | PU | Radius | Exposure | |||
|---|---|---|---|---|---|---|---|---|---|---|
| Source Name | ID | ID | No. | (deg) | (deg) | (arcsec) | (arcmin) | (arcsec) | (ksec) | Flag |
| (1) | (2) | (3) | (4) | (5) | (6) | (7) | (8) | (9) | (10) | (11) |
| CXOMP J001709.7+162604 | 520 | 6 | 1 | 4.290515 | 16.434570 | 60: | 20.28 | 40.00 | 51.72 | 66 |
| CXOMP J001716.0+162722 | 520 | 6 | 4 | 4.316865 | 16.456352 | 60: | 18.56 | 40.00 | 53.94 | 66 |
| CXOMP J001739.7+162330 | 520 | 6 | 2 | 4.415671 | 16.391680 | 3.12 | 14.28 | 27.02 | 59.54 | |
| CXOMP J001743.5+163144 | 520 | 2 | 24 | 4.431394 | 16.528941 | 7.21 | 11.90 | 18.98 | 48.00 | |
| CXOMP J001756.6+163006 | 520 | 2 | 23 | 4.486132 | 16.501804 | 2.44 | 8.63 | 10.69 | 55.58 | |
| CXOMP J001758.4+162647 | 520 | 2 | 21 | 4.493674 | 16.446530 | 2.79 | 8.82 | 11.11 | 58.17 | 55 |
| CXOMP J001758.9+163119 | 520 | 2 | 20 | 4.495359 | 16.521831 | 1.79 | 8.20 | 9.75 | 58.94 | 66 |
| CXOMP J001801.0+163139 | 520 | 2 | 19 | 4.504432 | 16.527670 | 2.14 | 7.75 | 8.77 | 54.89 | 66 |
| CXOMP J001801.4+163237 | 520 | 2 | 18 | 4.506178 | 16.543632 | 2.59 | 7.90 | 9.12 | 59.10 | |
| CXOMP J001801.7+163426 | 520 | 2 | 17 | 4.507101 | 16.573669 | 1.69 | 8.61 | 10.65 | 58.61 | |
| CXOMP J001803.4+162751 | 520 | 2 | 12 | 4.514173 | 16.464428 | 2.34 | 7.35 | 8.01 | 57.29 | |
| CXOMP J001805.7+162852 | 520 | 2 | 22 | 4.523928 | 16.481311 | 1.96 | 6.56 | 6.76 | 60.74 | 55 |
| CXOMP J001805.9+163038 | 520 | 2 | 16 | 4.524780 | 16.510817 | 2.17 | 6.43 | 6.56 | 58.35 | |
| CXOMP J001806.7+162517 | 520 | 3 | 15 | 4.528315 | 16.421658 | 3.36 | 7.82 | 8.93 | 51.74 | 66 |
| CXOMP J001807.2+163551 | 520 | 2 | 15 | 4.530068 | 16.597307 | 2.19 | 8.41 | 10.21 | 58.89 | |
| CXOMP J001807.9+163120 | 520 | 2 | 5 | 4.532916 | 16.522052 | 0.80 | 6.07 | 5.99 | 61.20 | |
| CXOMP J001808.5+163231 | 520 | 2 | 4 | 4.535611 | 16.541869 | 0.94 | 6.28 | 6.32 | 61.51 | 66 |
| CXOMP J001809.3+162532 | 520 | 3 | 10 | 4.538662 | 16.425403 | 1.16 | 7.21 | 7.78 | 54.48 | 66 |
| CXOMP J001809.8+162556 | 520 | 3 | 14 | 4.540869 | 16.432422 | 1.98 | 6.85 | 7.22 | 44.87 | 66 |
| CXOMP J001810.0+163208 | 520 | 2 | 11 | 4.541983 | 16.535624 | 1.51 | 5.80 | 5.57 | 62.13 | 66 |
| CXOMP J001810.2+162942 | 520 | 2 | 10 | 4.542706 | 16.494819 | 1.37 | 5.39 | 4.91 | 62.60 | |
| CXOMP J001810.2+163223 | 520 | 2 | 3 | 4.542568 | 16.539805 | 0.44 | 5.87 | 5.67 | 61.15 | 66 |
| CXOMP J001812.4+162713 | 520 | 2 | 9 | 4.551720 | 16.453788 | 1.60 | 5.62 | 5.27 | 62.26 | |
| CXOMP J001817.6+163107 | 520 | 2 | 2 | 4.573363 | 16.518440 | 0.75 | 3.76 | 3.18 | 64.71 | |
| CXOMP J001818.0+163316 | 520 | 2 | 8 | 4.575189 | 16.554260 | 0.85 | 4.75 | 4.07 | 62.00 | |
| CXOMP J001818.8+163748 | 520 | 0 | 30 | 4.578632 | 16.630076 | 3.25 | 8.43 | 10.25 | 56.52 | 66 |
| CXOMP J001820.0+162931 | 520 | 2 | 14 | 4.583690 | 16.491973 | 2.74 | 3.06 | 3.00 | 62.63 | |
| CXOMP J001820.7+162315 | 520 | 3 | 13 | 4.586617 | 16.387553 | 2.74 | 7.37 | 8.04 | 54.98 | |
| CXOMP J001821.2+163238 | 520 | 2 | 13 | 4.588713 | 16.544022 | 1.80 | 3.76 | 3.18 | 34.15 | |
| CXOMP J001821.7+161941 | 520 | 3 | 9 | 4.590651 | 16.327982 | 1.52 | 10.70 | 15.62 | 51.46 | |
| CXOMP J001822.1+162926 | 520 | 2 | 7 | 4.592218 | 16.490700 | 1.14 | 2.60 | 3.00 | 66.04 |
Note. — Col. (1): ChaMP source name given by right ascension in units of hours, minutes, and seconds, and declination in units of degrees, arcminutes, and arcseconds in J2000. Col. (2): observation ID. Col. (3): CCD ID (0-3 for ACIS-I and 4-9 for ACIS-S observation). Col. (4): source number assigned by as marked in the public X-ray image of the ChaMP web site (http://hea-www.harvard.edu/CHAMP). Col. (5) and (6): right ascension and declination in units of degrees after refinement and aspect correction. Col. (7): positional uncertainty in units of arcseconds estimated by the confidence level of the empirical formula (see equation (12) in §4.2). Col. (8): off axis angle from the aim point of the observation in units of arcminutes. Col. (9): source extraction radius in units of arcseconds (The encircled energy radius at 1.5 keV. See §3.2.1). Col. (10): mean effective exposure time in units of ksec after vignetting correction (see §3.2.4). Col. (11): source flag (see Table 4). The complete version of this table is in the electronic edition of the . The printed edition contains only a sample.
| Obs. | CCD | Source | R.A. | Decl. | PU | Radius | Exposure | |||
|---|---|---|---|---|---|---|---|---|---|---|
| Source Name | ID | ID | No. | (deg) | (deg) | (arcsec) | (arcmin) | (arcsec) | (ksec) | Flag |
| (1) | (2) | (3) | (4) | (5) | (6) | (7) | (8) | (9) | (10) | (11) |
| CXOMP J005618.9-272429 | 2242 | 3 | 4 | 14.079076 | -27.408259 | 15.58 | 13.24 | 23.32 | 8.60 | 66 |
| CXOMP J005622.4-272223 | 2242 | 3 | 2 | 14.093514 | -27.373174 | 6.50 | 12.31 | 20.13 | 8.33 | |
| CXOMP J005622.8-272746 | 2242 | 3 | 3 | 14.095076 | -27.462953 | 13.97 | 13.35 | 23.71 | 8.35 | |
| CXOMP J005630.6-273141 | 2242 | 2 | 4 | 14.127555 | -27.528123 | 12.27 | 14.01 | 26.06 | 9.67 | 66 |
| CXOMP J005633.8-272954 | 2242 | 2 | 2 | 14.140895 | -27.498360 | 5.52 | 12.33 | 20.18 | 10.15 | 66 |
| CXOMP J005644.3-274936 | 2243 | 3 | 5 | 14.184665 | -27.826692 | 18.16 | 11.18 | 16.97 | 8.13 | |
| CXOMP J005645.6-272444 | 2242 | 3 | 1 | 14.190344 | -27.412292 | 3.66 | 7.52 | 8.29 | 9.59 | |
| CXOMP J005645.9-275522 | 2243 | 3 | 4 | 14.191467 | -27.922784 | 8.72 | 14.68 | 28.46 | 7.53 | |
| CXOMP J005649.8-273319 | 2242 | 2 | 3 | 14.207559 | -27.555305 | 11.77 | 12.57 | 20.92 | 9.28 | |
| CXOMP J005651.7-272856 | 2242 | 2 | 1 | 14.215693 | -27.482293 | 2.70 | 8.74 | 10.92 | 10.86 | |
| CXOMP J005654.5-275116 | 2243 | 3 | 3 | 14.227221 | -27.854715 | 8.08 | 10.39 | 14.74 | 8.23 | |
| CXOMP J005657.0-274025 | 2244 | 3 | 1 | 14.237721 | -27.673876 | 4.54 | 11.58 | 18.08 | 8.04 | |
| CXOMP J005659.0-274913 | 2243 | 3 | 2 | 14.246074 | -27.820540 | 6.08 | 8.27 | 9.92 | 8.59 | |
| CXOMP J005659.3-272251 | 2242 | 7 | 6 | 14.247296 | -27.381031 | 1.82 | 4.14 | 3.52 | 6.14 | |
| CXOMP J005701.0-272334 | 2242 | 7 | 5 | 14.254508 | -27.393036 | 2.27 | 3.91 | 3.31 | 6.11 | |
| CXOMP J005701.4-274344 | 2243 | 7 | 6 | 14.256135 | -27.729051 | 3.35 | 5.91 | 5.74 | 7.97 | |
| CXOMP J005704.7-280145 | 2246 | 2 | 3 | 14.269942 | -28.029192 | 60: | 14.83 | 29.00 | 7.58 | |
| CXOMP J005705.3-274554 | 2243 | 7 | 7 | 14.272302 | -27.765143 | 3.78 | 5.38 | 4.90 | 5.83 | |
| CXOMP J005710.1-274952 | 2246 | 3 | 2 | 14.292476 | -27.831169 | 6.09 | 12.02 | 19.31 | 8.42 | |
| CXOMP J005710.2-274954 | 2243 | 3 | 1 | 14.292750 | -27.831766 | 2.15 | 7.08 | 7.58 | 8.20 | 52 |
| CXOMP J005712.9-272650 | 2242 | 6 | 15 | 14.303934 | -27.447320 | 2.70 | 4.58 | 3.91 | 10.66 | |
| CXOMP J005714.0-272536 | 2242 | 6 | 4 | 14.308480 | -27.426900 | 2.22 | 3.33 | 3.00 | 10.88 | |
| CXOMP J005714.9-271851 | 2242 | 7 | 4 | 14.312284 | -27.314413 | 1.20 | 3.59 | 3.02 | 6.57 | |
| CXOMP J005715.3-271735 | 2242 | 7 | 7 | 14.313933 | -27.293127 | 2.20 | 4.84 | 4.15 | 6.10 | |
| CXOMP J005716.6-273230 | 2244 | 7 | 11 | 14.319131 | -27.541602 | 1.18 | 5.03 | 4.35 | 6.47 | |
| CXOMP J005716.8-272128 | 2242 | 7 | 1 | 14.320197 | -27.357975 | 0.41 | 0.95 | 3.00 | 6.35 | 53 |
| CXOMP J005717.3-274236 | 2243 | 7 | 5 | 14.322400 | -27.710021 | 0.61 | 2.78 | 3.00 | 8.42 | |
| CXOMP J005717.5-272617 | 2242 | 6 | 7 | 14.322936 | -27.438214 | 1.42 | 3.90 | 3.30 | 10.74 | |
| CXOMP J005717.9-271830 | 2242 | 7 | 3 | 14.324672 | -27.308354 | 1.16 | 3.90 | 3.30 | 6.55 | 55 |
| CXOMP J005719.7-272035 | 2242 | 7 | 2 | 14.332301 | -27.343318 | 1.29 | 1.85 | 3.00 | 6.35 | |
| CXOMP J005720.5-274452 | 2243 | 7 | 4 | 14.335529 | -27.747964 | 0.73 | 1.89 | 3.00 | 8.41 |
Note. — Col. (1): ChaMP source name given by right ascension in units of hours, minutes, and seconds, and declination in units of degrees, arcminutes, and arcseconds in J2000. Col. (2): observation ID. Col. (3): CCD ID (0-3 for ACIS-I and 4-9 for ACIS-S observation). Col. (4): source number assigned by as marked in the public X-ray image of the ChaMP web site (http://hea-www.harvard.edu/CHAMP). Col. (5) and (6): right ascension and declination in units of degrees after refinement and aspect correction. Col. (7): positional uncertainty in units of arcseconds estimated by the confidence level of the empirical formula (see equation (12) in §4.2). Col. (8): off axis angle from the aim point of the observation in units of arcminutes. Col. (9): source extraction radius in units of arcseconds (The 95% energy encircled radius at 1.5 keV. See §3.2.1). Col. (10): mean effective exposure time in units of ksec after vignetting correction (see §3.2.4). Col. (11): source flag (see Table 4). The complete version of this table is in the electronic edition of the . The printed edition contains only a sample.
| Multi | Obs. | CCD | Source | Obs. | PU | ||||
|---|---|---|---|---|---|---|---|---|---|
| Source Name | ID | ID | ID | No. | Date | netB | rateB | (arcmin) | (arcsec) |
| (1) | (2) | (3) | (4) | (5) | (6) | (7) | (8) | (9) | (10) |
| CXOMP J025656.1-331757 | 1 | 135 | 6 | 1 | Feb 15 2000 | ||||
| CXOMP J025656.1-331756 | 1 | 815 | 6 | 2 | Jan 2 2000 | ||||
| CXOMP J025655.6-332109 | 2 | 135 | 6 | 2 | Feb 15 2000 | ||||
| CXOMP J025655.9-332106 | 2 | 815 | 6 | 4 | Jan 2 2000 | ||||
| CXOMP J025647.8-331524 | 3 | 135 | 7 | 1 | Feb 15 2000 | ||||
| CXOMP J025647.8-331524 | 3 | 815 | 7 | 1 | Jan 2 2000 | ||||
| CXOMP J025642.6-331521 | 4 | 135 | 7 | 2 | Feb 15 2000 | ||||
| CXOMP J025642.5-331520 | 4 | 815 | 7 | 2 | Jan 2 2000 | ||||
| CXOMP J025639.1-331503 | 5 | 135 | 7 | 3 | Feb 15 2000 | ||||
| CXOMP J025639.1-331502 | 5 | 815 | 7 | 3 | Jan 2 2000 | ||||
| CXOMP J111812.0+074030 | 6 | 363 | 6 | 2 | Jun 2 2000 | ||||
| CXOMP J111812.1+074031 | 6 | 1630 | 7 | 17 | Nov 3 2000 | ||||
| CXOMP J111802.3+074325 | 7 | 363 | 6 | 5 | Jun 2 2000 | ||||
| CXOMP J111802.3+074325 | 7 | 1630 | 7 | 21 | Nov 3 2000 | ||||
| CXOMP J111759.2+074405 | 8 | 363 | 6 | 6 | Jun 2 2000 | ||||
| CXOMP J111759.2+074405 | 8 | 1630 | 7 | 22 | Nov 3 2000 | ||||
| CXOMP J111806.3+074053 | 9 | 363 | 6 | 10 | Jun 2 2000 | ||||
| CXOMP J111806.2+074056 | 9 | 1630 | 7 | 25 | Nov 3 2000 | ||||
| CXOMP J111804.2+074324 | 10 | 363 | 6 | 11 | Jun 2 2000 | ||||
| CXOMP J111804.2+074324 | 10 | 1630 | 7 | 27 | Nov 3 2000 | ||||
| CXOMP J111758.6+074310 | 11 | 363 | 6 | 12 | Jun 2 2000 | ||||
| CXOMP J111758.6+074311 | 11 | 1630 | 7 | 23 | Nov 3 2000 | ||||
| CXOMP J111822.2+074448 | 12 | 363 | 7 | 1 | Jun 2 2000 | ||||
| CXOMP J111822.2+074448 | 12 | 1630 | 7 | 1 | Nov 3 2000 | ||||
| CXOMP J111816.9+074558 | 13 | 363 | 7 | 2 | Jun 2 2000 | ||||
| CXOMP J111816.9+074558 | 13 | 1630 | 7 | 2 | Nov 3 2000 | ||||
| CXOMP J111816.8+074600 | 14 | 363 | 7 | 3 | Jun 2 2000 | ||||
| CXOMP J111816.8+074600 | 14 | 1630 | 7 | 3 | Nov 3 2000 | ||||
| CXOMP J111816.1+074315 | 15 | 363 | 7 | 5 | Jun 2 2000 | ||||
| CXOMP J111816.2+074315 | 15 | 1630 | 7 | 6 | Nov 3 2000 |
Note. — Col. (1): ChaMP source name given by right ascension in units of hours, minutes, and seconds, and. declination in units of degrees, arcminutes, and arcseconds in J2000. Col. (2): multiple observation ID indicates the same source candidate in overlapping fields, labeled with the same ID. Col. (3): observation ID. Col. (4): CCD ID (0-3 for ACIS-I and 4-9 for ACIS-S). Col. (5): source number assigned by as marked in the public X-ray images of the ChaMP web site (http://hea-www.harvard.edu/CHAMP). Col. (6): date of observation. Col. (7): net counts in the 0.3-8 keV band and errors. Col. (8): count rates in the 0.3-8 keV band and errors. Col. (9): off axis angle from the aim point of the observation in units of arcminutes. Col. (10): positional uncertainty in units of arcseconds estimated by the confidence level of the empirical formula (see equation (12) in §4.2). The errors in net counts are given following Gehrels statistics (Gehrels, 1986). The complete version of this table is in the electronic edition of the . The printed edition contains only a sample.
| Source Name | B | S1 | S2 | S | H | Bc | Sc | Hc |
|---|---|---|---|---|---|---|---|---|
| (1) | (2) | (3) | (4) | (5) | (6) | (7) | (8) | (9) |
| CXOMP J001709.7+162604 | —– | —– | ||||||
| CXOMP J001716.0+162722 | ||||||||
| CXOMP J001739.7+162330 | ||||||||
| CXOMP J001743.5+163144 | —– | |||||||
| CXOMP J001756.6+163006 | ||||||||
| CXOMP J001758.4+162647 | ||||||||
| CXOMP J001758.9+163119 | ||||||||
| CXOMP J001801.0+163139 | ||||||||
| CXOMP J001801.4+163237 | —– | |||||||
| CXOMP J001801.7+163426 | ||||||||
| CXOMP J001803.4+162751 | ||||||||
| CXOMP J001805.7+162852 | ||||||||
| CXOMP J001805.9+163038 | ||||||||
| CXOMP J001806.7+162517 | ||||||||
| CXOMP J001807.2+163551 | ||||||||
| CXOMP J001807.9+163120 | ||||||||
| CXOMP J001808.5+163231 | ||||||||
| CXOMP J001809.3+162532 | ||||||||
| CXOMP J001809.8+162556 | ||||||||
| CXOMP J001810.0+163208 | ||||||||
| CXOMP J001810.2+162942 | ||||||||
| CXOMP J001810.2+163223 | ||||||||
| CXOMP J001812.4+162713 | ||||||||
| CXOMP J001817.6+163107 | ||||||||
| CXOMP J001818.0+163316 | ||||||||
| CXOMP J001818.8+163748 | ||||||||
| CXOMP J001820.0+162931 | ||||||||
| CXOMP J001820.7+162315 | ||||||||
| CXOMP J001821.2+163238 | —– | |||||||
| CXOMP J001821.7+161941 |
Note. — Col. (1): ChaMP source name given by right ascension in units of hours, minutes, and seconds, and declination in units of degrees, arcminutes, and arcseconds in J2000. Col. (2): net counts and errors in the B ( keV) band. Col. (3): net counts and errors in the S1 ( keV) band. Col. (4): net counts and errors in the S2 ( keV) band. Col. (5): net counts and errors in the S ( keV) band. Col. (6): net counts and errors in the H ( keV) band. Col. (7): net counts and errors in the Bc ( keV) band. Col. (8): net counts and errors in the Sc ( keV) band. Col. (9): net counts and errors in the Hc ( keV) band. For detail information about the X-ray photometry, see §3.2. The errors of the net counts are given by following Gehrels statistics (Gehrels, 1986). The net counts which are not determined are marked as . The complete version of this table is in the electronic edition of the . The printed edition contains only a sample.
| Source Name | B | S1 | S2 | S | H | Bc | Sc | Hc |
|---|---|---|---|---|---|---|---|---|
| (1) | (2) | (3) | (4) | (5) | (6) | (7) | (8) | (9) |
| CXOMP J005618.9-272429 | ||||||||
| CXOMP J005622.4-272223 | ||||||||
| CXOMP J005622.8-272746 | ||||||||
| CXOMP J005630.6-273141 | ||||||||
| CXOMP J005633.8-272954 | ||||||||
| CXOMP J005644.3-274936 | ||||||||
| CXOMP J005645.6-272444 | ||||||||
| CXOMP J005645.9-275522 | ||||||||
| CXOMP J005649.8-273319 | ||||||||
| CXOMP J005651.7-272856 | ||||||||
| CXOMP J005654.5-275116 | ||||||||
| CXOMP J005657.0-274025 | ||||||||
| CXOMP J005659.0-274913 | ||||||||
| CXOMP J005659.3-272251 | ||||||||
| CXOMP J005701.0-272334 | —– | |||||||
| CXOMP J005701.4-274344 | —– | —– | —– | |||||
| CXOMP J005704.7-280145 | ||||||||
| CXOMP J005705.3-274554 | ||||||||
| CXOMP J005710.1-274952 | —– | |||||||
| CXOMP J005710.2-274954 | ||||||||
| CXOMP J005712.9-272650 | —– | |||||||
| CXOMP J005714.0-272536 | —– | |||||||
| CXOMP J005714.9-271851 | ||||||||
| CXOMP J005715.3-271735 | ||||||||
| CXOMP J005716.6-273230 | ||||||||
| CXOMP J005716.8-272128 | ||||||||
| CXOMP J005717.3-274236 | ||||||||
| CXOMP J005717.5-272617 | ||||||||
| CXOMP J005717.9-271830 | ||||||||
| CXOMP J005719.7-272035 |
Note. — Col. (1): ChaMP source name given by right ascension in units of hours, minutes, and seconds, and declination in units of degrees, arcminutes, and arcseconds in J2000. Col. (2): net counts and errors in the B ( keV) band. Col. (3): net counts and errors in the S1 ( keV) band. Col. (4): net counts and errors in the S2 ( keV) band. Col. (5): net counts and errors in the S ( keV) band. Col. (6): net counts and errors in the H ( keV) band. Col. (7): net counts and errors in the Bc ( keV) band. Col. (8): net counts and errors in the Sc ( keV) band. Col. (9): net counts and errors in the Hc ( keV) band. For detail information about the X-ray photometry, see §3.2. The errors of the net counts are given by following Gehrels statistics (Gehrels, 1986). The net counts which are not determined are marked as . The complete version of this table is in the electronic edition of the . The printed edition contains only a sample.
| Source Name | HR_l68 | HR_mean | HR_u68 | C21_l68 | C21_mode | C21_u68 | C32_l68 | C32_mode | C32_u68 |
|---|---|---|---|---|---|---|---|---|---|
| (1) | (2) | (3) | (4) | (5) | (6) | (7) | (8) | (9) | (10) |
| CXOMP J001709.7+162604 | |||||||||
| CXOMP J001716.0+162722 | |||||||||
| CXOMP J001739.7+162330 | |||||||||
| CXOMP J001743.5+163144 | |||||||||
| CXOMP J001756.6+163006 | |||||||||
| CXOMP J001758.4+162647 | |||||||||
| CXOMP J001758.9+163119 | |||||||||
| CXOMP J001801.0+163139 | |||||||||
| CXOMP J001801.4+163237 | |||||||||
| CXOMP J001801.7+163426 | |||||||||
| CXOMP J001803.4+162751 | |||||||||
| CXOMP J001805.7+162852 | |||||||||
| CXOMP J001805.9+163038 | |||||||||
| CXOMP J001806.7+162517 | |||||||||
| CXOMP J001807.2+163551 | |||||||||
| CXOMP J001807.9+163120 | |||||||||
| CXOMP J001808.5+163231 | |||||||||
| CXOMP J001809.3+162532 | |||||||||
| CXOMP J001809.8+162556 | |||||||||
| CXOMP J001810.0+163208 | |||||||||
| CXOMP J001810.2+162942 | |||||||||
| CXOMP J001810.2+163223 | |||||||||
| CXOMP J001812.4+162713 | |||||||||
| CXOMP J001817.6+163107 | |||||||||
| CXOMP J001818.0+163316 | |||||||||
| CXOMP J001818.8+163748 | |||||||||
| CXOMP J001820.0+162931 | |||||||||
| CXOMP J001820.7+162315 | |||||||||
| CXOMP J001821.2+163238 | |||||||||
| CXOMP J001821.7+161941 |
Note. — Col. (1): ChaMP source name given by right ascension in units of hours, minutes, and seconds, and declination in units of degrees, arcminutes, and arcseconds in J2000. Col. (2): the lower limit of hardness ratio HR. Col. (3): the mean of hardness ratio (HR(HcSc)(HcSc)). Col. (4): the upper limit of hardness ratio HR. Col. (5): the lower limit of color C21. Col. (6): the mode of X-ray color C21 ((SS). Col. (7): the upper limit of color C21. Col. (8): the lower limit of color C32. Col. (9): the mode of X-ray color C32 ((SH)). Col. (10): the upper limit of color C32. For detail information about photometry and color determinations, see §3.2. See Table 2 for definition of energy bands. The complete version of this table is in the electronic edition of the . The printed edition contains only a sample.
| Source Name | HR_l68 | HR_mean | HR_u68 | C21_l68 | C21_mode | C21_u68 | C32_l68 | C32_mode | C32_u68 |
|---|---|---|---|---|---|---|---|---|---|
| (1) | (2) | (3) | (4) | (5) | (6) | (7) | (8) | (9) | (10) |
| CXOMP J005618.9-272429 | |||||||||
| CXOMP J005622.4-272223 | |||||||||
| CXOMP J005622.8-272746 | |||||||||
| CXOMP J005630.6-273141 | |||||||||
| CXOMP J005633.8-272954 | |||||||||
| CXOMP J005644.3-274936 | |||||||||
| CXOMP J005645.6-272444 | |||||||||
| CXOMP J005645.9-275522 | |||||||||
| CXOMP J005649.8-273319 | |||||||||
| CXOMP J005651.7-272856 | |||||||||
| CXOMP J005654.5-275116 | |||||||||
| CXOMP J005657.0-274025 | |||||||||
| CXOMP J005659.0-274913 | |||||||||
| CXOMP J005659.3-272251 | |||||||||
| CXOMP J005701.0-272334 | |||||||||
| CXOMP J005701.4-274344 | |||||||||
| CXOMP J005704.7-280145 | |||||||||
| CXOMP J005705.3-274554 | |||||||||
| CXOMP J005710.1-274952 | |||||||||
| CXOMP J005710.2-274954 | |||||||||
| CXOMP J005712.9-272650 | |||||||||
| CXOMP J005714.0-272536 | |||||||||
| CXOMP J005714.9-271851 | |||||||||
| CXOMP J005715.3-271735 | |||||||||
| CXOMP J005716.6-273230 | |||||||||
| CXOMP J005716.8-272128 | |||||||||
| CXOMP J005717.3-274236 | |||||||||
| CXOMP J005717.5-272617 | |||||||||
| CXOMP J005717.9-271830 | |||||||||
| CXOMP J005719.7-272035 |
Note. — Col. (1): ChaMP source name given by right ascension in units of hours, minutes, and seconds, and declination in units of degrees, arcminutes, and arcseconds in J2000. Col. (2): the lower limit of hardness ratio HR. Col. (3): the mean of hardness ratio (HR(HcSc)(HcSc)). Col. (4): the upper limit of hardness ratio HR. Col. (5): the lower limit of color C21. Col. (6): the mode of X-ray color C21 ((SS2)). Col. (7): the upper limit of color C21. Col. (8): the lower limit of color C32. Col. (9): the mode of X-ray color C32 ((SH)). Col. (10): the upper limit of color C32. For detail information about photometry and color determinations, see §3.2. See Table 2 for definition of energy bands. The complete version of this table is in the electronic edition of the . The printed edition contains only a sample.
| ALL | |||||||||||
|---|---|---|---|---|---|---|---|---|---|---|---|
| Band | Number | Min | Max | Median | Mean | Number | Min | Max | Median | Mean | |
| (1) | (2) | (3) | (4) | (5) | (6) | (7) | (8) | (9) | (10) | (11) | |
| CountaaSource Counts | B | 6755 | 0.04 | 40535.59 | 21.03 | 68.05 | 5407 | 8.00 | 40535.59 | 28.14 | 83.49 |
| S | 6696 | 0.00 | 38117.52 | 15.46 | 54.70 | 4561 | 7.94 | 38117.52 | 25.66 | 77.89 | |
| H | 6221 | 0.00 | 11604.93 | 5.87 | 15.12 | 1914 | 8.28 | 11604.93 | 18.02 | 39.16 | |
| Bc | 6736 | 0.20 | 39760.98 | 20.53 | 65.33 | 4950 | 9.53 | 39760.98 | 30.05 | 86.45 | |
| Sc | 6634 | 0.01 | 36010.96 | 13.52 | 48.23 | 4245 | 7.94 | 36010.96 | 24.27 | 72.73 | |
| Hc | 6401 | 0.00 | 13624.92 | 7.16 | 18.85 | 2406 | 8.33 | 13624.92 | 18.88 | 42.24 | |
| FluxbbSource Flux with in units of | B | 6755 | 0.01 | 6484.14 | 7.97 | 23.10 | 5407 | 0.80 | 6484.14 | 10.04 | 27.52 |
| S | 6696 | 0.00 | 3482.36 | 3.92 | 12.19 | 4561 | 0.45 | 3482.36 | 5.96 | 16.71 | |
| H | 6221 | 0.00 | 6326.57 | 5.08 | 12.78 | 1914 | 1.89 | 6326.57 | 11.09 | 26.93 | |
| Bc | 6736 | 0.02 | 5882.11 | 7.34 | 20.90 | 4950 | 0.94 | 5882.11 | 9.96 | 26.47 | |
| Sc | 6634 | 0.00 | 2470.09 | 2.64 | 8.27 | 4245 | 0.37 | 2470.09 | 4.28 | 11.90 | |
| Hc | 6401 | 0.00 | 6673.65 | 5.65 | 14.10 | 2406 | 1.65 | 6673.65 | 11.10 | 26.59 | |
| Exp. | B | 6755 | 0.71 | 123.63 | 33.91 | 39.82 | 5407 | 0.86 | 123.63 | 36.67 | 42.30 |
| TimeccEffective Exposure Time in units of | S | 6696 | 0.71 | 123.63 | 33.95 | 39.81 | 4561 | 0.86 | 123.63 | 36.84 | 42.51 |
| H | 6221 | 0.71 | 123.63 | 34.76 | 40.57 | 1914 | 2.04 | 123.63 | 42.98 | 52.65 | |
| Bc | 6736 | 0.71 | 123.63 | 33.95 | 39.83 | 4950 | 0.90 | 123.63 | 37.70 | 43.30 | |
| Sc | 6634 | 0.71 | 123.63 | 33.98 | 39.87 | 4245 | 0.86 | 123.63 | 37.57 | 43.22 | |
| Hc | 6401 | 0.71 | 123.63 | 34.41 | 40.23 | 2406 | 1.21 | 123.63 | 41.67 | 50.59 | |
| OAAddOff axis angle in units of arcminutes | B | 6755 | 0.05 | 23.26 | 5.40 | 6.13 | 5407 | 0.05 | 23.23 | 5.98 | 6.55 |
| S | 6696 | 0.05 | 23.26 | 5.42 | 6.15 | 4561 | 0.05 | 23.23 | 6.22 | 6.80 | |
| H | 6221 | 0.05 | 23.26 | 5.47 | 6.16 | 1914 | 0.06 | 23.23 | 6.23 | 6.76 | |
| Bc | 6736 | 0.05 | 23.26 | 5.40 | 6.13 | 4950 | 0.05 | 23.23 | 6.15 | 6.71 | |
| Sc | 6634 | 0.05 | 23.26 | 5.44 | 6.16 | 4245 | 0.05 | 23.23 | 6.34 | 6.91 | |
| Hc | 6401 | 0.05 | 23.23 | 5.45 | 6.15 | 2406 | 0.06 | 23.23 | 6.24 | 6.76 | |
| HR | 6795 | -0.99 | 0.96 | -0.36 | -0.28 | 2005 | -0.96 | 0.76 | -0.35 | -0.31 | |
| C21 | 6795 | -1.80 | 1.36 | -0.41 | -0.40 | 1606 | -1.47 | 0.78 | -0.28 | -0.27 | |
| C32 | 6795 | -1.36 | 2.30 | 0.32 | 0.29 | 1650 | -0.87 | 1.73 | 0.35 | 0.32 | |
Note. — Col. (1): X-ray energy band. Col. (2)-(6): the statistical properties of all ChaMP X-ray point sources. Col. (7)-(11): the statistical properties of sources with .
![[Uncaptioned image]](/html/astro-ph/0611840/assets/x1.png)
The location of 149 ChaMP fields in equatorial coordinates. Red circles represent ACIS-I at the aim point, and blue circles ACIS-S. The circle size crudely indicates the Chandra exposure time, ranging from 0.9 to 124 ksecs. The ChaMP fields are uniformly distributed over the celestial space except (by selection) the Galactic plane region.
![[Uncaptioned image]](/html/astro-ph/0611840/assets/x2.png)
The number distribution of effective exposure times () and Galactic extinction, () of the 149 ChaMP observations. The dashed line indicates the mean of each number distribution. The mean exposure time of the ChaMP is and the mean Galactic extinction in the ChaMP is . The ChaMP fields range from short to long exposure times and their Galactic absorption is lower than the Galactic plane (). The number distributions of the 62 ChaMP fields from Paper I are displayed as shaded histograms.
![[Uncaptioned image]](/html/astro-ph/0611840/assets/x3.png)
The large overlapping double X-ray sources detected by (), the PSF image at their median location (), and the combined image of two PSFs at each X-ray source position (). The white crosses and circles mark the positions and sizes of the double sources. The cyan crosses indicate the median location of the double sources. Circle size corresponds to the source extraction region used in . The shape of the detected overlapping X-ray sources () are similar to the shape of the single PSF (), rather than double PSFs (). We conclude that the overlapping X-ray sources are spurious doubles due to the elongated PSF shape and sub-structures in the PSF. The PSF images are generated by the tool in the CIAO package and MARX package. The size of all images is and all images are aligned with the world coordinate system.
![[Uncaptioned image]](/html/astro-ph/0611840/assets/x4.png)
Source extraction radius as a function of off-axis angle. The dotted line represents the source radius from the old version of the CIAO CALDB used in the previous ChaMP catalog (Paper I). The solid line represents the source radius from the latest version of the CIAO CALDB used in this catalog. The source size is limited to a minimum radius of and a maximum of . The difference between the two radii is plotted as a dashed line. The difference between the source counts in this and the previous catalog as a function of the previous counts. On average the reduced source radius yields source counts lower by in this catalog. The dashed line indicates the zero difference level.
![[Uncaptioned image]](/html/astro-ph/0611840/assets/x5.png)
Schematic diagrams of the two types of overlapping X-ray source pairs, small () and large (). and represent the source1 and source2, respectively. and represent the independent area of each source. and represent the angles covered by sectors , and of overlapping regions of two sources, respectively. and represent the core regions of large overlapping sources, respectively. represents the distance between and . The points are simulated X-ray events assuming a model for the event distribution. For the small overlapping case, only the photons in regions and are used to determine the correction, while the photons in regions and are used in the large overlapping case. The detailed correction method of is described in the text.
![[Uncaptioned image]](/html/astro-ph/0611840/assets/x6.png)
Comparison of a classical with a Bayesian method for HR (), C21 (), and C32 (). The sources with () for HR (X-ray colors) in both energy bands are plotted. The black open triangles represent the sources with in at least one energy band. The red closed circles represent the sources with in two energy bands. The blue line represents the line of equality for the two methods and is shown for illustrative comparison. For bright sources (), the HR and X-ray colors from both methods agree well; however, for faint sources (), they do not agree, because the classical method, using Gaussian statistics, fails to describe the nature of faint sources.
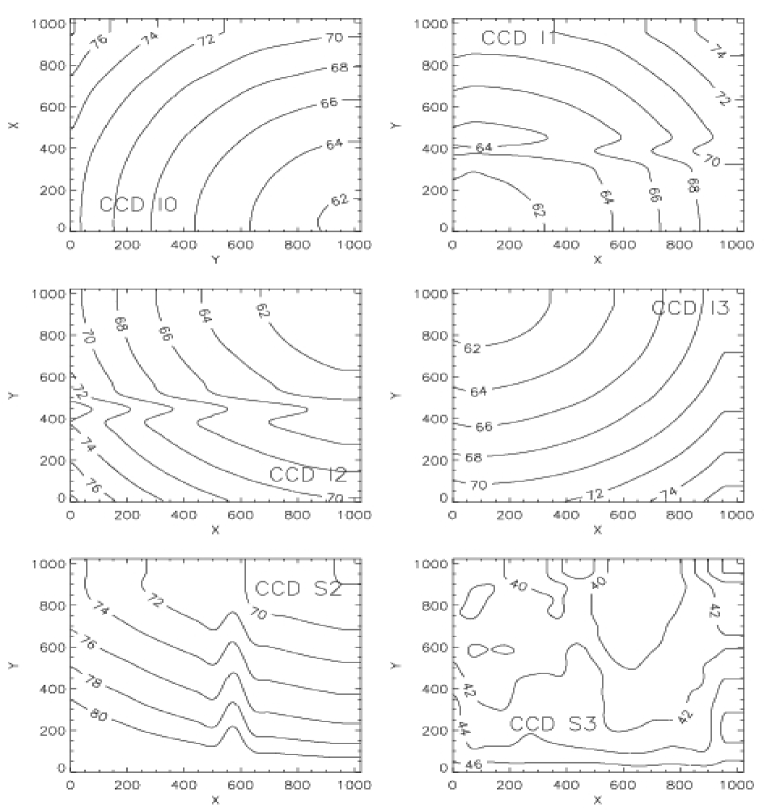
![[Uncaptioned image]](/html/astro-ph/0611840/assets/x8.png)
The spatial variations of the in the S band as a function of off axis angle in each CCD chip observed with ACIS-I including S2 and S3 CCD chips. The aim point of this observation is located on the I3 CCD chip, so the off axis angle of S2 and S3 chips is large. varies by at most depending on position in each CCD chip. The ratios of to the vignetting corrected . Blue squares are caused by the exposure map defects such as a CCD chip edge or bad pixel strip effect. Red triangles are caused by lower quantum efficiency at larger off axis angles. The mean ratio is in the I0-I3 chips and and in the S2 and S3 chips.
![[Uncaptioned image]](/html/astro-ph/0611840/assets/x9.png)
The positional offset of the artificial sources in three source count ranges as a function of off-axis angle. The black squares, red triangles, and blue circles represent artificial sources with count ranges of , , and , respectively. The positional offset exponentially increases with off axis angle, and decreases as the source counts increase with a power law form. The positional uncertainties from the derived equations (see equation (12), (13), and (14) in §4.2.1) as a function of off axis angle for 10 source counts (), 100 source counts (), and source counts (), respectively. The solid, dotted, and dashed lines represent the positional uncertainty at , , and confidence levels, respectively.
![[Uncaptioned image]](/html/astro-ph/0611840/assets/x10.png)
The number distributions of positional uncertainty of all ChaMP X-ray point sources estimated from our empirical positional uncertainty equations. Black, red, and blue histograms show the , , and confidence level of positional uncertainty distributions, respectively. The median positional uncertainties for all sources are plotted as dashed lines and shown at , , and , respectively.
![[Uncaptioned image]](/html/astro-ph/0611840/assets/x11.png)
Positional offset between the matched ChaMP and sources as a function of off-axis angle. The number distribution of the positional offset between the matched ChaMP and the sources. The median positional offset is and is denoted by the dotted line.
![[Uncaptioned image]](/html/astro-ph/0611840/assets/x12.png)
The detection probability of a source in the ChaMP catalog as a function of B band counts. The thick solid line represents the detection probability of all sources. The red dot dashed, blue long dashed, and magenta short dashed lines denote the detection probability of sources located at off axis angles, , , and , respectively. As expected, the detection probability decreases as the off axis angle increases.
![[Uncaptioned image]](/html/astro-ph/0611840/assets/x13.png)
The false source detection rate as a function of source counts in the B band extracted by () and off axis angle (). of the total detected sources are spurious sources and of spurious sources have counts less than . The false source detection rate increases as the source counts decrease and as the off axis angle increases. The dashed lines indicate the best linear least square fit results (see §4.3.2).
![[Uncaptioned image]](/html/astro-ph/0611840/assets/x14.png)
The count recovery rate as a function of input counts. Comparison of the count recovery rate from ( ) with that from ( ). Both and recover the true counts well ( level for and level for ), however, for source counts fainter than , recovers only of the true counts. Note that Eddington bias is visible in the first points of both and count recovery rates. The count recovery rates of sources with ( ), ( ), and ( ), respectively. Source counts are extracted using . As the off axis angle increases the uncertainty in the count recovery rate increases.
![[Uncaptioned image]](/html/astro-ph/0611840/assets/x15.png)
The flux limits of detected X-ray point sources in the ChaMP fields as a function of net exposure time. Four CCD chips (I0, I1, I2, and I3 for ACIS-I observations, and I2, I3, S2, and S3 for ACIS-S observations) per ChaMP field and the 130 ChaMP fields were used. Detected artificial X-ray point sources with are selected in each CCD chip and their minimum flux is defined as the flux limit of that CCD chip. Red circles, blue squares, and green triangles represent the Bc, Sc, and Hc bands, respectively. The solid lines represent the best linear least squares fit results in each energy band. The scatter is caused by the varying sensitivity and detection probability of each CCD chip and observation. A photon index of was assumed.
![[Uncaptioned image]](/html/astro-ph/0611840/assets/x16.png)
The distributions of source net counts in the Bc (), Sc (), and Hc () bands, respectively. The open and shade histograms are for all sources and sources with , respectively, in each energy band. The solid and dashed vertical lines indicate the medians of the total sample and high sample, respectively.
![[Uncaptioned image]](/html/astro-ph/0611840/assets/x17.png)
Same as Figure Chandra Multiwavelength Project X-ray Point Source Catalog, but for flux. The flux was determined assuming a photon index of and Galactic absorption .
![[Uncaptioned image]](/html/astro-ph/0611840/assets/x18.png)
Same as Figure Chandra Multiwavelength Project X-ray Point Source Catalog, but for off axis angle.
![[Uncaptioned image]](/html/astro-ph/0611840/assets/x19.png)
The number distribution of mean hardness ratio (), the most probable values of the color C21 () and C32 () of ChaMP X-ray point sources. The open and shaded histograms are for sources with and in both energy bands, respectively. This constraint yields a small number of shaded histograms. The solid and dashed vertical lines indicate the medians of the total sample and high sample, respectively.
![[Uncaptioned image]](/html/astro-ph/0611840/assets/x20.png)
The color-color diagram of ChaMP X-ray point sources observed with ACIS-I. The open circles and red closed circles represent sources with and with , respectively. The grid indicates the predicted locations of the sources at redshift with various photon indices (, from bottom to top) and absorption column densities (, from right to left). Most sources are located within the ranges of Galactic absorption and photon index .
![[Uncaptioned image]](/html/astro-ph/0611840/assets/x21.png)
Same as Figure Chandra Multiwavelength Project X-ray Point Source Catalog, but for ACIS-S observations.