Optical variability of the strong-lined and X-ray bright source
1WGA J0447.9-0322
Abstract
We present the historic light curve of 1WGA J0447.9-0322, spanning the time interval from 1962 to 1991, built using the Asiago archive plates. The source shows small fluctuations of about 0.3 mag around B=16 until 1986 and a fast dimming of its average level by about 0.5 mag after that date, again with small short term variations. The variability pattern is within the values shown by other QSOs with long term monitoring, notwithstanding its high X-ray/optical ratio. We present also its overall SED using literature data and recent UV-optical SWIFT observations.
1 Introduction
The DXRBS and RGB samples of blazars (Perlman et al. 1998; Laurent-Muehleisen et al. 1999) discovered a number of Flat Spectrum Radio Quasars (FSRQ) with strong X-ray fluxes (Padovani et al. 2003). This finding was in contrast with the previous expectation that strong-lined Quasars should not be bright X-ray emitters.
The so-called ”blazar sequence”, proposed by Fossati et al. (1998), indeed showed a marked correlation between the peak frequency of the spectral energy distribution, in the radio to soft X-ray range, and the X-ray/optical flux ratio. According to that sequence, the peak frequency of the low-energy branch of the spectral energy distribution is inversely correlated to the bolometric power of the source, so that only intrinsically faint sources should be capable of accelerating electrons to the high energies required to push the syncrotron emission up to the X-ray band: these sources are the so called HBL objects.
Very little information is presentely available on these X-ray strong FSRQ, as they have been discovered relatively recently. One of these is the radio source PMN J0447-0322 (Griffith et al. 1995), identified as an X-ray source in the WGA catalogue (White et al. 1995, 2000). It is present as a bright source in the Rosat All Sky Survey (Voges et al. 1999) and as such it was included in ROSAT-based catalogues of AGNs like the REX survey (Caccianiga et al. 2000). On the basis of its optical and radio spectrum it was classified as a bright Flat Spectrum Radio Quasar (FSRQ) by Caccianiga et al. (2000) with a redshift z=0.773. It is also present in the 2MASS infrared survey (Barkhouse & Hall 2001).
Despite its relative brightness (B 16) the optical variability of 1WGA J0447.9-0322 was not studied in any detail: we made therefore a search in the Asiago plate archive for historical images and found a large number of useful Schimdt plates, covering the period from 1961 to 1985.
In this paper we present the first optical historic light curve of 1WGA J0447.9-0322 and compare it with long term light curves of QSOs taken from the literature to see if it is statistically different from that of X-ray faint sources. We report also the results of a recent SWIFT observation of this source in the optical and X-ray bands and report an updated Spectral Energy Distribution.
2 The 67/92 cm Photographic Material and Data Analysis
We found 266 useful plates in the Asiago Observatory archive containing our source: 205 of them were obtained with the 50/40/120 cm Schmidt telescope (S40) and 61 with the 90/67/245 cm one (S67). Several filter/emulsion combinations were used over the years, characterized by different effective wavelengths: 103aO+GG13 (closely matching the Johnson’s B filter), 103aO (3600-5000 Å), TriX (3600-6700 Å) and Panchro Royal (3800-6400 Å). All these plates were taken as part of the Supernova sky patrol of the Asiago Observatory ( field) and were never used before for the study of 1WGA J0447.9-0322 . The covered time interval is from September 1962 to January 1991, but with a highly uneven sampling. Indeed the source can be properly observed from Asiago only during the winter because of its low declination.
The plates were digitized at the Asiago Observatory with an EPSON 1680 Plus scanner as part of a national program of digitization of astronomical plate archives (Barbieri et al. 2003). A sampling step of 16 micron (1600 dpi) was used, in grayscale/transparency mode and 16 bit resolution. Plate scanning included also the unexposed borders to measure the plate fog level (). Due to the presence of a residual scattered light in the scanner, we evaluated the instrumental zero value for each plate () using the central pixels of the most overexposed stars. The transformation of the recorded plate transparency of each pixel into a relative intensity was obtained applying the simple relation . As there is no photometric sequence in the sky area near 1WGA J0447.9-0322 we used the magnitudes of the GSC2 catalogue for our measures of 1WGA J0447.9-0322 . To this purpose we selected 18 stars around the source covering the range : the faint extreme is nearly the limit of detection for the small Schmidt telescope.
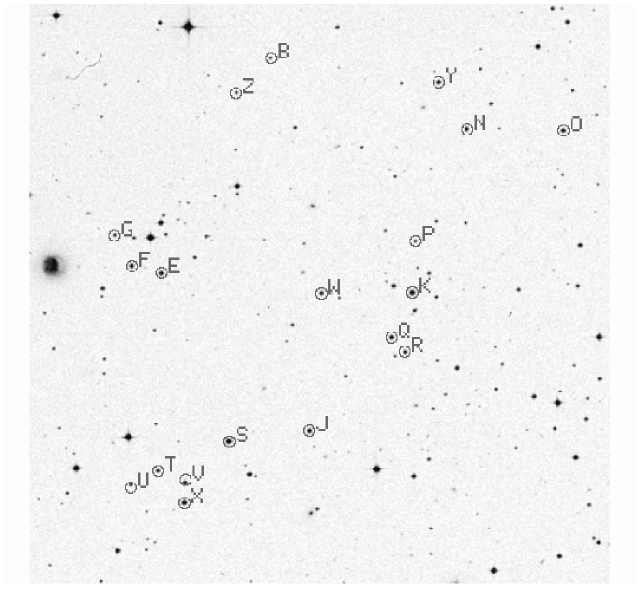
We checked that the selected stars were not variable and that their color indices were similar to minimize any possible color effect. In this respect 1WGA J0447.9-0322 is remakably bluer (B-R0.5) than all our reference stars (B-R1.0). A finding chart of the reference stars is given in Fig.1, where 1WGA J0447.9-0322 is marked with W. Table 1 gives for each star RA and DEC (J2000) taken from the GSC2 (column 1 and 2), the GSC2 identification (column 3), the R and B magnitudes (columns 4 and 5), our adopted magnitude and internal error (column 6, discussed below) and its flag on the finding chart (column 7).
We started our search with the plates of the 67 cm Schmidt, which allows a higher photometric accuracy: nearly all the plates were taken with the 103aO emulsion without filter and have a limiting magnitude 18. Instrumental magnitudes were obtained with IRAF/apphot using a photometric aperture of 3 pixels (4.5 arcsec). The scatter plot between these magnitudes and those of the GSC2 for each plate showed that a linear fit was quite satisfactory. The slopes of the fitting lines were always between 0.7 and 1.4, as expected for the linearized response of a photographic plate. The formal error of the magnitudes in the GSC2 catalogue is 0.4 mag, mainly due to the uncertainty of the zero point calibration. Having 67 plates of the field we performed an intercalibration of the magnitudes of our reference stars and obtained the data listed in column 6 of Table 1. The differences with respect with the GSC2 values are in all cases smaller than 0.1 mag, indicating that the GSC2 catalogue can be very useful for the construction of historical photographic light curves.
The magnitudes of column 6 (which we will call B/Asiago) were then used to rebuild the calibration curve for each plate, which were again well fitted by a linear relation with an appreciably smaller scatter. The magnitude of 1WGA J0447.9-0322 in each plate was then derived from the instrumental one using the relevant calibration curve. These magnitudes and the rms deviation of the fit are reported in Table 2 (electronic edition only), column 3 and 4. In several cases, due to statistical fluctuations and to different plate quality, the rms deviation is smaller than the errors of the individual reference stars given in Table 1, which are derived from the whole plate set. The typical value is 0.1 mag and is representative, in our opinion, of the actual photometric accuracy even for good plates with smaller formal error. The plate number and JD-2,400,000 are reported in column 1 and 2 of Table 2.
We checked if the color difference between 1WGA J0447.9-0322 and the reference stars may produce systematic effects in our photometry. We made a numerical simulation, assuming a spectral shape and integrating the flux with the B filter passband, normalized at the central wavelength. The values corresponding to the color index of our source (B-R=0.5) and of our average reference stars (B-R=1.0) are 0.4 and 1.5 respectively. Changing the spectral slope by this amount gives a magnitude variation of just 0.03 mag, which is below our typical photometric uncertainty.
Actually many BL Lac objects are ”bluer when brighter”, with a spectral slope variation range of 0.5 (see e.g. Vagnetti et al. 2003; Fiorucci et al. 2004). Also if we consider 1WGA J0447.9-0322 as a QSO rather than a BL Lac, the spectral index variability has a limited range (0.5, Trevese & Vagnetti 2002). From our simulation such a variation has a negligible effect (0.01 mag) on the observed magnitude of our source, so that we can ignore the effect of a possible color change with luminosity of 1WGA J0447.9-0322 .
In no case was 1WGA J0447.9-0322 fainter than our faintest reference stars, so that our magnitudes are always derived by interpolation in the calibration curve. The resulting light curve is plotted in Fig.2, together with the light curve of the reference star r (B=16.0) shifted 0.5 mag upwards for clarity.
3 Digital Sky Survey data
Two additional historical points were obtained from the digitized POSS-I (date 1955-12-14, JD 2435455) and UKST DSS-II (date 1982-12-12, JD 2445315) blue plates retrieved from the Space Telescope Science Institute archive (http://archive.stsci.edu/cgi-bin/dss_plate_finder), using the same reference stars and data reduction procedure used for the 67cm Schmidt plates.
The POSS-I plate gave a good linear fit for the instrumental magnitudes of the reference stars (rms=0.09) with =15.85 for 1WGA J0447.9-0322 (circle at JD 35455 in Fig.2). The UKST plate is that used for the construction of the GSC2 catalogue: in our B/Asiago magnitude scale we measured 1WGA J0447.9-0322 at =16.03 (circle at JD 45315 in Fig.2): we have a nearly simultaneus observation in our database (plate S67-11792) at =15.86, in reasonable agreement.
We found also two red plates in the STScI archive, a POSS-I plate (103aE emulsion) made the same day as the blue one, and a UK Schmidt (IIIaF emulsion) plate taken on 1995-11-14. We measured instrumental magnitudes of our reference stars for these plates too (with IRAF/apphot) and made calibration curves using the GSC2 red magnitudes. A linear fit in the magnitude range 15.4-16.0 was quite satisfactory with rms scatter 0.1 . For both plates we get =15.60, very near to the value =15.63 given by the GSC2 catalogue. From the simultaneous 1955 B and R plates, the color index of 1WGA J0447.9-0322 was 0.27: assuming that this value is valid also for the 1995 we get that the source in 1995 was as bright as in 1955 (=15.85, star at JD 50036 in Fig.2), appreciably brighter than the last S67 Asiago point in 1991 at =16.3.
4 SWIFT-UVOT observation of 1WGA J0447.9-0322
1WGA J0447.9-0322 was observed several times by SWIFT (Gehrels et al. 2004) in the framework of a program of Blazar monitoring, but only in one pointing (2005-04-15) UVOT data were obtained. The observing strategy of the satellite was to get several short exposures in each of the 6 filters (V, B, U, UW1, UM2, UW2): to improve the S/N ratio we summed all the frames relative to each filter and made the aperture photometry of our reference stars (and 1WGA J0447.9-0322 ) with the task UVOTSOURCE in the UVOT data analysis package using a 6 arcsec radius for the V,B,U filters and 12 arcsec for the remaining ones, as reccomended in the most recent cookbook (Breeveld et al. 2005). The resulting magnitudes for each filter, not corrected for the galactic reddening, are collected in column 2 of Table 3; in the same Table we show also the values (in erg s-1 cm2), corrected for galactic extinction assuming E(B-V)=0.05, which we will use in Section 6 to build the Spectral Energy Distribution (SED) of the source.
We made a consistency check for the filter between the UVOT and our B/Asiago magnitudes. To this purpose we made aperture photometry with UVOTSOURCE of 13 reference stars which fall within the UVOT field of view (star s was excluded because it was very near to the saturation limit of UVOT). The comparison of the UVOT and B/Asiago magnitudes gave a best fit slope 1.10 with rms 0.04. The magnitude differences between the reference stars, due to the different zero points and slope, are not large, being 0.1 at =14.7 and 0.3 at =16.7, in any case within the formal error of the GSC2 absolute calibration.
We tried to further check this point observing the field of 1WGA J0447.9-0322 at the 182 cm telescope of Cima Ekar (Asiago) on 2006-01-04 with the CCD camera of the AFOSC instrument, but the night was not photometric, so we could not check the zero point of the GSC2 magnitude scale. Due to the limited field of view (8.8’) of AFOSC we were able to include only 5 reference stars (excluding star s as above), covering however the magnitude range of the 1WGA J0447.9-0322 light curve. A comparison of the AFOSC instrumental magnitudes with those of UVOT showed that the linearity of the UVOT magnitude scale is rather good (slope=1.034, rms 0.018 ); a small non-linearity of the UVOT instrument at the 5% level was also found by Li et al. (2006) in the analysis of the stars in two supernova fields and by some of us in the analysis of the reference stars in the fields of BL Lacertae (Tosti et al., 2006). We conclude therefore that the GSC2 scale is somewhat compressed. This small compression has anyway little effect on the light curve of 1WGA J0447.9-0322 which has a maximum amplitude of only 1 mag: the peak to peak systematic difference is 0.1 mag, comparable with the statistical error of our photographic magnitudes. Therefore we did not correct our light curve for this effect.
The magnitude of 1WGA J0447.9-0322 observed by UVOT was =16.60 on the B/Asiago scale (open square in Fig.2): the same value was given by the AFOSC observation 8 months later(filled square in Fig.2). The source was therefore in the last years at a flux level similar to the low state of the years 1987-89 of the Asiago historic light curve.
5 The Small Schmidt Plates
Finally we made the photometry of our source also on the S40 plates, using our B/Asiago values for the reference stars: due to the smaller plate scale (206 arcse/mm) we adopted a photometric aperture radius of 2 pixels (6.6 arcsec). The rms deviation of the linear fit between nominal and instrumental magnitudes of the reference stars was higher than for the 67 cm Schmidt, as expected for a smaller instrument. The scatter of the reference stars magnitudes around their nominal value is however well-behaved, i.e. increases monotonically from 0.08 mag at 14.5 to 0.26 mag at 16.5. In these plates the fainter stars of the sequence were rather near to the plate limit. We decided to use these lower quality plates just to look for possible large amplitude flares of 1WGA J0447.9-0322 . The S40 plates are indeed much more numerous that the S67 ones and allow therefore a better time coverage of the light curve, though with a worse photometric accuracy.
In a large number of nights, two consecutive plates were taken at the S40 with different emulsions: no systematic differences in the magnitudes of 1WGA J0447.9-0322 were found between Panchro Royal and 103aO, while a systematic difference of 0.23 mag was found between Tri-X and 103aO, the Tri-X magnitudes being fainter. This is probably due to the better violet sensitivity of the 103aO emulsion, which is relevant for an object definitely bluer than the reference stars. We reported all the Tri-X magnitudes to the zero point of the 103aO emulsion, to be consistent with the light curve obtained with the S67 and then we averaged the data referring to the same night. The resulting the light curve is shown in Fig.3. Large circles show the S67 points, while the small crosses show the values for the S40: error bars are omitted for clarity. The overall behaviour of the light curve is similar to that of the S67, but with a substantial scatter. The remarkable point is that no strong flares were detected. The source was never brighter than =15.5. The list of all the magnitudes and relative uncertainties of 1WGA J0447.9-0322 is given in Table 2 (electronic edition only): only one plate number is listed when two plates were averaged.
6 The Spectral Energy Distribution
A spectral energy distribution of 1WGA J0447.9-0322 was published by Padovani et al (2003) using literature data. An enhanced version, including JHK magnitudes taken from the 2MASS (Cutri et al. 2003) and preliminary X-ray and optical data from XMM-Newton was published by Landt et al. (2005). The source was not detected by EUVE.
The SED of the source is shown in Fig.LABEL:sed, including literature radio, JHK, GSC2 data and our optical and UV data from SWIFT. The radio point at 4.8 GHz is from the PMN survey on November 1990 (Griffith et al . 1995) and is nearly simultaneously to the ROSAT observation used in the WGA catalogue. The X-ray flux is taken from the NED, and we checked the result converting the WGA count-rate to flux using the PIMMS tool at HEASARC. The observation at 1.4 GHz is given by the NVSS (Condon et al. 1998; 87 3 mJy) and shows no appreciable polarization. From our light curve the B magnitude at the epoch of the ROSAT and PMN observations was about 16.3, only 0.2 mag fainter than the GSC2 point. The high X-ray/optical flux ratio of this source is therefore real and not a spurious result of using non-simultaneous data of a variable object.
It is apparent that 1WGA J0447.9-0322 looks like a High Energy Peaked source, with an apparent peak around 10. The optical part of the SED at the epoch of the SWIFT observation looks parallel to that obtained from historical data (2MASS + GSC2). We derived a color index from the published optical spectra in Caccianiga et al. (2000) and Perlman et al. (1998), getting in both cases 0.47. This value is in fair agreement with that derived extrapolating to the frequency the UBV slope of the SWIFT data (=0.6).
7 Discussion
At a redshift of 0.774 the absolute magnitude of 1WGA J0447.9-0322 is -26.6 (H0=70 q0=0.5) and the radio power at 1.4 GHz, K-corrected assuming a slope for the radio flux density of -0.34, is 26.0 (Log W/Hz). The source has therefore a radio power intermediate between those of FR I and FR II sources and is moderately radio-loud (Fradio/Fopt 40). It is reported as unresolved with the VLA (Landt et al. 2006).
We compared the rms amplitude of the optical variability of 1WGA J0447.9-0322 (0.27 mag) with the corresponding value reported for the PG QSO sample (Giveon et al. 1999), derived from light curves covering a time interval of 7 about years. No systematic difference between radio-loud and radio-faint QSOs were found by Giveon et al. (1999) for this value, which ranges from 0.05 to 0.34 mag: the detected variability of 1WGA J0447.9-0322 is therefore within the range of the PG QSOs.
A much wider sample of optically selected QSO from the Sloan Digital Sky Survey (SDSS), but monitored only over a few year time base, by Vanden Berk et al. (2004) also reports no definite statistical difference between radio loud and radio quiet sources, while the typical rms variability is 0.13 () mag .
A comparison with longer light curves can be made using the Rosemary Hill Observatory data (Pica et al. 1988) monitoring 144 AGNs (26 BL Lac, 18 radio quiet QSO, 85 radio-loud QSO and a few miscellaneneus) over 19 years. Also in this case the rms variability of 1WGA J0447.9-0322 is within the range of the monitored sources and also the peak to peak variability amplitude (1.1 mag) is at an intermediate level.
The X-ray brightness of 1WGA J0447.9-0322 has therefore no apparent impact on its optical variability.
In our opinion the historic light curve of 1WGA J0447.9-0322 may be seen as characterized by a flat behaviour around B=16.0 with small(0.3 mag) amplitude oscillations until JD 46500, when a fast jump down to 16.6 happened (see Fig.2). This vision is suggested by the fact that the POSS-I point at JD 35455 is at the average level of the light curve between JD 38000-46000, while the UVOT and Ekar points are at the level of the second part of the light curve (JD 46500-48000). However, a simpler interpretation of a slow monotonic decreasing trend with small amplitude oscillations cannot be ruled out.
The light curve shapes shown by Pica et al. (1988) are broadly classified by them in three classes: I) fast flickering with a nearly stable base level; II) small flickering above a long-term (possibly oscillating) trend; III) significant flickering over much slower long term changes of similar amplitude. These classes are not sharply separated and they report some cases of sources changing from one class to another. Two cases of ”bistable” sources are also reported by them, i.e. flickering for some years above a given level and then, after a sharp transition, above a different level. One is GC 0109+220 a well established BL Lac, the other is PKS 0723-008 which is presently classified as a Narrow Line Radio Galaxy (Eracleous & Halpern 2004) . The recent behaviour (1992-2002) of GC 0109+224 has been intensively monitored by Ciprini et al. (2004): its behaviour may still be classified as a class I in the previous scheme, but with a higher base level than in the 1970’s. From all the available data 1WGA J0447.9-0322 might belong to this ”bistable” class: clearly a longer monitoring would be necessary to check this result.
8 Conclusions
Old photographic archives still contain a lot of unexplored data, which can be very useful to complement recent multi wavelength observations of variable sources (Nesci et al. 2006). The optical light curve, spanning about 29 years, showed a moderate variability, typical for a QSO, without strong flares (it is not an OVV object). The high X-ray/optical flux ratio looks therefore real, and not a spurious result due to the use of non-simultaneous data.
A moderate level of variability is often found also in BL Lacertae objects of the High Energy Peak type: 1WGA J0447.9-0322 is not a BL Lac, given its strong Mg II 2900 Å emission line with about 200 Å of equivalent width, but is a High Energy Peak object.
If a strong and fast variability is due to the fast cooling of relativistic electrons emitting by the synchrotron process, then it is expected to be observed mainly at energies higher than the peak of the SED (see e.g. Perlman et al 2005): the mild behaviour of 1WGA J0447.9-0322 at optical frequencies would therefore be quite within the current model expectations.
References
- Barbieri et al. (2003) Barbieri, C., Blanco, C., Bucciarelli, B., et al. 2003, Experimental Astronomy 15, 29
- Barkhouse & Hall (2001) Barkhouse, W.A. & Hall, P.B. 2001, AJ 121, 2843
- Breeveld et al. (2005) Breeveld, A. A., Poole, T. S., James, C. H. et al. 2005, SPIE 5898, 379
- Caccianiga et al. (2000) Caccianiga, A., Maccacaro, T., Wolter, A., Della Ceca, R., Gioia, I. M. 2000, A&AS 144, 247
- Ciprini et al. (2004) Ciprini, S., Tosti, G., Terasranta, H., Aller, H.D. 2004 MNRAS 348, 1387
- Condon et al. (1998) Condon, J. J., Cotton, W. D., Greisen, E. W., et al. 1998 AJ 115, 1693
- Cutri et al. (2003) Cutri, R. M., Skrutskie, M. F., van Dyk, S., et al. 2003 The IRSA 2MASS All-Sky Point Source Catalog, NASA/IPAC Infrared Science Archive.
- Eracleous & Halpern (2004) Eracleous, M., Halpern, J.P. 2004, ApJS 150, 181
- Fossati et al. (1998) Fossati, G., Maraschi, L., Celotti, A., Comastri, A., Ghisellini, G. MNRAS 299, 433
- Gehrels et al. (2004) Gehrels, N., Chincarini, G., Giommi, P., et al. 2004, ApJ, 611, 1005
- Griffith et al. (1995) Griffith, M. R., Wright, A. E., Burke, B. F., Ekers, R. D. 1995, ApJS 97, 347
- Giveon et al. (1999) Giveon, U., Maoz, D., Kaspi, S., Netzer, H., Smith, P.S. 1999 MNRAS 306, 637
- Landt et al. (2005) Landt, H., Padovani, P., Perlman, E., Giommi, P., 2005, Mem SAIt 76, 136
- Landt et al. (2006) Landt, H., Perlman, E.S., Padovani, P. 2006, ApJ 637, 183
- Laurent-Muehleisen et al. (1999) Laurent-Muehleisen, S.A., Kollgard, R.I., Feigelson, E.D. Brinkmann, W, Siebert, J., 1999, ApJ 525, 127
- Li et al. (2006) Li, Weidong, Jha, S., Filippenko, A. V., et al. 2006, PASP 118, 37
- Nesci et al. (1997) Nesci, R., Aniello, T., Fiorucci, M., Maesano, M., Massaro, E., Montagni, F., & Tosti, G. 1997 Mem SAIt 68, 207
- Nesci et al. (2006) Nesci, R., Massaro, E., Rossi, C., et al. 2006, AJ 130, 1466
- Padovani et al. (2003) Padovani, P., Perlman, E.S., Landt, H., Giommi, P., Perri, M. 2003, ApJ 588, 128
- Perlman et al. (1998) Perlman, E.S., Padovani, P., Giommi, P., et al. 1998 AJ 115,1253
- Perlman et al. (2005) Perlman, E.S, Madjesky, G., Georganopoulos, M. et al. 2005, ApJ 625, 727
- Pica et al. (1988) Pica, A.J., Smith, A.G., Webb, J.R., Leacock, R.J., Clements, S., Gombola, P.P. AJ 96, 1215
- Raiteri et al. (2003) Raiteri, C. M., Villata, M., Lanteri, L.,et al. 2003, A&A 402, 151
- Tosti et al. (2006) Tosti, G., Nesci, R. et al. 2006, in preparation
- (25) Trevese, D. & Vagnetti, F., 2002 ApJ 564, 624
- Vanden Berk et al. (2004) Vanden Berk, D.E., Wilhite, B.C., Kron, R.G., et al. 2004, ApJ 601, 692
- Voges et al. (1999) Voges, W., Aschenbach, B., Boller, Th., et al. 1999 A&A 349, 389
- White et al. (2000) White, N.E., Giommi, P., Angelini, L. 2000, CDS catalogue IX/31
| RA(2000) | DEC(2000) | GSC2 | GSC2 | GSC2 | Asiago | ident. |
|---|---|---|---|---|---|---|
| 04 47 29.672 | -03 18 29.99 | S020101354 | 14.65 | 15.56 | 15.44 0.06 | o |
| 04 47 39.666 | -03 18 27.48 | S020101353 | 14.52 | 15.56 | 15.48 0.05 | n |
| 04 47 42.546 | -03 17 14.97 | S020101350 | 14.87 | 15.81 | 15.85 0.06 | y |
| 04 47 44.998 | -03 21 21.27 | S02010137258 | 15.67 | 16.62 | 16.58 0.08 | p |
| 04 47 45.326 | -03 22 41.42 | S020101366 | 13.71 | 14.76 | 14.86 0.06 | k |
| 04 47 46.044 | -03 24 14.78 | S02010137110 | 15.19 | 16.09 | 16.00 0.07 | r |
| 04 47 47.440 | -03 23 50.83 | S020101372 | 14.36 | 15.46 | 15.49 0.06 | q |
| 04 47 56.038 | -03 26 15.88 | S020101381 | 14.37 | 15.32 | 15.28 0.06 | j |
| 04 47 59.969 | -03 16 37.23 | S02010119203 | 15.81 | 16.74 | 16.68 0.10 | b |
| 04 48 03.515 | -03 17 31.13 | S02010119142 | 16.08 | 16.78 | 16.69 0.10 | z |
| 04 48 04.352 | -03 26 32.06 | S020101385 | 13.27 | 14.31 | 14.40 0.05 | s |
| 04 48 08.896 | -03 27 36.46 | S020101393 | 13.90 | 15.03 | 15.03 0.06 | v |
| 04 48 08.973 | -03 28 07.46 | S020101394 | 13.86 | 14.84 | 14.92 0.05 | x |
| 04 48 11.340 | -03 22 11.41 | S0201011270 | 13.69 | 14.72 | 14.68 0.05 | e |
| 04 48 11.703 | -03 27 17.69 | S02010136903 | 15.45 | 16.29 | 16.30 0.07 | t |
| 04 48 14.386 | -03 21 59.36 | S0201011266 | 14.07 | 15.09 | 15.06 0.04 | f |
| 04 48 14.481 | -03 27 39.03 | S02010136876 | 14.93 | 16.09 | 16.31 0.08 | u |
| 04 48 16.103 | -03 21 11.37 | S02010118906 | 14.90 | 16.10 | 16.29 0.12 | g |
| Filter | Mag | error | |
|---|---|---|---|
| V | 16.53 | 0.04 | -11.310 |
| B | 16.91 | 0.03 | -11.259 |
| U | 15.97 | 0.02 | -11.223 |
| W1 | 15.65 | 0.02 | -11.089 |
| M2 | 15.63 | 0.01 | -10.962 |
| W2 | 15.84 | 0.01 | -10.997 |