100–101
Galaxy Environments in DEEP2: The Birth of the Red Sequence
1 Introduction
The galaxy population at is effectively described as a combination of two distinct types: red, early-type galaxies lacking much star formation and blue, late-type galaxies with active star formation. For the red galaxy population, recent work by [Bell et al. (2004)] has shown that the number density of galaxies on the red sequence has risen by a factor of from to . A variety of complementary observations suggests that the build-up of galaxies on the red sequence results from 2 distinct evolutionary trends: (1) the quenching of star formation in blue galaxies and their subsequent migration onto the red sequence and (2) the dissipationless or (“dry”) merging of red-sequence galaxies.
Many of the physical processes responsible for the quenching of star formation have a strength which depends on environment. For example, ram-pressure stripping and galaxy harassment operate most effectively in regions of extremely high galaxy overdensity (i.e., galaxy clusters). Thus, within this picture, the formation of red-sequence galaxies is directly connected to the local environment. Further evidence for a strong connection between environment and the formation of early-type galaxies is apparent in what are termed the color-density and mophology-density relations. As first quantified more than 25 years ago, these relations hold that star-forming, disk-dominated galaxies tend to reside in regions of lower galaxy density relative to those of red, bulge-dominated galaxies.
Ultimately, we aim to understand when the build-up of red-sequence galaxies began and what specific processes drove this evolution in the galaxy population. The latter issue is one discussed by many presenters in this IAU symposium (e.g., by Conselice, Zhang, etc.). Here, we focus our attention on determining both where and when the red sequence was first established. Did the typical early-type galaxy cease star formation at very early times (), or did they quench recently (in the last 7 Gyr)?
2 DEEP2 and the Evolution of the Color-Density Relation
The DEEP2 Galaxy Redshift Survey began spectroscopic observations in the Summer of 2002, with the goal of characterizing the galaxy population and large-scale structure at . To date, the survey has targeted galaxies in the redshift range , down to a limiting magnitude of . The second major data release for DEEP2 is scheduled for early 2007, including approximately 75% of the data.
Herein, we utilize a sample of galaxies with redshifts in the range and drawn from all 4 of the DEEP2 survey fields. To enable comparison over a broad range, we restrict analyses to include equivalent populations of galaxies at all . Details of this selection are discussed by [Cooper et al. (2006b)] and [Gerke et al. (2006)]. For each galaxy in the DEEP2 sample, we quantify the environment in terms of the local galaxy overdensity , which is derived from the projected distance to the -nearest-neighbor, as detailed by [Cooper et al. (2006a)]. In the tests of [Cooper et al. (2005)], this environment estimator proved to be the most robust indicator of local galaxy density for intermediate- surveys like DEEP2.
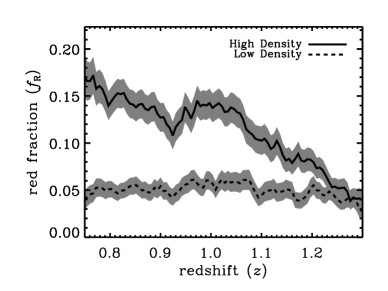
Within the DEEP2 sample, a bimodal distribution of galaxies in rest-frame color is clearly visible out to , with galaxies populating a relatively tight red sequence and a more diffuse blue cloud. Here, we compute the fraction of galaxies on the red sequence using the color divison defined by Eq. 19 of [Willmer et al. (2006)], where the red fraction within a given redshift and environment range is given by the number of galaxies redward of this relation in color divided by the total number of galaxies within the same bin of redshift and environment.
To study the evolution of the color-density relation with in detail, we divide the DEEP2 sample into thirds according to overdensity and compute as a function of redshift for the galaxies in the high-density and low-density extremes of the overdensity distribution, which minimizes cross-contamination. As illustrated in Fig. 1, the -overdensity relation shows a continuous evolution at , such that at the red fraction in low- and high-density regions are statistically consistent with each other. Extrapolating linear regression fits to the relations in high-density and low-density environments, we find convergence at . Tests utilizing mock galaxy catalogs show that this observed evolution is not due to any observational selection effect. Additionally, the results presented in Fig. 1 are unchanged when using highly disimilar sample selections and only minimally impacted by uncertainties due to cosmic variance.
The data presented in this proceeding consititute the first robust measurements of the color-density relation at , spanning environments from rich groups down to voids. We find that the clustering of galaxies at should depend only weakly on color. Furthermore, we conclude that the build-up of the red sequence is largely driven by galaxy environment, with the first galaxies quenching and moving on to the red sequence at . This epoch marks the birth of the red sequence, the point at which typical galaxies began quenching in significant number, while at earlier times the red galaxy population is comprised of only the extremely massive and rarest systems.
Acknowledgements.
This work was supported in part by NSF grant AST0507428.References
- [1]
- [Bell et al. (2004)] Bell, E. F. et al. 2004, ApJ, 609, 752
- [Cooper et al. (2005)] Cooper, M. C. et al. 2005, ApJ, 634, 833
- [Cooper et al. (2006a)] Cooper, M. C. et al. 2006, MNRAS, 370, 198
- [Cooper et al. (2006b)] Cooper, M. C. et al. 2006, MNRAS, submitted [astro-ph/0607512]
- [Gerke et al. (2006)] Gerke, B. F. et al. 2006, MNRAS, submitted [astro-ph/0608569]
- [Willmer et al. (2006)] Willmer, C. N. A. et al. 2006, ApJ, 647, 853