Near-Infrared Spectroscopy of Carbon-Enhanced Metal-Poor Stars. I.
A SOAR/OSIRIS Pilot Study
Abstract
We report on an abundance analysis for a pilot study of seven Carbon-Enhanced Metal-Poor (CEMP) stars, based on medium-resolution optical and near-infrared spectroscopy. The optical spectra are used to estimate [Fe/H], [C/Fe], [N/Fe], and [Ba/Fe] for our program stars. The near-infrared spectra, obtained during a limited early science run with the new SOAR 4.1m telescope and the Ohio State Infrared Imager and Spectrograph (OSIRIS), are used to obtain estimates of [O/Fe] and 12C/13C. The chemical abundances of CEMP stars are of importance for understanding the origin of CNO in the early Galaxy, as well as for placing constraints on the operation of the astrophysical s-process in very low-metallicity Asymptotic Giant Branch (AGB) stars.
This pilot study includes a few stars with previously measured [Fe/H], [C/Fe], [N/Fe],[O/Fe], 12C/13C, and [Ba/Fe], based on high-resolution optical spectra obtained with large-aperture telescopes. Our analysis demonstrates that we are able to achieve reasonably accurate determinations of these quantities for CEMP stars from moderate-resolution optical and near-infrared spectra. This opens the pathway for the study of significantly larger samples of CEMP stars in the near future. Furthermore, the ability to measure [Ba/Fe] for (at least the cooler) CEMP stars should enable one to separate stars that are likely to be associated with s-process enhancements (the CEMP-s stars) from those that do not exhibit neutron-capture enhancements (the CEMP-no stars).
1 Introduction
The large surveys for metal-poor stars conducted over the course of the past few decades (e.g., the HK survey of Beers and colleagues; Beers, Preston, & Shectman 1985, 1992; Beers 1999), and the Hamburg/ESO survey of Christlieb and collaborators (HES; Christlieb 2003) have revealed that a substantial fraction of Very Metal-Poor (VMP; [Fe/H] ) stars exhibit enhanced ratios of carbon, [C/Fe] (this fraction is currently estimated to be at least 20%, see Lucatello et al. 2006). This frequency appears to rise with declining [Fe/H]; Beers & Christlieb (2005) point out that 40% of stars with [Fe/H] , based on high-resolution analyses, have [C/Fe] +1.0, including the two known hyper metal-poor ([Fe/H] 5.0) stars, HE 01075240 (Christlieb et al. 2002) and HE 13272326 (Frebel et al. 2005). These Carbon-Enhanced Metal-Poor (CEMP) stars exhibit a wide variety of elemental abundance patterns (Beers & Christlieb 2005). The majority of CEMP stars (%) exhibit enhanced s-process elements (Aoki et al. 2006a), and are referred to as CEMP-s stars. Other CEMP stars exhibit strong enhancements of r-process elements (CEMP-r), or the presence of enhanced neutron-capture elements associated with both the r- and s-processes (CEMP-r/s). The class of CEMP-no stars comprises stars that, in spite of their large C (and often N and O) overabundances with respect to Fe, do not exhibit strong neutron-capture elements. Recently, CEMP stars have also been found with large enhancements of the alpha elements (Norris, Ryan, & Beers 2001; Aoki et al. 2002; Depagne et al. 2002), which Aoki et al. (2006b) refer to as CEMP- stars.
The astrophysical sites of carbon production in CEMP stars are the subject of much current observational and theoretical interest (Beers & Christlieb 2005; Ryan et al. 2005; Aoki et al. 2006a; Cohen et al. 2006; Johnson et al. 2006; Jonsell et al. 2006; Karlsson 2006; Sivarani et al. 2006; Wanajo et al. 2006). The carbon in the CEMP-s stars is very likely to have been produced by an intermediate-mass Asymptotic Giant Branch (AGB) companion that has transferred material to the presently observed star. The origin of the carbon in the other CEMP classes is not yet fully understood. The CEMP-no stars are of special interest, as it has been suggested that their C (as well as their N and O) may have been produced by a primordial population of massive (20 100), rapidly-rotating, mega metal-poor ([Fe/H] ) stars, which are predicted to have experienced significant mass loss (of CNO-enhanced material) via strong winds (Hirschi et al 2006; Meynet et al 2006). Aoki et al. (2006a) have shown that the CEMP-no stars are found preferentially at the lowest metallicities ( ), while the CEMP-s stars are generally found in the metallicity range 2.0. The CEMP-no stars exhibit quite low 12C/13C ratios (in the range 12C/13C ), indicating that a significant amount of mixing has occurred in their progenitor objects (Aoki et al. 2006a; Sivarani et al. 2006). Recently, Piau et al. (2006) have invoked processing by massive mega metal-poor progenitors in the early Galaxy to account for the apparent absence of Li in the main-sequence turnoff hyper metal-poor CEMP-no star HE 1327-2326. It is clear that the CEMP-no stars are of fundamental importance for understanding the early evolution of elements in the Galaxy.
In order to more fully test the association of CEMP-no stars with massive primordial stars, and to better explore the nature of the s-process in low-metallicity AGB stars, which is still rather poorly understood (Herwig 2005), we require measurements of the important elements C, N, and O for as large a sample of CEMP stars as possible. C and N can be measured from CEMP stars based on medium-resolution optical observations of molecular CH, C2, and CN features, while O remains a challenge, even at high spectral resolution. Most previous high-resolution observations of CEMP stars have relied on measurements of the O I 7774 Å triplet lines, which are strongly affected by NLTE effects (e.g., Asplund 2005). The most reliable oxygen abundances come from the forbidden [OI] 6300 Å line, but this feature is quite weak at low metallicities, and requires several hours of 8m-class telescope time per star in order to obtain a detection. An attractive alternative is provided by medium-resolution measurements of the strengths of the near-infrared first overtone ro-vibrational bands of CO at 2.3. Because the C abundances in CEMP stars exceed the O abundances, essentially all of the O is locked up in CO molecules; these lines thus provide a sensitive probe of the O abundance. In addition, the large separation of the 13CO lines from the 12CO lines at 2.3 provides a straightforward means to measure the important mixing diagnostic 12C/13C .
In this paper we present the results of a pilot study, based on a combination of medium-resolution optical and near-infrared spectroscopy, for a sample of seven CEMP stars, including several with previously available results from high-resolution spectroscopic studies. Similar optical spectra have already been obtained for several hundred stars selected on the basis of their carbon enhancement from the study of Christlieb et al. (2001). Roughly half of these stars appear to be likely CEMP stars (Goswami 2005; Goswami et al. 2006; Marsteller et al., in preparation). Near-infrared spectroscopy with SOAR/OSIRIS is expected to be obtained for many of the confirmed CEMP stars from this sample in the near future.
Section 2 describes the spectroscopic observations and data reduction procedures for our present study. In §3, we summarize the available photometry for our program stars. Section 4 describes determinations of model atmosphere parameters for our sample, and our techniques for deriving estimates of abundances for C, N, O, Ba, and the 12C/13C ratio based on our medium-resolution optical and near-infrared observations. Section 5 reports our results for stars with previous analyses. In §6 we present a brief discussion of these abundances in the context of previously observed CEMP stars. Plans for future studies of CEMP stars at moderate spectral resolution, in the optical and near-infrared, are described in §7.
2 Observations and Data Reduction
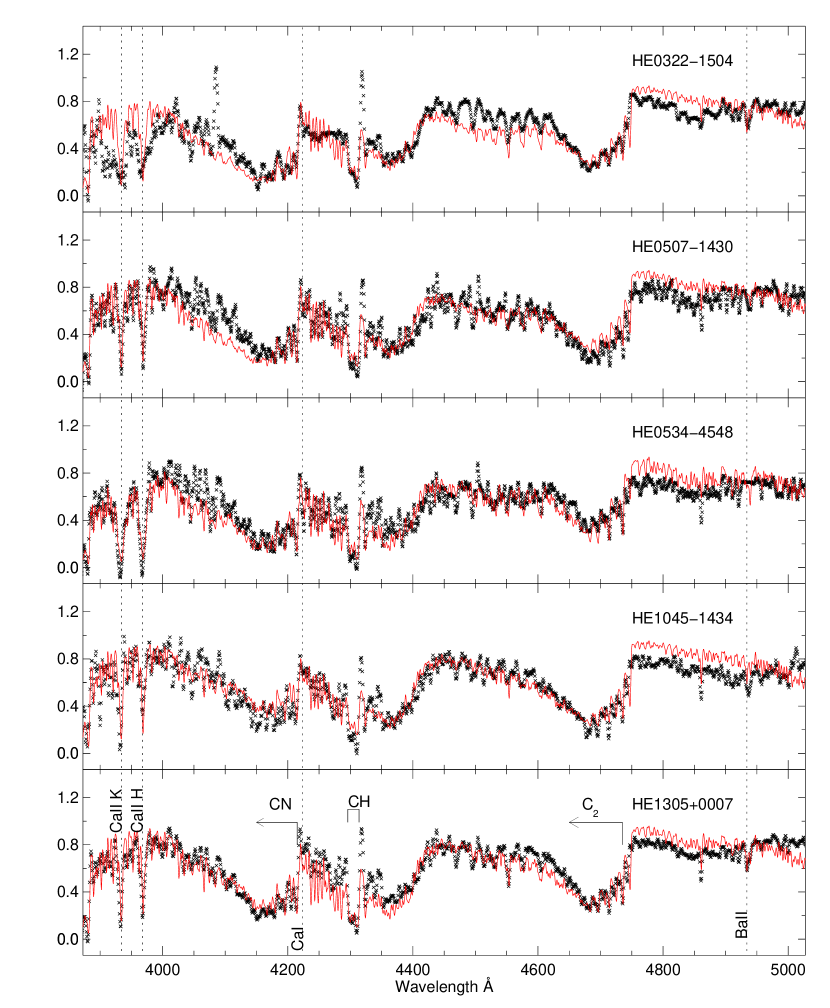
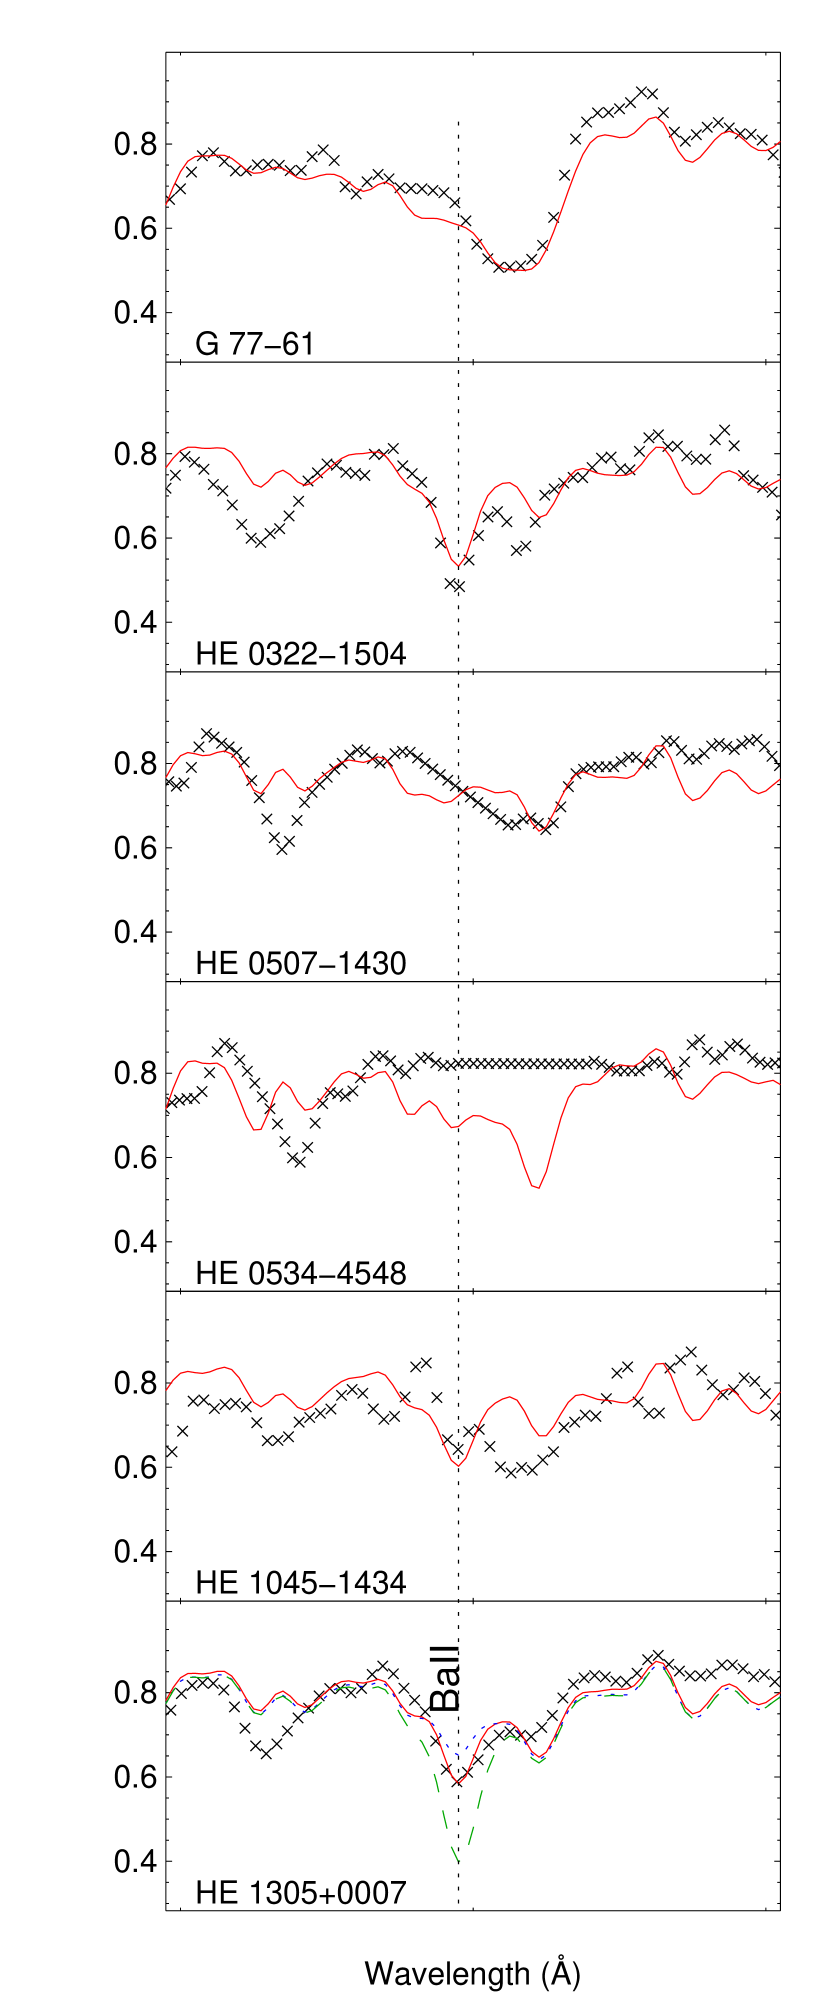
The medium-resolution optical spectra used in this study were obtained with the GOLDCAM spectrograph on the KPNO 2.1m and with the RC Spectrographs on the KPNO or CTIO 4m telescopes during the course of routine survey follow-up observations of metal-poor candidates from the HES. In all cases the resolving power of the spectra is . The spectra cover the wavelength range from 3700 to 5000 Å, although the signal-to-noise ratios drop precipitously at the blue end of the spectra (below 3800 Å). The optical spectra of our program stars selected from the HES are shown are shown in Figure 1, along with the best-fit models obtained from the synthetic spectra described below.
The near-infrared spectra were obtained with the new SOAR 4.1m telescope and the OSIRIS spectrograph (DePoy et al. 1993) during the limited amount of observing time set aside for early science programs with SOAR/OSIRIS during December 2005 and January 2006. The observing log for the near-infrared observations (including coordinates of the stars observed, date of observation, exposure times, and S/N ratio achieved) is provided in Table 1. We used the long slit and long camera (with focal ratio f/7), which provided a resolving power . Each star was observed on at least at two positions on the slit in order to measure and adequately substract the sky background. We also observed A0-type stars at the same airmass as the observations of the program objects in order to correct for the presence of telluric lines in the spectra. The total number of counts per pixel in each exposure were always kept well below the known non-linearity regime of the detector. Corrections for remaining small non-linearities in the detector counts, flat fielding, background substraction, spectrum extraction, wavelength calibration, telluric line subtraction, and continuum fitting were all accomplished using standard tasks within IRAF (and CTIO extensions to this package)111IRAF is distributed by the National Optical Astronomy Observatories, which is operated by the Association of Universities for Research in Astronomy, Inc. under cooperative agreement with the National Science Foundation..
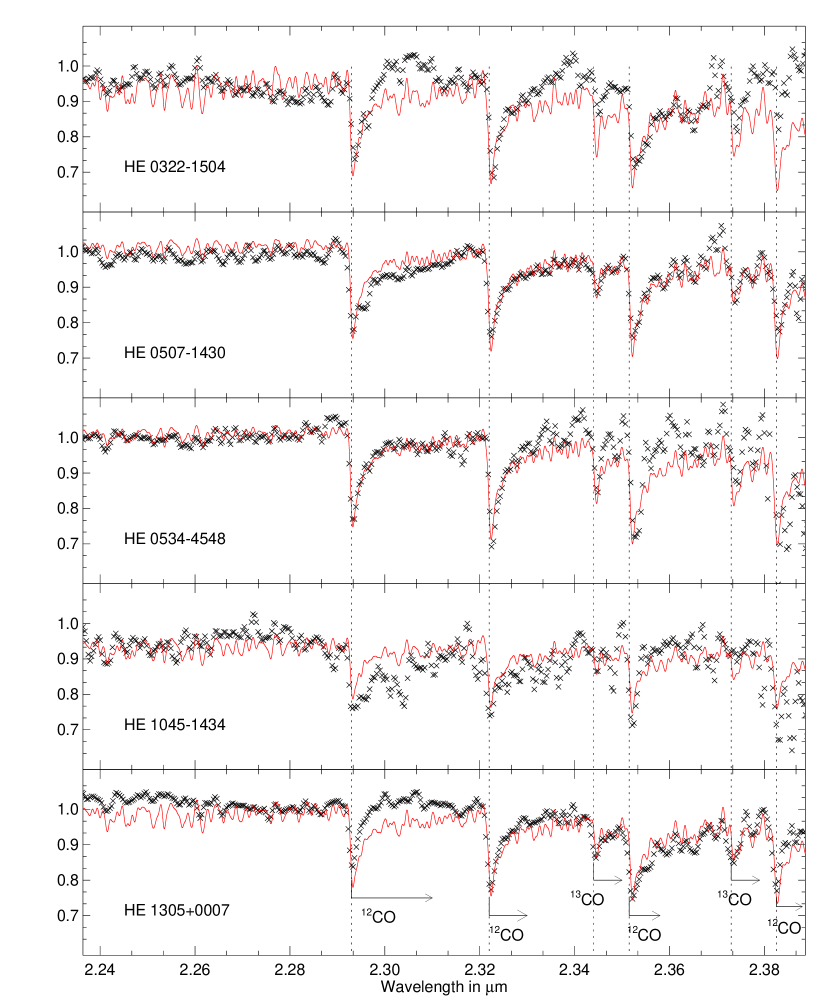
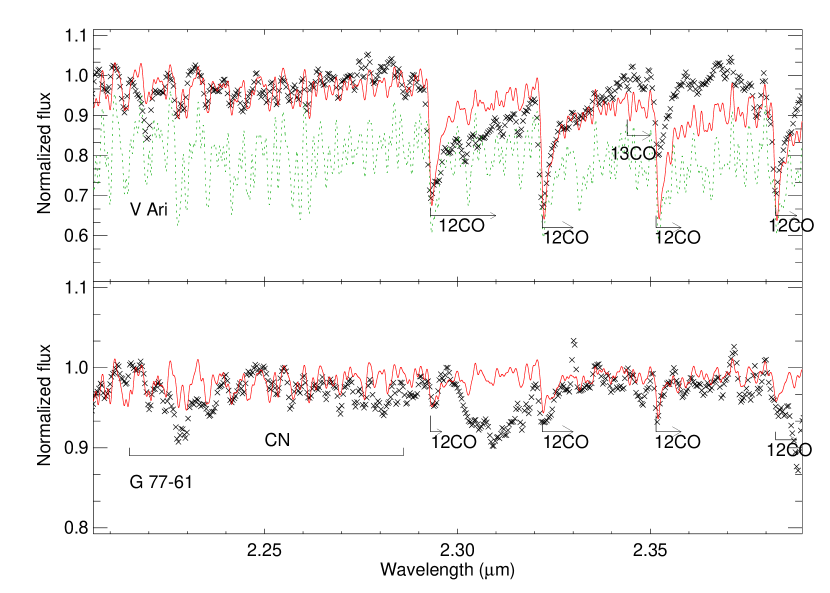
Figure 2 shows the near-infrared spectra of the HES stars in our program, along with the best-fit models obtained from the synthetic spectra described below. The near-infrared spectra for our other two program stars, V Ari and G 77-61, are discussed below.
3 Optical and Near-Infrared Photometry
Broadband photometry for the HES stars is listed in Table 2, adopted in part from Beers et al. (2006). For V Ari and G 77-61, the photometry is taken from the SIMBAD listing. Near-infrared photometry for all of our program objects is available from the 2MASS Point Source Catalog (Skrutskie et al. 2006). An estimate of the interstellar reddening along the line of sight to each star is obtained from Schlegel, Finkbeiner, & Davis (1998), which is also listed in Table 2. We also make use of Table 6 from Schlegel et al. (1998) to obtain the relative extinctions for various band passes.
4 Analysis
Below we describe the procedures employed in the analysis of our program stars. Briefly, the measured optical and infrared colors are used to derive estimates of the effective temperatures. The optical spectra are then used to estimate metallicities. Based on these estimates of and [Fe/H], theoretical evolutionary tracks for stars with these parameters are used to obtain estimates of surface gravity for each star. We then derive estimates of the CNO, 12C/13C , and Ba abundance from the optical and near-infrared spectra. Details are provided below.
4.1 Estimated Stellar Atmospheric Parameters
To obtain first-pass estimates of the effective temperatures for our program stars, we employ the Alonso, Arribas, & Martínez-Roger (1996) calibrations of with various colors. The results are listed in Table 3. The appropriate transformations between the different photometric systems necessary for use of the Alonso et al. calibrations are carried out as described in Sivarani et al. (2004). The -based temperature estimates are quite low, compared with those based on other colors, due to the strong effect of molecular carbon absorption on the -band flux. The -based temperature is expected to be superior, owing to the large leverage from the widely separated wavelengths of the bands involved, and because both the and bands are relatively free of potentially corrupting molecular carbon features. The colors from the synthetic carbon-enhanced models of Hill et al. (2000) also agree very well with the empirical color- relations obtained from the Alonso calibrations. In the application of the Alonso calibrations, we have adopted a metallicity of [Fe/H] for all of our program stars, with the exceptions of HE 0322-1504 and HE 0534-4548, for which we assume . Surface gravities, log , have been been estimated based on the Padova evolutionary tracks for metallicities [Fe/H] and [Fe/H] (Girardi et al. 2000; Marigo et al. 2001). For reference, the next to last column of Table 3 lists the atmospheric parameters obtained by previous analyses based on high-resolution spectroscopy. The final column of Table 3 lists our adopted atmospheric parameters. The initial [Fe/H] estimates, as described below, are used for the selection of the appropriate model atmospheres.
Initial metallicities are estimated from the calibration of the variation of the Ca II KP index with de-reddened color described by Rossi et al. (2005). These estimates are indicated as [Fe/H]I in the second column of Table 3. We did not have a medium-resolution spectrum of V-Ari, so we have adopted the literature value of [Fe/H] (from Kipper & Kipper 1990) in this case. Also note that the color of G 77-61 lies just outside the color region over which the Rossi et al. calibration is defined, so the value derived as a first guess is somewhat uncertain.
Refined estimates of metallicities are then estimated, based on fits of synthetic spectra to the medium-resolution optical spectra. We begin with a fit to the Ca II K and H lines, and then carry out a cross-check by fitting the Ca I 4227 Å line and the weak Fe I feature at 4938 Å (which is a blend of the Fe I 4938.82 Å and 4939.69 Å lines). Most of the time the estimates obtained in this manner agree well with one another. In the case of HE 0534-4548 we had to increase the value of log to consistently match the Ca II K line and the Ca I 4227 Å lines. Thus, this simultaneous fit procedure provides an additional check on the adopted surface gravity. The microturbulence velocity is taken to be 2 , which is often assumed for such cool, C-rich stars. In any case, we have no means of estimating a value for the microturbulence velocity based on medium-resolution spectroscopic data; its effect on the derived abundances is expected to be minimal, based on previous high-resolution work (e.g., Aoki et al. 2006a). The adopted estimate of [Fe/H] is indicated as [Fe/H]A in the third column of Table 3. Note that our adopted metallicity estimate is typically 0.4-0.6 dex more metal-rich than the initial estimate obtained from the Rossi et al. (2005) calibration, indicating that this calibration could still be improved upon.
4.2 Model Atmospheres and Adopted Linelists
We use the NEWODF ATLAS9 models (with no overshoot; Castelli & Kurucz 2003) as a starting model for our syntheses, from which first-pass estimates of the CNO are obtained. We next generate new models with the appropriate CNO enhancement, using a version of ATLAS12 (Kurucz 1996) that runs under Linux (ported to Linux from the original VAX version by Sbordone et al. 2004). For the synthesis we use atomic linelists mainly from the VALD database. The CH and CN molecular linelist compiled by Plez (see Plez & Cohen 2005) is employed. The NH and C2 molecular linelists are taken from the Kurucz database (http://kurucz.harvard.edu/linelists/linesmol/). In the model calculations and the abundance analysis we employ the solar abundance values from Asplund, Grevesse, & Sauval (2005). For the optical synthesis we use the current version of the spectrum synthesis code turbospectrum (Alvarez & Plez 1998). For the K-band synthesis we use the SYNTHE code (Kurucz 1993). We use the CH, CN, C2 and CO linelists in the Kurucz database for the synthesis of the near-infrared spectra.
4.3 Determination of Abundance Ratios
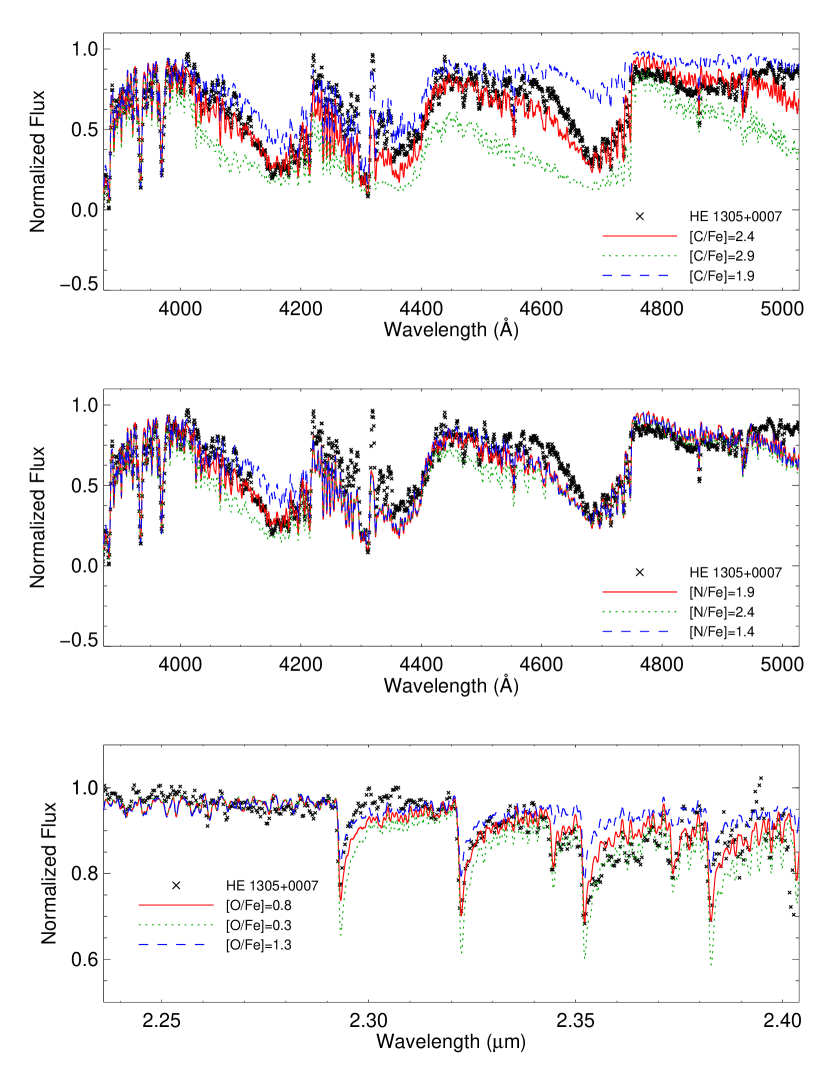
Carbon abundances for our program stars are derived from the C2 swan bands at 4736 Å. We did not make use of the CH features, since they are heavily saturated in these cool stars. Spite et al. (2005) noted that one can obtain a difference of about 0.2 dex in the derivation of C abundances between estimates based on the CH and C2 features. In Figure 3a we illustrate the sensitivity of the optical spectra to variations in the adopted [C/Fe]. As can be seen in this Figure, the optical C2 features are extremely sensitive to relatively small variations in the carbon abundance. Although the CN features also change due to variations in adopted [C/Fe], we choose to employ the C2 features for deriving estimates of the carbon abundance. Note that the region surrounding the CaII K line is relatively insensitive to variations of [C/Fe], although for extremely carbon-rich stars this still may have some effect on metallicity estimates based on the strength of CaII K (due to suppresion of the local continuum; see Cohen et al. 2005). As a result, best results for metallicity estimates of CEMP stars obtained from medium-resolution optical spectra should be based on spectral synthesis calculations.
Nitrogen abundances are derived from the CN band located at 4215 Å; as a cross-check we also attempt to match the CN bandhead at 3883 Å . Unfortunately, the 3883 Å bandhead is heavily saturated at the very blue end of our wavelength coverage, so this is only used as a consistency check. In Figure 3b we illustrate the effect of variations in adopted [N/Fe] on the optical spectra. The 4215 Å CN feature is sensitive to the N abundance, however it is also quite sensitive to the C abundance. Our spectral coverage does not extend blue enough to make use of the NH feature at 3360 Å for estimation of the N abundance (e.g., see Johnson et al. 2006). The 3883 Å CN feature bandhead is saturated, and the wings are just at the blue end of our data, where we encounter problems with the fit of the continuum. For these reasons, we only make use of the 4215 Å CN feature for estimation of the N abundances for our program stars.
We estimate O abundances for our program stars from the near-infrared spectra, based on the CO features at 2.3. The C and N abundances derived from the optical spectra are fixed in order to obtain our first-pass estimates of O from the near-infrared spectra. Figure 3c illustrates the sensitivity of the CO features in the near-infrared to variations in the O abundance. Once we estimate the O abundances we revisit the C and N abundance estimates, since the C abundance can, in principle, depend on the O abundance as a result of the formation of CO molecules. Apart from the continuum absorption due to CN, there also CN molecular line features around 2.3, which provide additional checks on the C and N abundances derived from the optical spectra. For V Ari (for which we do not have an optical spectrum available), as well as for G 77-61 (for which we could not obtain satisfactory fits to the C and N features), we employ C and N abundances taken from the literature for estimation of the O abundances.
The isotope ratio 12C/13C can be derived from the optical spectra using the 12C2 bandhead at 4736 Å and the 12C13C bandhead at 4745 Å. In many of our program stars the 12C2 bandhead at 4736 Å is saturated, and leads to a large derived 12C/13C . For this reason, we prefer to adopt values for 12C/13C based on analysis of the near-infrared spectra, when possible. In the near-infrared, we derive 12C/13C from the 12CO and 13CO lines, which provide superior estimates of this ratio than we are able to obtain from the optical spectra, as long as the quality of the data is sufficient.
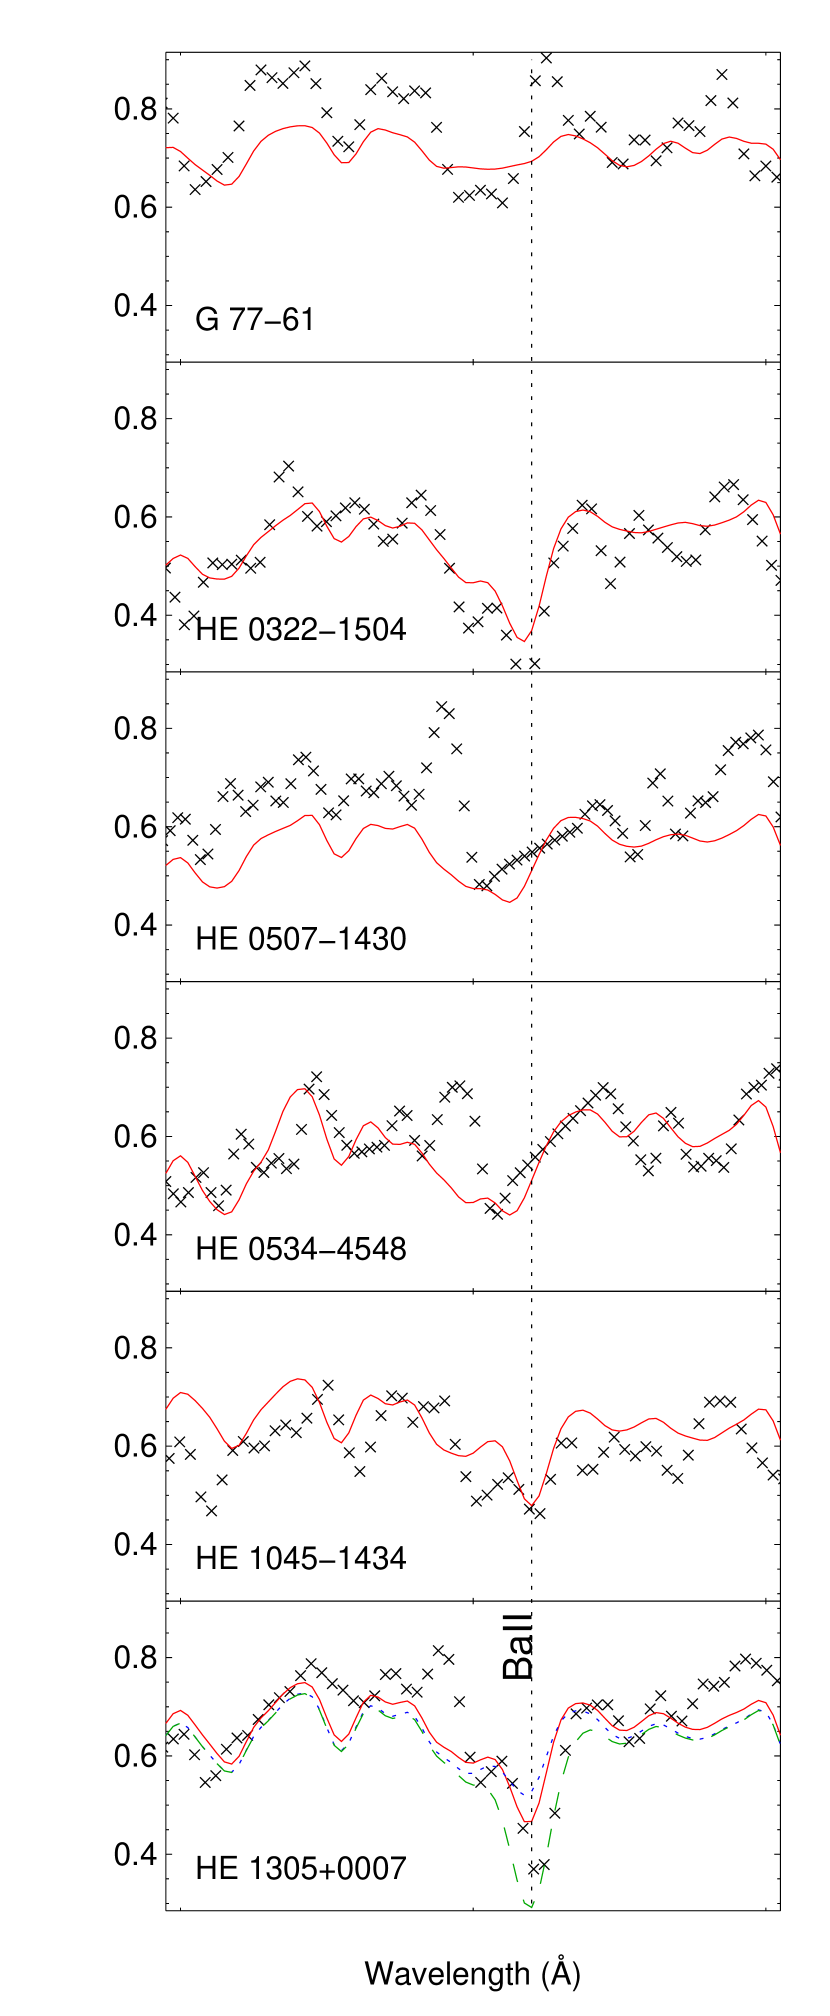
For the cool CEMP stars that comprise our pilot study, it is often possible to detect the strong lines arising from Ba II. Barium abundances are estimated from the 4554 Å and 4934 Å Ba II lines. The 4554 Å Ba II lines are blended with C2 lines, while the 4934 Å lines are less affected by C2 bands. Examples of the Ba II fits with synthetic spectra are shown in Figure 4.
4.4 Uncertainities in Derived Elemental Abundances and in 12C/13C
The error in the derived C abundance depends on a number of factors, including the uncertain placement of the pseudo-continuum, and the effects of errors in estimated , log , the microturbulence velocity , as well as in the adopted O abundance. Previous high-resolution spectroscopic studies (e.g., Hill et al. 2000; Goswami et al. 2006) have indicated that the errors in derived estimates based on are often less than 100 K. If we simply adopt a temperature error of 100 K, we find that variations at this level only contribute to a change in the derived C abundance of 0.05 dex. The C2 features in our optical spectra, which are our primary indicators of C abundance, are very sensitive to errors in the surface gravity. As mentioned in §4.1 above, we do not obtain our estimate of log from the spectra themselves, but rather, from theoretical isochrones. Hence, one must be aware that any systematic errors in these models will propogate into systematic errors in our analysis. If we adopt an error for log of 0.5 dex, this corresponds to changes in [C/Fe] by 0.2 dex. Microturbulence appears to have only a very minor effect on the C2 features of our moderate-resolution spectra. Changes in of 1 lead to only a 0.01 dex alteration in the derived C abundance. As discussed below, our expected error in [O/Fe] determination is 0.22 dex. This error influences the derived error in [C/Fe], due to the need to correct for CO formation. It is a relatively minor effect – changes on the O abundance by 0.2 dex result in changes in the C abundance by 0.05 dex. The error in [C/Fe] arising from pseudo-continuum placement of the optical spectra is about 0.2 dex. However, since we also make use of the near-infrared CN features as a cross-check on the C and N abundances obtained from the optical spectra, this effect should be minimized (the pseudo-continuum in the near-infrared is much more evident). Taken as a whole, we expect that the above errors give rise to a total error on [C/Fe] of 0.35 dex.
The derived [N/Fe] abundance depends on all the factors mentioned for [C/Fe], and also depends on the [C/Fe] values. The total errors we estimate for [N/Fe] are on the order of dex.
The derived [O/Fe] abundances can depend on errors in the determination of , log , and [C/Fe]. However, since all of our program stars are C-rich (C/O 1), the CO features are not sensitive to the [C/Fe] values. The primary source of error arises from sensitivity of the CO line strengths to log . We find that changes on the order of 0.5 dex in log can give rise to changes in the derived [O/Fe] on the order of dex. The total errors we estimate for [O/Fe] are on the order of 0.2 dex.
The 12C/13C ratio does not depend on any of the stellar parameters, however it enters through saturation of the 12C2 and 12CO features. The 12CO features are rarely saturated for such metal-poor stars as are included in our program. The primary source of error in the estimation of 12C/13C from the near-infrared spectra comes from poor S/N. We estimate an error in the 12C/13C of 2 at the typical S/N ratio of our spectra.
The errors in our derived Ba abundances that arise due to blending with C2 features can be as large as 0.3 dex. The errors due to uncertainties in and log can lead to changes of about 0.2 dex in our estimated Ba abundances. Hence, the total errors in derived Ba abundances based on our medium-resolution spectra can be as large as 0.4-0.5 dex. This is still of sufficient accuracy to at least differentiate between CEMP-s and CEMP-no stars, as the CEMP-s stars typically exhibit [Ba/Fe] +1.0.
We summarize the effects described above in Table 5. The source of each uncertainty is listed in the first column, while its affect on the derived elemental abundance or isotope ratio is listed in each of the remaining columns. The total estimated uncertainty, obtained from the addition (in quadrature) of each component of the error, is listed in the final row of this Table.
5 Results for Stars with Previous Analyses
5.1 V Ari
V Ari is a late-type classical CH star, with C and N enhancements, as well as s-process enhancement, indicating that it likely underwent binary mass transfer from an AGB companion (Kipper & Kipper 1990; Sleivyte & Bartkevicius 1990). Van Eck et al. (2003) reported a large enhancement of Pb in this star, similar to many other recently observed CEMP-s stars. Kipper & Kipper (1990) derived [C/Fe] = +2.1 and [N/Fe] = +1.5, based on fits to the violet C2 and CN features, respectively, adopting model atmospheres with parameters = 3500 K, log = 0.5, and = .
If we adopt the above atmospheric parameters and C and N abundances, we derive an O abundance of [O/Fe] = +1.3 for V Ari from our near-infrared spectra. However, the fit we obtain is not very satisfactory. We suspect that the C abundance derived by Kipper & Kipper (1990) is too high, since several of the synthetic CN features in the K-band region appear too strong for their estimated C abundance. Note that Kipper & Kipper assumed a solar O abundance in order to derive their C,N abundances, a value that is 20 times lower than our estimate of [O/Fe], assuming their other parameters are correct. If we adopt their suggested C abundance, we also obtain a very high value for the carbon isotope ratio, 12C/13C 1000. Such high values of this ratio were also found by previous investigations for V Ari and TT CVn (Aoki & Tsuji 1997), a star thought to be similar to V Ari. However, CEMP stars reported in the literature that have abundance estimates based on high-resolution spectroscopy exhibit a range of 12C/13C between 4 and 100; most have a value around 10. Hence, we explored changing the C and N abundances, rather than adopting the values given by Kipper & Kipper (1990), in order to better fit the near-infrared CN and CO features. From this exercise, we obtain [C/Fe] = +1.5, [N/Fe] = +1.2, and [O/Fe] = +0.2. We then obtain a 12C/13C = 90, which is consistent with some previously studied CEMP stars. The high values for 12C/13C in the literature may be due to the fact that the 12C2 features are heavily saturated, which is often the case for such low stars. However, our derived 12C/13C for V Ari is still higher than that found in most CEMP stars, especially considering the fact that the star is a giant, and one might expect lower values for 12C/13C due to mixing with CN-processed material. One possible explanation could be that the surviving companion of V Ari has evolved into the giant stage, and gone through third dredge-up. This would help to explain the high 12C/13C , which is similar to other intrinsic AGB stars. However, Wannier et al.(1990) do not find any CO J(1-0) emission or infrared excess, which is observed in most mass-losing AGB stars.
Figure 5a compares the observed near-infrared spectrum of V Ari with that of a synthetic spectrum generated from the Kipper & Kipper (1990) values for the C and N abundances. Clearly, the synthetic spectrum exhibits substantially stronger CN than does the observed spectrum; the continuum of the near-infrared synthetic spectrum in this region is strongly depressed by the presence of the CN. Note that the CO bandhead strengths are not as greatly affected. When we decrease the C abundance the synthetic spectrum matches the observed spectrum much better. The CN features are weaker and the continuum level is better matched. However, it is still the case that that the observed and synthetic spectra do not match as well as for our other stars, which could indicate that there remain significant errors in the estimated stellar parameters for V Ari, and/or in the models from which the synthetic spectra were generated.
5.2 G 77-61
We initially adopted the C and N abundances for this star reported by Plez, Cohen & Melendez (2005), and obtained an estimate of the O abundance for G 77-61 of [O/Fe] = +1.8, which is in fair agreement with their value ([O/Fe] = +2.2), to within the expected errors. Plez et al. used higher resolution near-infrared spectra than we have available (), but they only fit a single CO bandhead. We fit three bandheads of CO lines in the K-band (see Figure 5b), and also obtain a reasonably good fit for some of the CN features. It should also be noted that somewhat different model atmospheres than ours were adopted for their study. Our estimate of 12C/13C = 5, based on the optical spectrum for this star (the near-infrared spectrum of this star has quite weak CO features, and is of insufficient S/N), agrees well with the ratio obtained by Plez & Cohen (2005). Our estimate of the Ba abundance for G 77-61, [Ba/Fe] , is consistent with the upper limit of [Ba/Fe] obtained by these same authors.
5.3 HE 1305+0007
This star has been studied at high resolution in the optical by Goswami et al. (2006). These authors employed atmospheric parameters = 4750 K, log = 2.0 and [Fe/H] = 2.0. Their effective temperature and surface gravity estimates were set based on the excitation balance and ionization equilibrium, respectively, from on analysis of the detected Fe I and Fe II lines in their spectrum. Our estimate of effective temperature, based on the color (Teff = 4560 K), is 200 K lower than theirs. At least half of the discrepancy between our lower metallicity estimate for this star, [Fe/H] = , can be accounted for by differences in the adopted temperature. If we adopt the Goswami temperature estimate instead, we obtain a metallicity estimate of [Fe/H] . Goswami et al. (2006) found this star to be enriched in Pb and other s-process elements. We estimate a Ba abundance from the Ba II 4934 Å line of [Ba/Fe] = +2.9, which is 0.6 dex higher than that found by Goswami et al. (2006), but is roughly consistent within the expected errors of our procedure (see above).
6 Discussion
The CNO abundance determinations, along with the 12C/13C and Ba abundances, provide sufficient information to at least make a preliminary classification of the stars in our pilot sample. It should be kept in mind that all of our program objects, with the exception of G 77-61, are giants, hence they have almost certainly undergone mixing processes that would have diluted material in the outer envelope with gas that has undergone (at least) CN processing. This means that the presently observed abundances of C and N, as well as the 12C/13C ratio, may have been altered from their values prior to undergoing mixing. Any of the stars that acquired material as a result of mass transfer from an AGB companion are also expected to have undergone some amount of “evolutionary dilution” (Lucatello et al. 2006), which would result in a net reduction of the CNO and Ba abundances they received from their companion. For the purpose of the following discussion, we have not included the (possibly large) effects of NLTE or 3D atmospheric models on the derived abundances of the light elements (see Asplund 2005).
6.1 Nitrogen and Oxygen Abundances, and 12C/13C Measurements
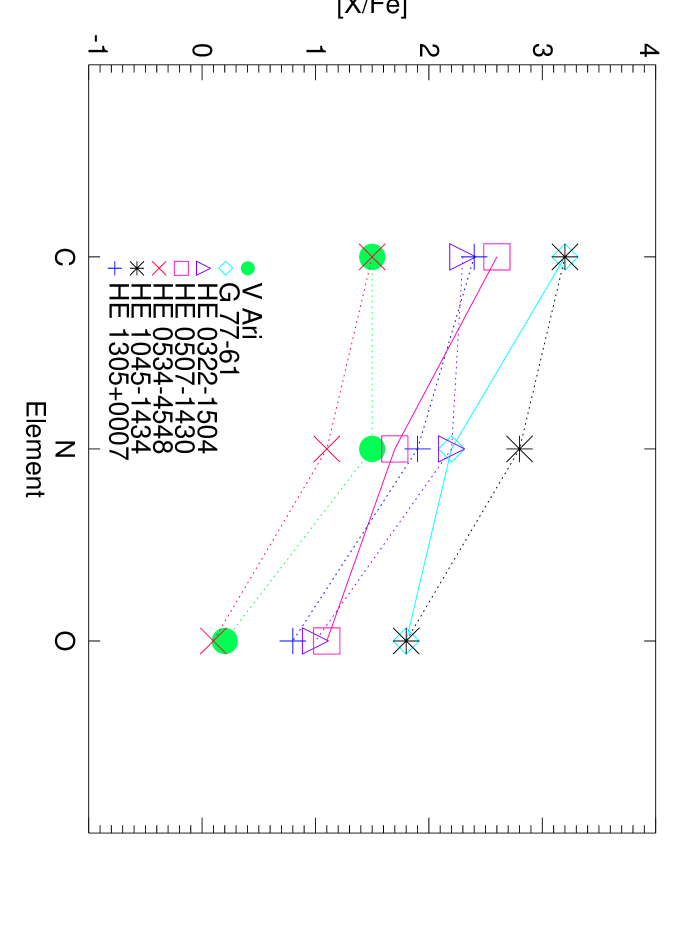
For our program stars, [C/Fe] always exceeds [N/Fe]. At present, the number of stars known where [N/Fe] exceeds [C/Fe] is quite small (see the discussion by Johnson et al. 2006). The [C/N] ratios of our program stars all fall at or below +1.0; the lowest are V Ari and HE 0322-1504, with [C/N] = 0.0 and +0.1, respectively. These values are in the range that is often found for CEMP stars (see, e.g., Figure 6 of Johnson et al. 2006). The models of AGB synthesis provided by Herwig (2004) indicate that, if the origin of our program stars is associated with mass transfer from very metal-poor AGB stars, these progenitors would be of intermediate mass ( 3-6 M⊙).
Only a small number of CEMP stars have measured O abundances reported in the literature, owing to the difficulties of making this measurement, even at high-resolution, in the optical spectra of such objects. This is particularly true for the cooler stars we have considered in our pilot sample, as the low temperatures enhance the strength of the molecular bands associated with carbon. Thus, it is difficult to put our present measurements into a larger context; this will have to wait for the assembly of a sufficiently large sample of CEMP stars with available O measurements in the near future. The measurements we have carried out from our near-infrared spectra demonstrate that [O/Fe] is strongly correlated with [C/Fe]; see Figure 6. This behavior is consistent with that expected if the envelope material has been accreted from an AGB companion that has undergone third dredge-up mixing. The abundances range from a low value of [O/Fe] = +0.1 (HE 0534-4548) to a high of [O/Fe] = +1.8 (G 77-61). These values all fall in the range which Sivarani et al. (2006) associate with non Hot Bottom Burning (non-HBB), low mass (0.8-3.0 M⊙), VMP AGB stars.
The carbon isotope measurements, with the exception of the large value for V Ari ( 12C/13C = 90) and the intermediate value for HE 1045-1434 ( 12C/13C = 20), are all quite low, 12C/13C . Such values are often found in CEMP stars of various classes (see the compilation in Table 4 of Sivarani et al. 2006), and may be driven primarily by the extent that mixing processes have altered the observed surface isotopic ratio. The higher measured [C/Fe] and the intermediate 12C/13C for HE 1045-1434, as compared to the other stars studied here, indicates that less dilution and CN processing has occured during its giant-branch phase.
6.2 The CEMP-s Stars
Five of the seven stars (the exceptions being G 77-61 and HE 0534-4548) have large [Ba/Fe] ratios, consistent with their identification as CEMP-s stars. Aoki et al. (2006a) report that 80% of their large sample of CEMP stars can be classified as CEMP-s, and are likely to be associated with AGB mass transfer to the presently observed companion star. The CNO abundances of these stars, discussed above, are consistent with origin in intermediate-mass non-HBB AGB stars. The CEMP-s stars include, as a subclass, the so-called lead (Pb) stars. From the high-resolution study of HE 1305+0007 by Goswami et al. (2006), we are aware that this star from our program is a member of this class. High-resolution spectroscopic observations of the rest of the stars in our pilot sample will be required in order to check if there are additional members of this class in our sample. HE 1305+0007 has also been shown by Goswami et al. (2006) to be a CEMP-r/s star, a group of stars that exhibit large enhancements of elements associated with the r-process, in addition to s-process enhancements (see Beers & Christlieb 2005, and references therein).
6.3 The CEMP-no Stars
G 77-61 and HE 0534-4548 exhibit significantly lower [Ba/Fe] than found for the CEMP-s stars in our program. We only have an upper limit on the [Ba/Fe] for G 77-61, so it remains possible that it satisfies the Beers & Christlieb (2005) definition for CEMP-no stars ([Ba/Fe] ), while HE 0534-4548 might be considered a Ba-mild star, since its [Ba/Fe] is above solar ([Ba/Fe] ), but clearly lower than the [Ba/Fe] ratios of the CEMP-s stars in our sample. The [Ba/Fe] ratio for this star should be confirmed by additional high-resolution spectroscopic observations. As mentioned in the introduction, the CEMP-no stars are of particular interest, since they may be associated with massive mega metal-poor progenitors, rather than AGB stars.
7 Future Studies
This paper has presented an analysis of medium-resolution optical and near-infrared spectroscopy for a small number of CEMP stars. We have demonstrated that this approach is capable of obtaining measurements of the critical elemental abundances needed to discriminate CEMP-s stars from CEMP-no stars in an efficient manner. It is our intention to obtain a greatly expanded set of near-infrared spectroscopy with the SOAR 4.1m telescope for on the order of 100 CEMP stars, including a larger number of stars with previous high-resolution data available, in the near future. Optical medium-resolution spectroscopy for this sample is already available. The availability of [Fe/H], [C/Fe], [N/Fe], [O/Fe], 12C/13C , and [Ba/Fe] for such a large sample will provide data (in particular for O and the 12C/13C ) that complements available high-resolution studies, and will also identify stars of particular interest for future inspection at high spectral resolution.
References
- Alonso, Arribas, & Martínez-Roger (1996) Alonso, A., Arribas, S., & Martínez-Roger, C. 1996, A&A, 313, 873
- Alvarez & Plez (1998) Alvarez, R., & Plez, B. 1998, A&A, 330, 1109
- Aoki & Tsuji (1997) Aoki, W., & Tsuji, T. 1997, A&A, 317, 845
- Aoki et al. (2002) Aoki, W., Norris, J. E., Ryan, S. G., Beers, T. C., & Ando, H. 2002, ApJ, 576, L141
- Aoki et al. (2006a) Aoki, W., Beers, T.C., Christlieb, N., Norris, J.E., Ryan, S.G., & Tsangarides, S. 2006a, ApJ, in press (astro-ph/0609702)
- Aoki et al. (2006b) Aoki, W., Bisterzo, S., Gallino, R., Beers, T.C., Norris, J.E., Ryan, S.G., & Tsangarides, S. 2006b, ApJ, 650, L127
- Asplund (2005) Asplund, M. 2005, ARA&A, 43, 481
- Asplund, Grevesse and Sauval (2005) Asplund M., Grevesse N., & Sauval, A.J. 2005, EAS Publications Series, 17, p. 21
- Beers (1999) Beers, T. C. 1999, in The Third Stromlo Symposium: The Galactic Halo, eds. B. Gibson, T. Axelrod, & M. Putman, ASP Conf. Ser., 165, p. 202
- Beers & Christlieb (2005) Beers, T. C., & Christlieb, N. 2005, ARA&A, 43, 531
- Beers et al. (1985) Beers, T.C., Preston, G.W., & Shectman, S.A. 1985, AJ, 90, 2089
- Beers et al. (1992) Beers, T. C., Preston, G. W., & Shectman, S. A. 1992, AJ, 103, 1987
- Beers et al. (2006) Beers, T.C., Flynn, C., Rossi, S., Christlieb, N., Sommer-Larsen, J., Wilhelm, R., Marsteller, B., Lee, Y., De Lee, N., Deliyannis, C., Zickgraff, F.-J., Holmberg, J., Önehag, A., Eriksson, A., Terndrup, D., Salim, S., Frebel, A., & Rhee, J. 2006, ApJS, in press (astro-ph/0610018)
- Castelli & Kurucz (2003) Castelli, F., & Kurucz, R. L. 2003, in IAU Symposium 210, “Modelling of Stellar Atmospheres,” 20, Eds. N. Piskunov, W.W. Weiss, & D.F. Gray, Astronomical Society of the Pacific, p. 20
- Christlieb (2003) Christlieb, N. 2003, Reviews in Modern Astronomy, Vol 16, ed. R. Schielicke (Wiley-VCH, Berlin), 191
- Christlieb et al. (2002) Christlieb, N., Bessell, M. S., Beers, T. C., Gustafsson, B., Korn, A., Barklem, P. S., Karlsson, T., Mizuno-Wiedner, M., & Rossi, S. 2002, Nature, 419, 904
- Cohen et al. (2005) Cohen, J.G. et al., 2005, ApJ, 633, L109
- Cohen et al. (2006) Cohen, J. G., et al. 2006, AJ, 132, 137
- Depagne et al. (2002) Depagne, E., Hill, V., Spite, M., Spite, F., Plez, B., Beers, T.C., Barbuy, B., Cayrel, R., Andersen, J., Bonifacio, P., Francois, P., Nordström, B., & Primas, F. 2002, A&A, 390, 187
- Depoy et al. (1946) DePoy, D.L., Atwood, B., Byard, P., Frogel, J.A., & O’Brian, T. 1993, in SPIE 1946, “Infrared Detectors and Instrumentation,” p. 667
- Frebel et al. (2005) Frebel, A., Aoki, W., Christlieb, N., Ando, H., Asplund, M., Barklem, P. S., Beers, T. C., Eriksson, K., Fechner, C., Fujimoto, M. Y., Honda, S., Kajino, T., Minezaki, T., Nomoto, K., Norris, J. E., Ryan, S. G., Takada-Hidai, M., Tsangarides, S., & Yoshii, Y. 2005, Nature, 434, 871
- Girardi et al. (2000) Girardi, L., Bressan, A., Bertelli, G., & Chiosi, C. 2000, A&AS, 141, 371
- Goswami (2005) Goswami, A. 2005, MNRAS, 359, 531
- Goswami et al. (2006) Goswami, A., Aoki, W., Beers, T.C., Christlieb, N., Norris, J.E., Ryan, S.G., & Tsangarides, S. 2006, MNRAS, 372, 343
- Herwig (2004) Herwig, F. 2004, ApJS, 155, 651
- Herwig (2005) Herwig, F. 2005, ARA&A, 43, 435
- Hill et al. (2000) Hill, V., Barbuy, B., Spite, M., Spite, F., Cayrel, R., Plez, B., Beers, T. C., Nordström, B., & Nissen, P. E. 2000, A&A, 353, 557
- Hirschi et al. (2006) Hirschi, R., Fröhlich, C., Liebendörfer, M., & Thielemann, F.-K. 2006, in Reviews of Modern Astronomy 19, in press (astro-ph/0601502)
- Johnson et al. (2006) Johnson, J.A., Herwig, F., Beers, T.C., & Christlieb, N. 2006, ApJ, in press (astro-ph/0608666)
- Jonsell et al. (2006) Jonsell, K., Barklem, P. S., Gustafsson, B., Christlieb, N., Hill, V., Beers, T. C., & Holmberg, J. 2006, A&A, 451, 651
- Karlsson (2006) Karlsson, T. 2006, ApJ, 641, 41
- Kipper & Kipper (1990) Kipper, T. A., & Kipper, M. A. 1990, Pis ma Astronomicheskii Zhurnal, 16, 1113
- Kurucz (1993) Kurucz, R. L. 1993, CD-ROM, 15
- Kurucz (1996) Kurucz, R. L. 1996, IAU Symposium 176,“ Stellar Surface Structure,” eds. K.G. Strassmeier & J.L. Linsky, Kluwer Academic Publishers, p. 523
- Lucatello et al. (2006) Lucatello, S., Beers, T.C., Christlieb, N., Barklem, P.S., Rossi, S., Marsteller, B., Sivarani, T., & Lee, Y. 2006, ApJ, 652, L37
- Marigo et al. (2001) Marigo, P., Girardi, L., Chiosi, C., & Wood, P. R. 2001, A&A, 371, 152
- Masseron et al. (2006) Masseron, T., Van Eck, S., Famaey, B., Goriely, S., Plez, B., Siess, L., Beers, T.C., Primas, F., & Jorissen, A., A&A, 455, 1059
- Meynet et al. (2006) Meynet, G., Ekström, S., & Maeder, A. 2006, A&A, 447, 623
- Norris et al. (2001) Norris, J.E., Ryan, S.G., & Beers, T.C. 2001, ApJ, 561, 1034
- Piau et al. (2006) Piau, L., Beers, T. C., Balsara, D. S., Sivarani, T., Truran, J. W., & Ferguson, J. W. 2006, ApJ, in press (astro-ph/0603553)
- Plez & Cohen (2005) Plez, B., & Cohen, J. G. 2005, A&A, 434, 1117
- Plez et al. (2005) Plez, B., Cohen, J. G., & Meléndez, J. 2005, in IAU Symposium 228, “From Lithium to Uranium: Elemental Tracers of Early Cosmic Evolution”, eds. Hill, V., Francois, P., & Primas, F., Cambridge University Press, p. 267
- Rossi et al. (2005) Rossi, S., Beers, T. C., Sneden, C., Sevastyanenko, T., Rhee, J., & Marsteller, B. 2005, AJ, 130, 2804
- Ryan et al. (2005) Ryan, S. G., Aoki, W., Norris, J. E., & Beers, T. C. 2005, ApJ, 635, 349
- Sbordone et al. (2004) Sbordone, L., Bonifacio, P., Castelli, F., & Kurucz, R. L. 2004, Memorie della Societa Astronomica Italiana Supplement, 5, 93
- Schlegel et al. (1998) Schlegel, D. J., Finkbeiner, D. P., & Davis, M. 1998, ApJ, 500, 525
- Sivarani et al. (2004) Sivarani, T., Bonifacio, P., Molaro, P., Cayrel, R., Spite, M., Spite, F., Plez, B., Andersen, J., Barbuy, B., Beers, T. C., Depagne, E., Hill, V., François, P., Nordström, B.,& Primas, F. 2004, A&A, 413, 1073
- Sivarani et al. (2006) Sivarani, T., Beers, T. C., Bonifacio, P., Molaro, P., Cayrel, R., Herwig, F., Spite, M., Spite, F., Plez, B., Andersen, J., Barbuy, B., Depagne, E., Hill, V., François, P., Nordström, B.,& Primas, F. 2006, A&A, 459, 125
- (49) Skrutskie, M.F., et al. 2006, AJ, 131, 1163
- Sleivyte & Bartkevicius (1990) Sleivyte, J., & Bartkevicius, A. 1990, Vilnius Astronomijos Observatorijos Biuletenis, 85, 3
- Spite et al. (2005) Spite, M., Cayrel, R., Plez, B., Hill, V., Spite, F., Depagne, E., Francois, P., Bonifacio, P., Barbuy, B., Beers, T.C., Andersen, J., Molaro, P., Nordström, B., & Primas, F. 2005, A&A, 430, 655
- Van Eck et al. (2003) Van Eck, S., Goriely, S., Jorissen, A., & Plez, B. 2003, A&A, 404, 291
- Wanajo et al. (2006) Wanajo, S., Nomoto, K., Iwamoto, N., Ishimaru, Y., & Beers ,T.C. 2006, ApJ, 636, 842
| Star | Coordinates | Date | Exposure | S/N | |
|---|---|---|---|---|---|
| RA (2000) | Dec (2000) | y/m/d | (sec) | at 2.3m | |
| V Ari | 02 15 00.0 | +12 14 23.6 | 2005-12-28 | 600 x 2 | 40 |
| G 77-61 | 03 32 38.3 | +01 57 57.9 | 2005-12-27 | 2400 x 2 | 55 |
| HE 0322-1504 | 03 24 40.1 | 14 54 24.0 | 2005-12-28 | 1800 x 2 | 30 |
| HE 0507-1430 | 05 10 07.6 | 14 26 32.0 | 2005-12-28 | 2400 x 2 | 55 |
| HE 0534-4548 | 05 36 06.1 | 45 46 56.0 | 2005-12-27 | 1800 x 2 | 45 |
| HE 1045-1434 | 10 47 44.1 | 14 50 23.0 | 2005-12-28 | 1800 x 2 | 30 |
| HE 1305+0007 | 13 08 03.8 | 00 08 48.0 | 2006-01-18 | 900 x 2 | 60 |
| Star | ||||||||
|---|---|---|---|---|---|---|---|---|
| V Ari | 8.45 | 0.142 | 2.05 | 5.104 | 4.620 | 4.364 | ||
| G 77-61 | 13.97 | 0.109 | 1.73 | 11.470 | 10.844 | 10.480 | ||
| HE 0322-1504 | 14.177 | 0.056 | 1.468 | 0.667 | 1.244 | 12.105 | 11.533 | 11.340 |
| HE 0507-1430 | 14.486 | 0.121 | 1.541 | 0.707 | 1.296 | 12.325 | 11.717 | 11.575 |
| HE 0534-4548 | 14.034 | 0.052 | 1.477 | 0.660 | 1.285 | 11.741 | 11.129 | 10.926 |
| HE 1045-1434 | 14.639 | 0.075 | 1.454 | 0.564 | 1.000 | 12.935 | 12.449 | 12.244 |
| HE 1305+0007 | 12.223 | 0.022 | 1.459 | 0.682 | 1.152 | 10.247 | 9.753 | 9.600 |
| Object | [Fe/H]I | [Fe/H]A | T | T | T | T | T | T | T | Atmospheric Parameters | |
|---|---|---|---|---|---|---|---|---|---|---|---|
| HighRes | Adopted | ||||||||||
| V Ari | 2.5 | 2685 | 3865 | 4905 | 4561 | 3500,0.5,2.5 | 3500,0.5, | ||||
| G 77-61 | 4.6 | 2833 | 4124 | 4271 | 3934 | 4000,5.1,4.0 | 4000,5.1, | ||||
| HE 0322-1504 | 2.4 | 3143 | 4334 | 4903 | 4535 | 4462 | 4458 | 4363 | 4460,0.8, | ||
| HE 0507-1430 | 3.0 | 3135 | 4339 | 4957 | 4710 | 4562 | 4414 | 4500 | 4560,1.2, | ||
| HE 0534-4548 | 2.2 | 3129 | 4347 | 4841 | 4318 | 4251 | 4322 | 4236 | 4250,1.5aaThe log derived from the isochrones did not match with Ca I 4224 Å and the CaII K synthesis. The final adopted value is based on spectrum synthesis.,1.8 | ||
| HE 1045-1434 | 2.9 | 3180 | 4726 | 5383 | 5484 | 4947 | 4800 | 4593 | 4950,1.8,2.5 | ||
| HE 1305+0007 | 2.8 | 3116 | 4230 | 4958 | 4972 | 4558 | 4696 | 4635 | 4750,2.0,2.0 | 4560,1.0,2.5 | |
| Star | [Fe/H] | [C/Fe] | [N/Fe] | [O/Fe] | 12C/13C | [Ba/Fe] |
|---|---|---|---|---|---|---|
| V AriaaThe CNO abundances are based on only the CN features and the CO features in the near-infrared spectra. | 2.5 | +1.5 | +1.5 | +0.2 | 9010 | bbThis star is known to be s-process rich (Van Eck et al. 2003). |
| G 77-61cc[C/Fe], [N/Fe] values are taken from Plez, Cohen & Melendez (2005). | 4.0 | +3.2 | +2.2 | +1.8 | 52ddThe 12C/13C is estimated from the 4737 Å 12C2 and the 4740 Å 13C,12C lines in the optical spectrum. | |
| HE 0322-1504 | 2.0 | +2.3 | +2.2 | +1.0 | 62 | +2.8 |
| HE 0507-1430 | 2.4 | +2.6 | +1.7 | +1.1 | 92 | +1.3 |
| HE 0534-4548 | 1.8 | +1.5 | +1.1 | +0.1 | 51 | +0.6 |
| HE 1045-1434 | 2.5 | +3.2 | +2.8 | +1.8 | 202 | +3.0 |
| HE 1305+0007 | 2.5 | +2.4 | +1.9 | +0.8 | 92 | +2.9 |
| Uncertainities | ([C/Fe]) | ([N/Fe]) | ([O/Fe]) | ( 12C/13C ) | [Ba/Fe] |
|---|---|---|---|---|---|
| ( ) (100 K) | 0.05 | 0.05 | 0.10 | 0.2 | |
| (log ) (0.5 dex) | 0.20 | 0.20 | 0.15 | 0.2 | |
| ( ) (1 ) | 0.01 | 0.01 | 0.01 | 0.1 | |
| ([C/Fe]) | 0.35 | 1.0 | |||
| ([O/Fe]) | 0.22 | ||||
| (cont)aaError due to pseudo-continuum placement. | 0.20 | 0.20 | 2.0 | 0.4 | |
| (tot) | 0.35 | 0.46 | 0.22 | 2.2 | 0.5 |