Break in the VHE spectrum of PG 1553+113: new upper limit on its redshift?
Abstract
PG 1553+113 is a known BL Lac object, newly detected in the GeV-TeV energy range by H.E.S.S and MAGIC. The redshift of this source is unknown and a lower limit of was recently estimated. The very high energy (VHE) spectrum of PG 1553+113 is attenuated due to the absorption by the low energy photon field of the extragalactic background light (EBL). Here we correct the combined H.E.S.S and MAGIC spectrum of PG 1553+113 for this absorption assuming a minimum density of the evolving EBL. We use an argument that the intrinsic photon index cannot be harder than and derive an upper limit on the redshift of . Moreover, we find that a redshift above implies a possible break of the intrinsic spectrum at about 200 GeV. Assuming that such a break is absent, we derive a much stronger upper limit of . Alternatively, this break might be attributed to an additional emission component in the jet of PG 1553+113. This would be the first evidence for a second component is detected in the VHE spectrum of a blazar.
Subject headings:
gamma rays: observations — BL Lacertae objects: individual (PG 1553+113) — diffuse radiation1. Introduction
PG 1553+113 was discovered in the Palomar-Green survey of UV-excess stellar objects (Green et al., 1986). It is classified as a BL Lac object based on its featureless spectrum (Miller & Green, 1983; Falomo & Treves, 1990) and its significant optical variability (Miller et al., 1988). PG 1553+113 is well studied from the radio to the X-ray regime. Based on its broad-band spectral energy distribution (SED), PG 1553+113 is now classified as a high-frequency peaked BL Lac (Giommi et al., 1995), similar to most of the AGNs detected at very high energies (VHE).
The redshift of PG 1553+113 is essentially unknown. It was initially determined to be = (Miller & Green, 1983) but later this claim was withdrawn (Falomo & Treves, 1990). To date no emission or absorption lines have been measured despite several observation campaigns with optical instruments. No host galaxy was resolved in Hubble Space Telescope (HST) images of PG 1553+113 taken during the HST survey of 110 BL Lac objects (Scarpa et al., 2000). The HST results were used to set a lower limit of 0.78 (Sbarufatti et al., 2005) for PG 1553+113. A more recent publication claims a lower limit on the redshift of 0.09 using the ESO-VLT optical spectroscopy survey of 42 BL Lacertae objects of unknown redshift (Sbarufatti et al., 2006). The possibility of a large redshift is of critical importance to VHE observations due to the absorption of VHE photons (Stecker et al., 1992; Hauser & Dwek, 2001) by pair-production on the extragalactic background light (EBL). This absorption, which is energy dependent and increases strongly with redshift, distorts the VHE energy spectra observed from distant objects. It is believed that VHE photons above GeV from objects at distances are completely absorbed. Note that the most distant objects detected so far at VHE are 1ES 1218+304 (, Albert et al. (2006a)) and 1ES 1101-232 (, Aharonian et al. (2006a)).
Recently, VHE -ray emission from PG 1553+113 was measured by H.E.S.S (Aharonian et al., 2006b) and by MAGIC (Albert et al., 2006b). Both collaborations reported a soft energy spectrum with a differential photon index of and respectively. The VHE data from the two measurements were used independently to derive an upper limit on the redshift of the source of . This limit is based on the assumption of a minimum possible level of the EBL and the maximum hardness of the intrinsic VHE spectrum. Although the intrinsic VHE -ray spectra of the AGNs are not well known, it can be assumed that the intrinsic photon index of the sources is not harder than =1.5 (Aharonian et al., 2006a). However, there are emission scenarios where the maximum possible VHE photon index is even harder (, Katarzyński et al. (2006)).
Here we use the combined H.E.S.S. and MAGIC spectrum of PG 1553+113 to derive upper limits on its redshift, assuming the two limits on the hardness of the intrinsic photon index (=1.5 and ).
In addition, we present an alternative method to estimate an upper limit on the redshift of PG 1553+113 assuming that there is no break in the intrinsic VHE spectrum of the source.
2. Minimum EBL
The most likely reaction channel in the interaction of VHE -rays with the low energy photons of the EBL is pair production . This reaction has its largest cross section when the center of mass energy is roughly 2 times the threshold energy of 2mec2. The relevant EBL wavelength range for the absorption of VHE -rays spans from UV light (0.1 m) to far infrared (few 100 m). This light predominantly consists of redshifted star light of all epochs and reemission of a part of this light by dust in galaxies. The intrinsic (de-absorbed) VHE photon spectrum, , of a blazar located at redshift can be determined using:
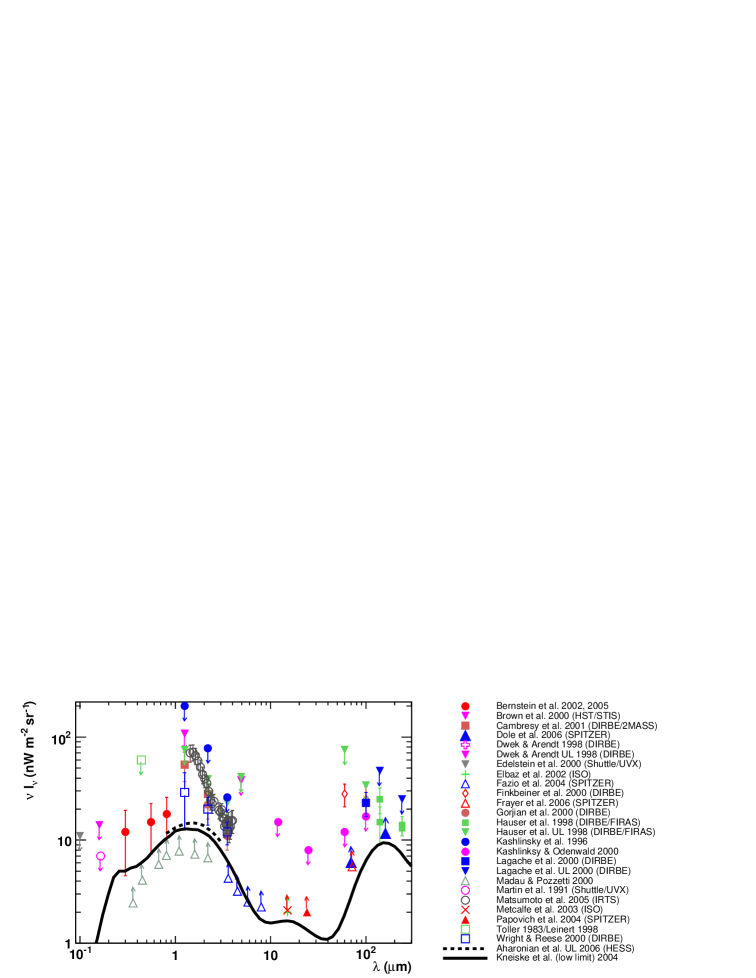
where is the observed spectrum and is the optical depth. While the cross-section of the pair production is well known the spectral energy density of the EBL is not, which makes the calculation of the optical depth uncertain. Direct measurements of the EBL are difficult because of the strong foreground emission, mainly consisting of reflected sunlight and thermal emission from zodiacal dust particles. Indirect upper limits on the EBL density were obtained using fluctuation analyses of the detected background radiation (Kashlinsky et al., 1996; Kashlinsky & Odenwald, 2000). Recently, an upper limit on the EBL density in the range from 0.8 to 3 m was determined using measured VHE spectra of distant AGNs (Aharonian et al., 2006a). On the other hand, a robust lower limit on the EBL is set by galaxy counts in different wavebands (Madau & Pozzetti, 2000; Fazio et al., 2004; Elbaz et al., 2002; Metcalfe et al., 2003; Papovich et al., 2004). A summary of current direct and indirect measurements of EBL is given in Fig. 1.
In the present study, we want to use the lowest possible realistic level of the EBL in order to derive a minimum redshift, above which a break in the VHE spectrum of PG 1553+113 becomes evident. Several EBL models have been developed, taking into account the evolution of the EBL, which is related to star and galaxy evolution (e.g. Kneiske et al. (2004); Primack et al. (2005); Stecker et al. (2006)). Though different in approach, the models agree in their predictions within a factor of 2. For this study, we use the lower limit model from Kneiske et al. (2004), which is just at the level of the direct lower limits set by the galaxy counts (see Fig. 1).
3. Combining the spectra of PG 1553+113 from H.E.S.S. and MAGIC
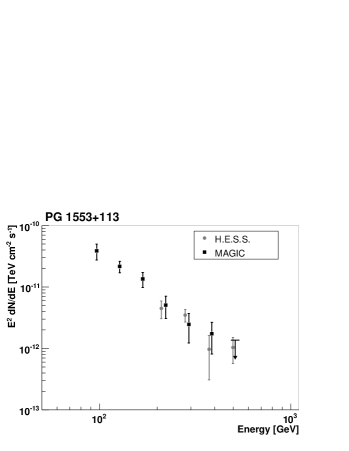
The differential VHE -ray spectra of PG 1553+113 published by H.E.S.S. and MAGIC are shown in Fig. 2. The photon fluxes are multiplied by , which is equivalent to a representation. The H.E.S.S. data are shown as grey circles and the MAGIC data by black boxes. For H.E.S.S., the data were taken in spring–summer 2005. In case of MAGIC, it is a combined data set taken between spring 2005 and winter 2006. The last spectral point is a 95% upper limit and will not be used in the further analysis. AGNs are known to be variable sources in flux so that, in general, it is not trivial to combine non-simultaneous data sets. In the present case, however, the agreement between the spectra measured by H.E.S.S. and MAGIC is very good. As a test, we fitted a power law
| (1) |
to the observed spectra in the overlapping energy region between 150 and 600 GeV by fixing the slope (observed photon index ) to the value measured by H.E.S.S.: . The resulting normalization factors are and for the H.E.S.S. and MAGIC data respectively. These numbers differ by 10%, which is small compared to the individual statistical errors. In order to increase the statistical power of the tests described below, we use the combined spectrum of MAGIC and H.E.S.S. data on PG 1553+113. We normalize the spectra by multiplying the H.E.S.S. fluxes by a factor 1.1 to avoid a possible bias in our results. In order to show the effect of the normalization we also perform the same study on a combined spectrum without this normalization.
4. Determination of upper limits on the redshift of PG 1553+113
Two different methods are used. The first one assumes that the spectral index of the intrinsic differential photon spectrum is not higher than 1.5 (or, alternatively, 2/3). The second one assumes that the intrinsic photon spectrum has no break in the measured energy region from 80 to 600 GeV.
Maximum intrinsic photon index
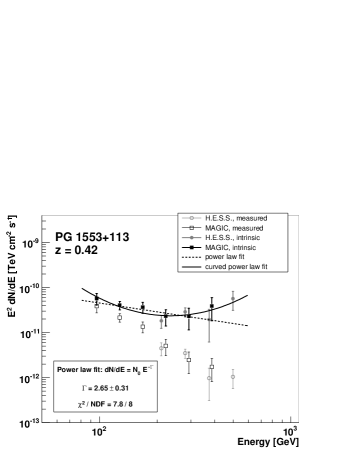
A fit of Eq. 2 is performed to the intrinsic spectrum of PG 1553+113. The fitted index and its error are combined to , where corresponding to a 95% confidence level. We note that despite the fact that for (see below) a curved power law gives a significantly better fit to the intrinsic spectrum than a simple power law, the value of the latter fit is still acceptable. A redshift is considered to be unrealistic if or, in case of the extreme scenario, .
Presence of a break in the intrinsic photon spectrum
The second method is based on the indication that for larger redshifts () the intrinsic spectrum of PG 1553+113 exhibits a break at about 200 GeV with the intrinsic energy spectrum rising after the break (see Fig. 3). Such a break in the intrinsic spectrum of PG 1553+113 cannot be excluded a priori. It could attributed to a second population of -ray emitting particles. However, in none of the measured VHE -ray spectra of extragalactic sources such a component has been found. Thus, if a spectrum shows a break, either it is the first time a second emitting component is found in a VHE -ray spectrum or a lower redshift value has to be assumed.
To test the presence of a second component (or the presence of a break) in the VHE spectrum of PG 1553+113 we performed a likelihood ratio test (Eadie et al., 1998) on the intrinsic spectrum. Two hypotheses are tested. Hypothesis A is a simple power law (2 free parameters):
| (2) |
Hypothesis B is a curved power law (3 free parameters):
| (3) |
which corresponds to a parabolic law in a vs. representation. A parabolic shape is a natural choice to describe the transition region of a break between two spectral components. By fitting the two functional forms (Eq. 2 and 3) to the de-absorbed spectrum one obtains values of the likelihood functions and . If hypothesis A is true the likelihood ratio is approximately distributed with one degree of freedom. One defines a probability
| (4) |
where is the probability density function and is the measured value of . Hypothesis A will be rejected (and hypothesis B will be accepted) if is greater than the confidence level, which is set to 95%.
5. Results
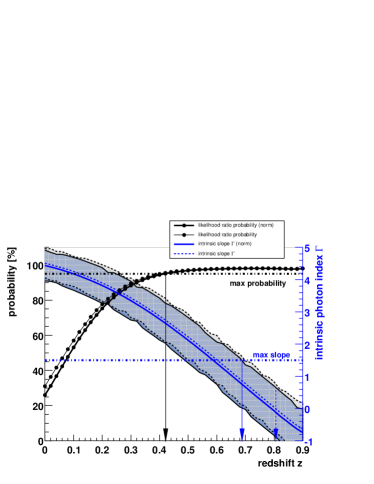
Black points and left Y-axis: probability of the likelihood ratio test (Eq. 4). The black arrow indicates the minimum redshift (), at which the break in the intrinsic spectrum of PG 1553+113 is evident.
Blue line and right Y-axis: intrinsic photon index . Shaded areas correspond to 2 confidence belt. The intrinsic spectrum is harder than this for , which is indicated by the blue arrow. The extreme case of leads to an upper limit of as indicated by the dashed blue arrow.
We examined a wide range of redshifts values between 0.1 and 0.9 in steps of 0.02. Each time, the corresponding optical depth was calculated and the intrinsic spectrum of PG 1553+113 was determined using the low limit model from Kneiske et al. (2004). The probability of the likelihood ratio test and the intrinsic photon index as a function of redshift are shown in Fig. 4.
The intrinsic photon index as a function of the redshift is shown by the thick blue line in Fig. 4. A confidence belt is drawn as blue shaded area. The result without the normalization between the H.E.S.S. and MAGIC measured spectrum of PG 1553+113 is shown by the dashed blue line with a corresponding confidence belt as grey shaded area. Assuming that the intrinsic photon index can not be harder than , we obtain a redshift limit of with a confidence of 95%. Assuming the maximally hard spectrum as proposed by Katarzyński et al. (2006) with , we obtain a redshift upper limit of .
The intrinsic spectrum was considered to have a break if the likelihood ratio test gave more than 95% confidence. The probability of the likelihood ratio test as a function of the redshift is shown by the black points and thick black line in Fig. 4. The smallest redshift, for which the test gave more than 95% confidence, is (see Fig. 3). The assumption that there is no break in the intrinsic spectrum of PG 1553+113 thus leads to an upper limit on its redshift of . The result without the normalization between the H.E.S.S. and MAGIC measured spectrum is shown by the thin black line. The systematic uncertainty in the derived limits, arising from the applied normalization of 10% between the H.E.S.S. and MAGIC data, is below 10%.
The test for the existence of a break cannot be applied to the H.E.S.S. spectrum alone since the break occurs around the lower end of the energy region of the H.E.S.S. measurement. On the other hand, applying this test to the MAGIC data alone never reaches the required probability of 95% for the existence of the break due to insufficient statistics.
6. Conclusion and Outlook
In this study, we combined H.E.S.S. and MAGIC data using their good agreement and used a realistic minimum density of the EBL to reconstruct the intrinsic spectrum of PG 1553+113. We showed that the intrinsic photon index becomes smaller than at , which can be considered a robust upper limit on the redshift of PG 1553+113. In case of the extreme emission scenario with , we obtain an upper limit of . Moreover, we showed that a break in the intrinsic spectrum at about 200 GeV becomes evident at a redshift of . The break can either be interpreted as an upper limit on the redshift of PG 1553+113 or as evidence for a second emission component in the VHE spectrum of the object. The upper limit of implies values of the intrinsic slope indicating that the peak of the high-energy component of the SED lies below few hundred GeV, as typically derived for the closest TeV blazars Mrk 421 and Mrk 501 (in low flux state). We note that increasing the statistics by combining the spectra of MAGIC and H.E.S.S. resulted in a moderate improvement of the redshift upper limit. On the other hand, the second method, which is based on the search for structures in the intrinsic spectrum and which resulted in much more stringent limits, became only feasible using the combined data set.
The knowledge of the distance of PG 1553+113 is crucial for the modeling of the emission processes in the object, especially for combining X-ray and VHE data. In case the redshift of PG 1553+113 is larger than it would not only be the farthest AGN detected in the VHE range so far but also by far the most energetic one. Further campaigns to determine the redshift of PG 1553+113 directly as well as extensive VHE observations are encouraged.
References
- Aharonian et al. (2006a) Aharonian, F. et al., 2006a, Nature 440,1018
- Aharonian et al. (2006b) Aharonian, F. et al., 2006b, A&A 448, L19-L23
- Albert et al. (2006a) Albert, J. et al., 2006a, ApJ 642, L119
- Albert et al. (2006b) Albert, J. et al., 2006b, Subm. to ApJ, astro-ph/0606161
- Bernstein et al. (2002) Bernstein, R. et al., 2002, ApJ 571, 56,85,107.
- Bernstein et al. (2005) Bernstein, R. et al., 2005, ApJ, 632, 713.
- Brown et al. (2000) Brown, T.M. et al., 2000, Astronom. Journal, 120, 1153
- Cambrésy et al. (2001) Cambrésy, L. et al., 2001, ApJ 555, 563
- Dole et al. (2006) Dole, H. et al., 2006, A&A, 451, 417.
- Donato et al. (2005) Donato, D., Sambruna, R.M., & Gliozzi, M., 2005, A&A, 433, 1163
- Dwek & Arendt (1998) Dwek, E. Arendt, R.G., 1998, ApJ 508, L9
- Eadie et al. (1998) Eadie, W.T. et al., 1998, Statistical Methods in Experimental Physics, North-Holland Publishing Company, Amsterdam
- Edelstein et al. (2000) Edelstein, J., Bowyer, S., & Lampton, M., 2000, ApJ, 539, 187.
- Elbaz et al. (2002) Elbaz, D. et al., 2002, A&A 384, 848
- Falomo & Treves (1990) Falomo, R. & Treves, A., 1990, PASP, 102, 1120
- Fazio et al. (2004) Fazio, G.G. et al., 2004, ApJS 154, 39
- Finkbeiner et al. (2000) Finkbeiner et al., 2000, ApJ 544, 81
- Frayer et al. (2006) Frayer, D.T. et al., 2006, Astronom. Journal, 131, 250.
- Giommi et al. (1995) Giommi, P., Ansari, S.G., & Micol, A., 1995, A&AS, 109, 267
- Gorjian et al. (2000) Gorjian, V. et al., 2000, ApJ 536, 550
- Green et al. (1986) Green, R.F., Schmidt, M., & Liebert, J., 1986, ApJS, 61, 305
- Hauser et al. (1998) Hauser M.G. et al., 1998, ApJ 508, 25
- Hauser & Dwek (2001) Hauser, M.G. & Dwek, E., 2001, ARA&A, 39, 249
- Kashlinsky et al. (1996) Kashlinsky, A. et al., 1996, ApJ 470, 681
- Kashlinsky & Odenwald (2000) Kashlinsky, A. & Odenwald. S., 2000, ApJ 528, 74
- Katarzyński et al. (2006) Katarzyński, K. et al., 2006, A&A 453, 47-56
- Kneiske et al. (2004) Kneiske, T. M. et al., 2004, A&A 413, 807-815
- Lagache et al. (2000) Lagache, G. et al., 2000, A&A 354, 247
- Madau & Pozzetti (2000) Madau, P. & Pozzetti, L., 2000, MNRAS 312, L9.
- Martin et al. (1991) Martin, C., 1991, ApJ 379, 549
- Matsumoto et al. (2005) Matsumoto, T. et al., 2005, ApJ 626, 31
- Metcalfe et al. (2003) Metcalfe, L. et al., 2003, A&A 407, 791
- Miller et al. (1988) Miller, H.R., Carini, M.T., Gaston, B.J., et al., 1988, Proc. of the IUE Symposium (Greenbelt), 303
- Miller & Green (1983) Miller, H.R. & Green, R.F., 1983, BAAS, 15, 957
- Papovich et al. (2004) Papovich, C. et al., 2004, ApJS 154, 70
- Primack et al. (2005) Primack, J. et al., AIP Conf. Proc., 2005, 745, 23.
- Sbarufatti et al. (2005) Sbarufatti, B., Treves, A., & Falomo, R., 2005, ApJ, 635, 173
- Sbarufatti et al. (2006) Sbarufatti, B., Treves, A., & Falomo, R., et al, 2006, AJ, 132, 1
- Scarpa et al. (2000) Scarpa, R., Urry, C.M., Falomo, R., et al., 2000, ApJ, 532, 740
- Stecker et al. (1992) Stecker, F.W., de Jager, O.C., & Salamon, M.H., 1992, ApJ, 390, 49
- Stecker et al. (2006) Stecker, F.W., Malkan, M.A., & Scully S.T. 2006, ApJ 648, 774
- Toller (1983) Toller, G.N., 1983, ApJ, 266, L79.
- Wright & Reese (2000) Wright, E.L. & Reese, E.D., 2000, ApJ 545, 43