Primary particle acceleration above 100 TeV in the shell-type Supernova Remnant RX J1713.73946 with deep H.E.S.S. observations
Abstract
Aims. We present deep H.E.S.S. observations of the supernova remnant (SNR) RX J1713.73946. Combining data of three years – from 2003 to 2005 – we obtain significantly increased statistics and energy coverage as compared to earlier 2003 & 2004 results.
Methods. The data are analysed separately for the different years.
Results. Very good agreement of the gamma-ray morphology and the differential spectra is found when comparing the three years. The combined gamma-ray image of the 2004 and 2005 data reveals the morphology of RX J1713.73946 with unprecedented precision. An angular resolution of is achieved, revealing the detailed structure of the remnant. The combined spectrum of all three years extends over three orders of magnitude, with significant gamma-ray emission approaching 100 TeV. The cumulative significance above 30 TeV is , while for energies between 113 and 294 TeV an upper limit on the gamma-ray flux of is obtained.
Conclusions. The energy coverage of the H.E.S.S. data is presumably at the limit of present generation Cherenkov telescopes. The measurement of significant gamma-ray emission beyond 30 TeV formally implies the existence of primary particles of at least that energy. However, for realistic scenarios of very-high-energy gamma-ray production, the Inverse Compton scattering of very-high-energy electrons and decay following inelastic proton-proton interactions, the measured gamma-ray energies imply that efficient acceleration of primary particles to energies exceeding 100 TeV is taking place in the shell of the SNR RX J1713.73946.
Key Words.:
acceleration of particles – ISM: cosmic rays – gamma rays: observations – ISM: supernova remnants – gamma rays: individual objects: RX~J1713.7$-$3946 (G347.3$-$0.5)1 Introduction
| Target position | Wobble offsets | Live time | Data set I | Data set II | Data set III | |||
| Year | best-resolution data | spectral comparisons | all data | |||||
| (hours) | (hours) | (hours) | (hours) | |||||
| 9.1 | ||||||||
| 2003 | 17h12m00s | 9.0 | 0 | 18.1 | 18.1 | |||
| 7.3 | ||||||||
| 8.1 | ||||||||
| 2004 | 17h13m33s | 6.9 | 33.1 | 30.6 | 33.1 | |||
| 8.3 | ||||||||
| 2.5 | ||||||||
| 9.0 | ||||||||
| 9.5 | ||||||||
| 2005 | 17h13m33s | 8.7 | 29.7 | 36.8 | 40.1 | |||
| 9.4 | ||||||||
| 3.511footnotemark: 1 | ||||||||
| 11footnotemark: 1 These observations had wobble offsets of in Right Ascension and Declination, less than the radius of the SNR, and are summarised in one row. | ||||||||
The energy spectrum of cosmic rays measured at Earth exhibits a power-law dependence over a broad energy range. Starting at a few GeV it continues to energies of at least . The power-law index of the spectrum changes at two characteristics energies: in the region around – the knee region – the spectrum steepens, and at energies beyond it hardens again. This latter feature is known as the ankle. Up to the knee, cosmic rays are believed to be of Galactic origin, accelerated in shell-type supernova remnants (SNRs) – expanding shock waves initiated by supernova explosions (for a recent review see Hillas (2005)). However, the experimental confirmation of an SNR origin of Galactic cosmic rays is difficult due to the propagation effects of charged particles in the interstellar medium. The most promising way of proving the existence of high-energy particles in SNR shells is the detection of very-high-energy (VHE) gamma rays (), produced in interactions of cosmic rays close to their acceleration site (Drury et al. 1994).
Recently H.E.S.S. – a VHE gamma-ray instrument consisting of four Imaging Atmospheric Cherenkov Telescopes – has detected two shell-type SNRs, RX J1713.73946 (Aharonian et al. 2004b, 2006b) and RX J0852.0–4622 (Aharonian et al. 2005a). The two objects show an extended morphology and exhibit a shell structure, as expected from the notion of particle acceleration in the expanding shock fronts. Both objects reveal gamma-ray spectra that can be described by a hard power law (with photon index ) over a broad energy range. For RX J1713.73946 significant deviations from a pure power law at larger energies are measured (Aharonian et al. 2006b). While it is difficult to attribute the measured VHE gamma rays unambiguously to nucleonic cosmic rays (rather than to cosmic electrons, which would certainly also be accelerated in the shock front), the measured spectral shapes favour indeed in both cases – for RX J1713.73946 and RX J0852.0–4622 – a nucleonic cosmic-ray origin of the gamma rays (Aharonian et al. 2006a, b). In the case of RX J1713.73946 in addition a narrow shock filament seen in X-rays (Hiraga et al. 2005) indicates strong amplification of the magnetic field at least in one region of the rim (Berezhko & Völk 2006). If such an amplified magnetic field exists throughout the main volume of the SNR – the region for which VHE gamma-ray data is presented here – and if consequently high magnetic field values are found not only in one shock filament, but on a large part of the shock surface, a leptonic origin of the VHE gamma rays becomes increasingly unlikely just based on the absolute level of X-ray and gamma-ray flux of RX J1713.73946 (Aharonian et al. 2006b).
Apart from the first unambiguous proof of multi-TeV particle acceleration in SNRs (Aharonian et al. 2006a, b), the question of the highest observed energies remains an important one. Only the detection of gamma rays with energies of 100 TeV and beyond provides experimental proof of acceleration of primary particles, protons or electrons, to even higher energies of 1 PeV and beyond. The spectrum of the whole SNR RX J1713.73946 reported in Aharonian et al. (2006b) comprises data of the 2004 observation campaign of H.E.S.S.. It extends to energies of 40 TeV. Here we present a combined analysis of H.E.S.S. data of RX J1713.73946 recorded in three years, in 2003 during the construction and commissioning phase of the system, and in 2004 and 2005 with the full H.E.S.S. array. A comparison of the three data sets demonstrates the expected steady emission of the source as well as the stability of the system during the first three years of running. Special emphasis is then devoted to the high-energy end of the combined spectrum.
2 H.E.S.S. observations
The High Energy Stereoscopic System (H.E.S.S.) consists of four identical Cherenkov telescopes that are operated in the Khomas Highland of Namibia (Hofmann 2005). The telescopes (Bernlöhr et al. 2003; Cornils et al. 2003) are 13 m in diameter, each with a mirror area of . During normal operation the system is run in a coincidence mode which requires a trigger from at least two out of the four telescopes (Funk et al. 2004). The cameras consist of 960 photomultiplier pixels and cover a field of view (Vincent et al. 2003). The resulting of the system field-of-view response makes H.E.S.S. the currently best suited experiment in the field for the study of extended VHE gamma-ray sources such as young Galactic SNRs. At zenith, the energy threshold is about 100 GeV and for point sources an energy resolution of 15% is achieved. The angular resolution for individual gamma rays is better than and the point source sensitivity reaches of the flux of the Crab nebula for long exposures ( hours).
The H.E.S.S. observation campaign of RX J1713.73946 started in 2003. The data were recorded between May and August 2003 during two phases of the commissioning of the telescope system. During the first phase, two telescopes were operated independently with stereoscopic event selection done offline using GPS time stamps to identify coincident events. During the second phase, also using two telescopes, coincident events were selected in hardware using the array level trigger (Funk et al. 2004). The observations were performed in Declination wobble mode around the northwest shell of the SNR, the alternating wobble offset in Declination was . The zenith angle of observations varied from to with a mean of . The analysis of this first data set revealed extended gamma-ray emission resembling a shell structure, very similar to the X-ray image. It was actually the first ever resolved image of an astronomical source obtained with VHE gamma rays (Aharonian et al. 2004b). The spectrum was well described by a hard power law with energies from 1 to 10 TeV.
In 2004, observations were conducted with the full telescope array. From April to May, most of the data were recorded in wobble mode, this time around the SNR centre with an offset of in Right Ascension and Declination aiming at more uniform coverage of the whole SNR and, important for analysis purposes, fully encompassing the SNR with the four observation positions. The zenith angle of observations ranged from to with a mean of . The H.E.S.S. data enabled analysis of the gamma-ray morphology and the spectrum of the remnant with unprecedented precision (Aharonian et al. 2006b). A very good correlation was found between the X-ray and the gamma-ray image. The differential spectrum was measured from 200 GeV up to 40 TeV. A deviation from a pure power law was found at high energies. A spatially resolved spectral study revealed no significant changes of spectral shape across the SNR despite flux variations by more than a factor of two.
| Year | ON | OFF | Significance | Live time (hrs) | |||
|---|---|---|---|---|---|---|---|
| 2003 | 3194 | 1764 | 1.00 | 21 | 18.1 | ||
| 2004 | 18728 | 11039 | 1.05 | 41 | 33.1 | ||
| 2005 | 10277 | 5124 | 1.15 | 33 | 29.7 |
The 2005 observation campaign was aiming at extending the energy coverage of the spectrum to as high energies as possible. Therefore the observations, carried out from beginning of September to November, were preferentially pursued at large zenith angles, up to values of , to make use of the drastically increased effective collection area of the experiment at high energies. The mean zenith angle of observations was . As in 2004, RX J1713.73946 was observed in wobble mode with an offset of in Declination and Right Ascension. Analysis of these data are for the first time presented in the following. A summary of the observations conducted during three years with H.E.S.S. is given in Table 1.
3 Data Analysis
The RX J1713.73946 data presented here are calibrated according to the standard H.E.S.S. calibration methods (Aharonian et al. 2004a). For the background suppression, cuts on scaled image parameters are applied (Aharonian et al. 2005b). The shower reconstruction is based on image parameters (Hillas parameters) and corresponds, unless otherwise stated, to algorithm 1 of Hofmann et al. (1999): the intersection point of the image axes in a common camera coordinate system yields the shower impact position on ground and the direction of the primary. A cut on the minimum size of camera images is applied to assure that only well defined images are included in the analysis. For the 2003 two-telescope data, the cut is applied at a rather large value of 300 photo-electrons. In the commissioning phase of the experiment, this served to dramatically reduce the number of background events, but it also homogenises the whole data set, which was recorded with two different hardware configurations, thereby reducing systematic uncertainties. Moreover, the angular resolution improves when including only well defined images in the analysis. The 2004 and 2005 data are analysed as discussed in Aharonian et al. (2006b). For spectral analysis, a loose cut on the minimum image size at 80 photo-electrons is applied. For studies of the gamma-ray morphology, the cut is increased to 200 photo-electrons yielding superior angular resolution of the order of and better background suppression.
For the subtraction of the irreducible cosmic-ray background, separate approaches are taken for the generation of gamma-ray spectra and images. The preferred background-estimation method for spectral analysis is the reflected-region model (Hinton et al. 2005). The background estimate is derived from a region of the same size and shape as the source region, reflected at the system pointing direction. To assure non-overlapping source and background-control regions, this approach can only be applied if the observation positions have been chosen outside the nominal gamma-ray source region. As can be seen from Table 1, this is not true for the whole 2003 data and parts of the 2004 and 2005 observations. For these data, an ON/OFF-background model is applied instead. From the complete set of H.E.S.S. observations without gamma-ray signal, OFF runs for background estimation are selected with zenith-angle distributions matching that of the ON runs as close as possible.
For image generation, the field-of-view-background model is applied (Hinton et al. 2005). It models the background by means of a system acceptance model determined from the full set of H.E.S.S. OFF runs. The normalisation is calculated using the whole field of view excluding regions of known gamma-ray emission. Note that the background-subtracted gamma-ray images shown throughout this paper are smoothed with a Gaussian to reduce statistical fluctuations. The resulting images are in units of gamma-ray excess counts per Gaussian sigma. They are corrected for the falloff of the system acceptance towards the edges of the field of view which results from a smaller detection efficiency far from the pointing centre.
When determining spectra of the whole SNR, a circular region of radius is used here, centred at , .
4 Gamma-ray Morphology
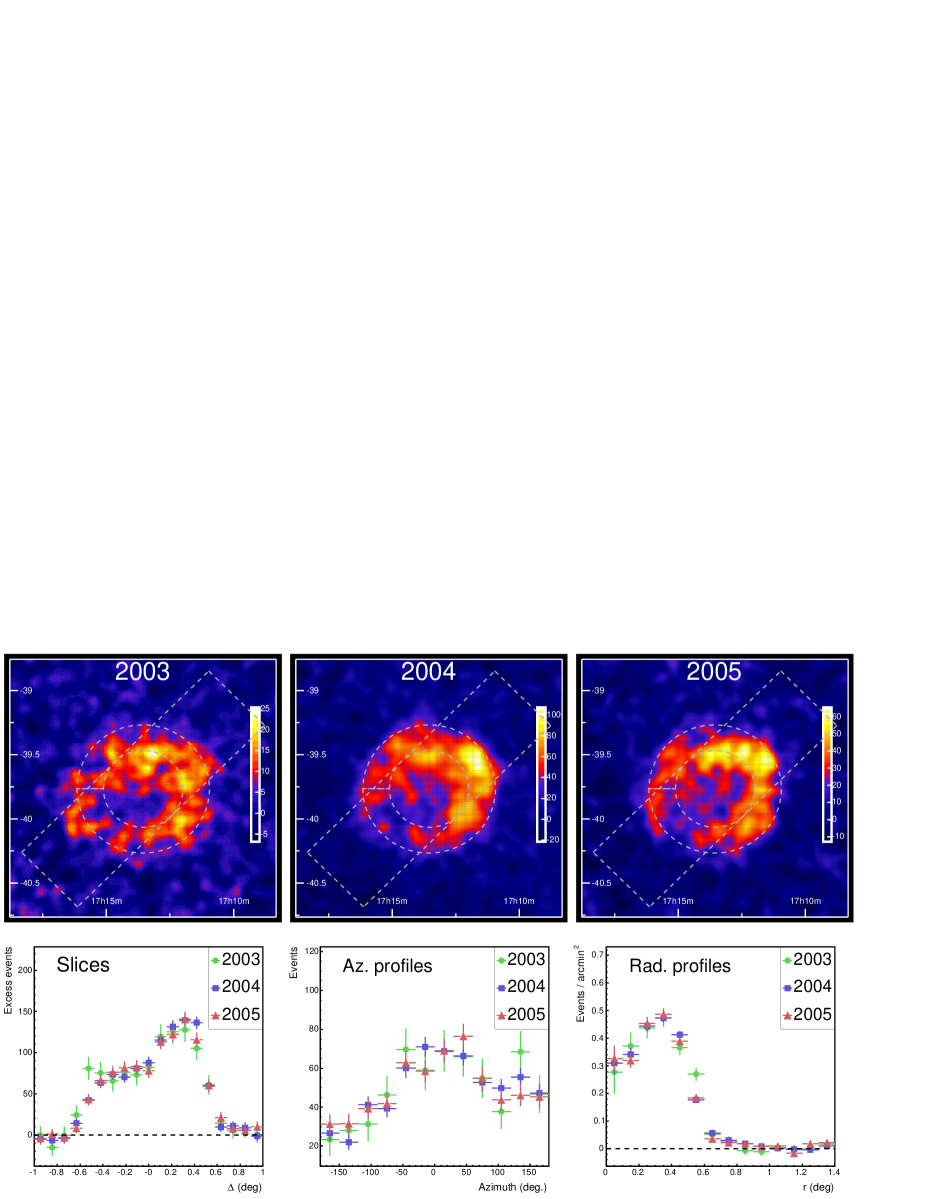
The gamma-ray morphology as obtained from the H.E.S.S. data of three years is seen in the upper panel of Fig. 1. For the 2003 data, a special set of analysis cuts was applied adopted to the two-telescope data (cf. Sec. 3). For the 2005 image, only observations at zenith angles smaller than are taken into account (reducing the available observation time by hours, cf. Table 1). For larger zenith-angle observations, the geometrical reconstruction worsens, deteriorating the angular resolution of the resulting image.
The images of Fig. 1 are readily comparable. They are corrected for system acceptance, which is different for the different data because of the zenith-angle dependence of the acceptance and the intermediate system configuration of 2003. Very similar angular resolutions are achieved for all years, see Table 2, where relevant parameters are listed. From the visual impression the three images shown in the figure are very similar. Within statistics, good agreement is achieved, as can be seen from the one-dimensional distributions shown in the lower panel of Fig. 1, which have the advantage that statistical errors on the measurement can be taken into account for the comparison. Shown from left to right are a slice along a thick box (shown in the upper panel of Fig. 1), an azimuthal profile of the shell region, and a radial profile. All the distributions are generated from the non-smoothed, acceptance-corrected excess images, very finely binned such that binning effects are negligible. Clearly, there is no sign of disagreement or variability, the H.E.S.S. data of three years are well compatible with each other.
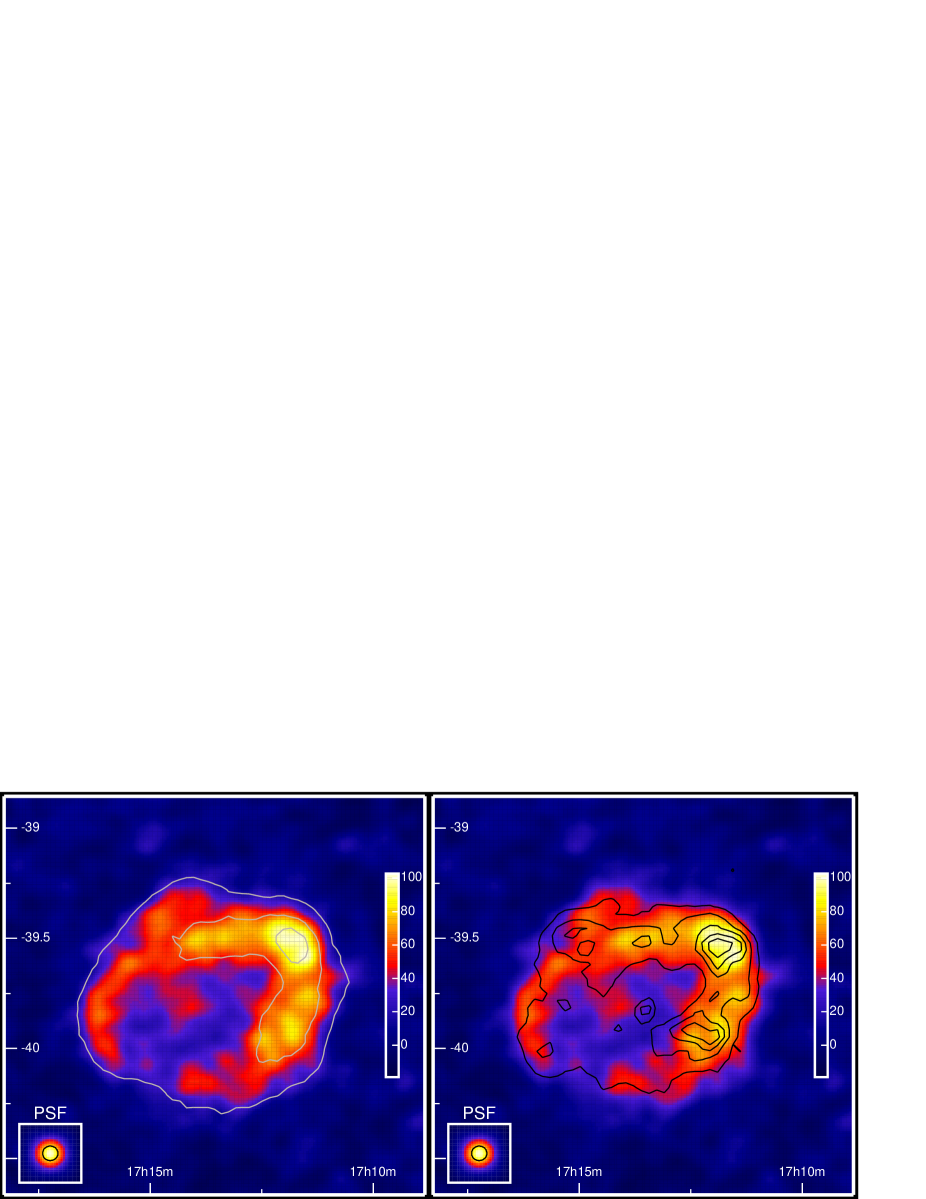
The combined H.E.S.S. image is shown in Fig. 2. Data of 2004 and 2005 are used for this smoothed, acceptance-corrected gamma-ray excess image (Data set I in Table 1). In order to obtain optimum angular resolution, a special analysis is applied here. In addition to the image-size cut of 200 photo-electrons, the cut on the minimum event multiplicity is raised to three telescopes (disregarding the 2003 data for this purpose completely). Moreover, an advanced reconstruction method is chosen. It takes Monte-Carlo error estimates on image parameters into account and is based on algorithm 3 of Hofmann et al. (1999) (see Berge (2006) for studies of this analysis technique). The image corresponds to 62.7 hours of dead-time corrected observation time. With the reflected-region method, 12961 ON events from the region associated with the SNR are accumulated, and 5710 OFF events (normalisation 111Note that pure ON runs with wobble offsets are included in Data set I (cf. Table 1) and hence .). Hence, 6702 gamma-ray excess events are measured with a statistical significance of . An angular resolution of () is achieved. For comparison, the resolution obtained with the standard geometrical reconstruction method and a three-telescope multiplicity is with similar event statistics. With a two-telescope multiplicity cut, the resolution with the standard reconstruction is (with 28879 ON, 16070 OFF events, , and a significance of 53 ).
The image in Fig. 2 confirms nicely the published H.E.S.S. measurements (Aharonian et al. 2004b, 2006b), with 20% better angular resolution and increased statistics. The shell of RX J1713.73946, somewhat thick and asymmetric, is clearly visible and almost closed. As can be seen from the left-hand side of the figure, when integrating signal and background events in a circle of radius around each trial point-source position, significant gamma-ray emission is found throughout the whole remnant. Even in the seemingly void south-eastern region it exceeds a level of standard deviations. The gamma-ray brightest parts are located in the north and west of the SNR. The similarity of gamma-ray and X-ray morphology, which was already investigated in detail in Aharonian et al. (2006b) for the 2004 H.E.S.S. data, is again demonstrated on the right-hand side of Fig. 2, where ASCA X-ray contours are overlaid on the H.E.S.S. image.
5 Gamma-ray Spectrum
| Year | ON | OFF | Significance | Live time (hrs) | |
|---|---|---|---|---|---|
| 2003 | 3194 | 1764 | 1.0 | 20.5 | 18.1 |
| 2004 | 107494 | 93906 | 1.0 | 30.3 | 30.6 |
| 2005 | 71276 | 60175 | 1.0 | 30.6 | 36.8 |
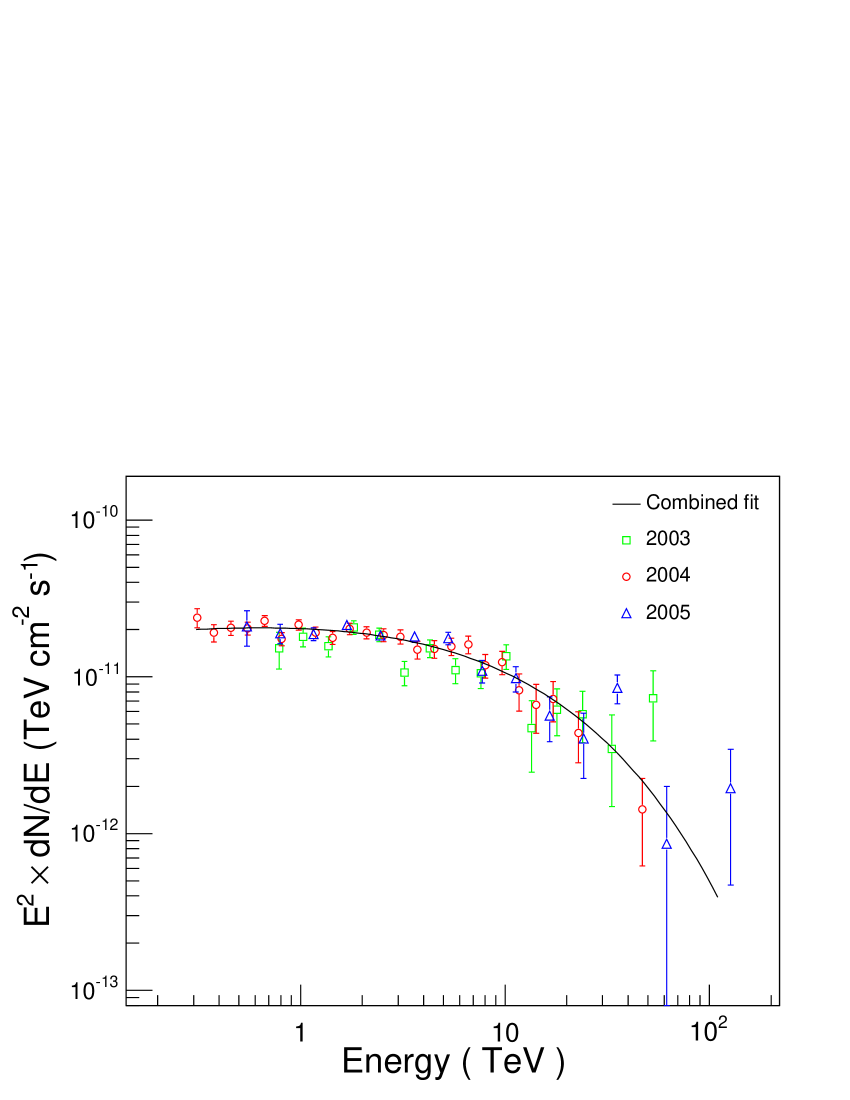
The gamma-ray spectra measured with H.E.S.S. in three consecutive years are compared to each other in Fig. 3. The 2003 spectrum is obtained from an ON/OFF analysis, with the set of special two-telescope cuts mentioned above. Note that these cuts were also applied to obtain the spectrum shown in Fig. 3 of Aharonian et al. (2004b), which stops at 10 TeV. Here, however, the 2003 spectrum extends to energies beyond 30 TeV. The difference between the two analyses is the energy range of simulations used to generate effective gamma-ray detection areas (needed for spectral analysis). In the old analysis, gamma rays were simulated up to 20 TeV, permitting energy reconstruction only up to TeV (allowing for a maximum reconstruction bias of 10%). Here, in the present analysis, simulations up to 100 TeV are available for zenith angles smaller than , up to 200 TeV for angles from to , and up to TeV for zenith angles up to a maximum of . Hence the increased energy coverage. Note that good agreement is found between the 2003 spectrum shown here and the one published previously in Aharonian et al. (2004b) in the energy range from 1 to 10 TeV.
The spectra determined from the 2004 and the 2005 data in Fig. 3 are obtained with the reflected-region-background model. Therefore, data where the observation position was within the SNR region are disregarded. For the purpose of comparison of the different data sets this approach seems reasonable, no attempt to analyse the remaining data with an ON/OFF-background approach is pursued. The corresponding event statistics for the spectra shown in the figure are listed in Table 3.
In order to compare data recorded in different years, a correction for the variation of optical efficiency of the telescope system must be applied. The efficiency degrades with time, mostly due to degradations of mirror reflectivity. As described in detail in Aharonian et al. (2006c), this worsening of the actual efficiency with respect to the simulated one causes a shift in the absolute energy scale. This shift can be corrected using measured images of local muons, for which the light yield is predictable. Based on the prediction and the simulated light yield, an average energy correction factor is determined for the data of each of the three years separately. The resulting average values are 1.12 for 2003 and 2004, and 1.30 for 2005. These correction factors are used to correct the reconstructed energies thereby enabling direct comparisons between different years. Note that a correction factor is needed already for the first data set of 2003 since the Monte-Carlo simulations refer to new mirrors, but in 2003 the first H.E.S.S. telescope was already one year old. In 2004, the total optical efficiency of the system remained the same because of the inclusion of two telescopes with nominal efficiency, thereby cancelling the aging effects of the first two telescopes.
The spectra shown in Fig. 3 are after correction. Very good agreement is found between the different years. The measured spectral shape remains unchanged over time. The absolute flux levels are well within the systematic uncertainty of 20%. As expected for an object like RX J1713.73946, no flux variation is seen on yearly timescales. Clearly, the performance of the telescope system is under good control, the correction of the optical degradation by means of energy correction factors determined from “muon efficiencies” works reasonably well (see also Aharonian et al. (2006c)). Note that without correction of aging effects, flux differences between 2004 and 2005 are on the order 40%.
| Fit Formula | Fit Parameters | (d.o.f.) | |||
|---|---|---|---|---|---|
| 145.6 (25) | |||||
| 39.5 (24) | |||||
| 34.3 (24) | |||||
| 34.2 (24) | |||||
| 38.8 (24) | |||||
| 29.8 (23) | |||||
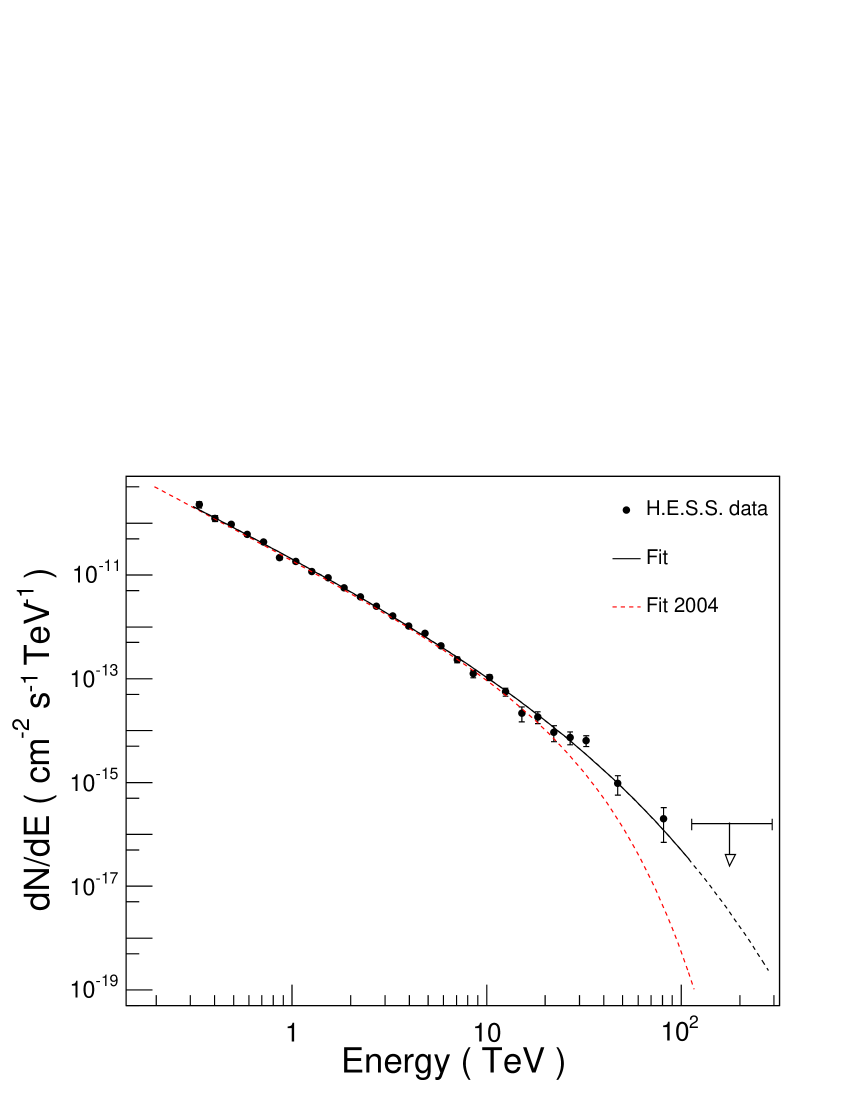
The combined data of three years are shown in Fig. 4. This energy spectrum of the whole SNR region corresponds to hours of H.E.S.S. observations (Data set III, Table 1). It is generated analysing the 2003 data separately, with the ON/OFF approach and the two-telescope analysis. The 2004 and 2005 data are analysed together, with the reflected-region background and the nominal 80-photo-electrons cut. As shown in Table 1, a fraction of the data was recorded with wobble offsets smaller than . For this part, the ON/OFF method is applied. Average energy-correction factors for each of the three subsets of data separately are determined as explained above. Having analysed the data separately to obtain suitable background estimates for the SNR region, spectra are then combined to yield the final spectrum shown in Fig. 4. Systematic checks included the application of tighter cuts on the image amplitude to the 2004 and 2005 data and separate analysis of data recorded under small and large zenith angles (below and above ). While the spectra determined with different cuts are fully compatible, a slight flux overestimation is found for the large zenith-angle data, on the 10% level. The investigations of systematic uncertainties at the largest zenith angles are still underway, but since the effect on the final spectrum is small, , the combined spectrum given here includes all data, up to zenith angles of .
The energy binning of the differential flux shown in the figure is chosen to be 12 bins per decade. For the final two points of the spectrum, beyond energies of 30 TeV, the binning is three times coarser, 4 bins per decade, accounting for decreasing event statistics at the highest energies. For the actual positioning of the flux points within an energy bin, the method proposed in Lafferty & Wyatt (1995) is adopted: the point appears at the energy value, where the flux value predicted by an effective-area weighted model spectral shape (a power law with exponential cutoff) is equal to the mean flux value over the energy bin. Note that this is only relevant for wide bins. Here, for the spectrum of Fig. 4, the procedure results in flux points that are placed within 1% of the central energy value of the bin. Only for the two last points the difference is considerable, they end up at 7 and 12% smaller energy values than the bin centre.
The combined H.E.S.S. spectrum of RX J1713.73946 shown in Fig. 4 extends over almost three decades in energy, and is compatible with previous H.E.S.S. measurements. Kelner et al. (2006) have recently presented a new analytical expression (a modified exponential cutoff with exponent ) for secondary gamma-ray spectra from inelastic proton-proton interactions based on Monte-Carlo simulations. Table 4 provides the results of fitting this function, in addition to several other functional forms to the data. A pure power-law model is clearly ruled out, the alternative spectral models provide significantly better descriptions of the data. For the modified exponential-cutoff shape, the exponent was fixed at 1.0, 0.5 and 0.45. The latter value was chosen because it yields the smallest value. The cutoff energy of the gamma-ray spectrum was found to vary depending on , values of TeV, TeV, and TeV were fit, and none of the three values is statistically favoured over the other taking the value of as measure. Under the assumption that indeed the VHE gamma rays are due to cosmic-ray protons interacting with ambient matter and subsequent decay, one might get an idea of the parameters of the parent proton spectrum. Following the approach of Kelner et al. (2006), proton cutoff values in the range of 50 to 150 TeV with spectral indices ranging from 1.7 to 2.1 would be fully compatible with the gamma-ray data presented here. Note, however, that a proton cutoff in the 100 TeV range does not mean the spectrum terminates at this energy. Especially in case of a hard power-law index there would be a sufficient number of protons beyond the cutoff energy.
Combining the data of three years it is possible to extend the gamma-ray spectrum up to energies beyond 30 TeV. Taking all events with energies above 30 TeV, the cumulative significance is . Table 5 lists all the flux points together with bin-by-bin event statistics.
| # | E (TeV) | ON | OFF | Flux | Range (TeV) | ||
| 1 | 0.33 | 5890 | 5134 | 1.00 | 7.2 | 0.30 – 0.37 | |
| 2 | 0.40 | 5583 | 4797 | 1.00 | 7.7 | 0.37 – 0.44 | |
| 3 | 0.49 | 4878 | 4010 | 0.97 | 10.5 | 0.44 – 0.54 | |
| 4 | 0.59 | 4202 | 3409 | 0.94 | 11.6 | 0.54 – 0.65 | |
| 5 | 0.71 | 3900 | 2941 | 0.94 | 14.2 | 0.65 – 0.79 | |
| 6 | 0.86 | 3682 | 2833 | 0.97 | 11.9 | 0.79 – 0.95 | |
| 7 | 1.04 | 3881 | 2643 | 0.98 | 16.1 | 0.95 – 1.15 | |
| 8 | 1.26 | 3982 | 2758 | 0.97 | 16.0 | 1.15 – 1.39 | |
| 9 | 1.53 | 4076 | 2661 | 0.98 | 17.9 | 1.39 – 1.69 | |
| 10 | 1.85 | 3873 | 2603 | 0.97 | 17.0 | 1.69 – 2.04 | |
| 11 | 2.24 | 3452 | 2251 | 0.98 | 16.8 | 2.04 – 2.47 | |
| 12 | 2.71 | 3215 | 2113 | 0.98 | 15.9 | 2.47 – 2.99 | |
| 13 | 3.28 | 3075 | 2081 | 0.98 | 14.6 | 2.99 – 3.63 | |
| 14 | 3.98 | 2915 | 2057 | 0.98 | 12.9 | 3.63 – 4.39 | |
| 15 | 4.81 | 2537 | 1721 | 0.98 | 13.1 | 4.39 – 5.31 | |
| 16 | 5.82 | 2183 | 1555 | 0.98 | 10.8 | 5.31 – 6.43 | |
| 17 | 7.05 | 1961 | 1525 | 0.98 | 7.9 | 6.43 – 7.79 | |
| 18 | 8.53 | 1507 | 1208 | 0.98 | 6.2 | 7.79 – 9.43 | |
| 19 | 10.33 | 1211 | 881 | 0.98 | 7.6 | 9.43 – 11.41 | |
| 20 | 12.51 | 881 | 664 | 0.99 | 5.8 | 11.41 – 13.81 | |
| 21 | 15.14 | 652 | 551 | 0.99 | 3.2 | 13.81 – 16.72 | |
| 22 | 18.32 | 473 | 364 | 0.99 | 4.0 | 16.72 – 20.24 | |
| 23 | 22.18 | 327 | 260 | 0.99 | 2.9 | 20.24 – 24.50 | |
| 24 | 26.85 | 220 | 153 | 0.99 | 3.6 | 24.50 – 29.66 | |
| 25 | 32.50 | 182 | 110 | 0.99 | 4.3 | 29.66 – 35.91 | |
| 26 | 47.19 | 227 | 180 | 0.99 | 2.5 | 35.91 – 63.71 | |
| 27 | 81.26 | 51 | 37 | 0.99 | 1.5 | 63.71 – 113.02 | |
| 0.6 | |||||||
| 28 | 169.79 | 14 | 11 | 1.00 | Upper Limit | 113.02 – 293.82 |
6 Summary & Discussion
The complete H.E.S.S. data set of the SNR RX J1713.73946 recorded from 2003 to 2005 is presented here. When analysing the data of different years separately and comparing them to each other, a very good agreement is found for both the gamma-ray morphology and the differential energy spectra. The H.E.S.S. telescope system obviously operates stably over the course of three years, if one takes known aging effects into account.
A combined gamma-ray image using hours of H.E.S.S. observations in 2004 and 2005 was generated achieving an unprecedented angular resolution of . The morphology of RX J1713.73946 in VHE gamma rays confirms its earlier characterisation (Aharonian et al. 2006b) of a thick, almost circular shell structure with the brightest regions in the northwest, very similar to the X-ray image of this source. The gamma-ray spectrum of the combined H.E.S.S. data over three years on RX J1713.73946 extends over three orders of magnitude in energy. Although at the edge of sufficient statistical significance, the high-energy end of the gamma-ray spectrum approaches 100 TeV with significant emission beyond 30 TeV. Given the systematic uncertainties in the spectral determination at these highest energies and comparable statistical uncertainties despite the long exposure time, this measurement is presumably close to what can be studied with the current generation of imaging atmospheric Cherenkov telescopes.
From the largest measured gamma-ray energies one can estimate the corresponding energy of the primary particles. If VHE gamma rays are produced via decay following inelastic proton-proton interactions, gamma-ray energies of 30 TeV imply that primary protons are accelerated to in the shell of RX J1713.73946. On the other hand, if the gamma rays are due to Inverse Compton scattering of VHE electrons, accelerated in the shell, off Cosmic–Microwave–Background photons (neglecting the presumably small contributions from starlight and infrared photons), the electron energies at the current epoch can be estimated in the Thompson regime as . At these large energies Klein–Nishina effects start to be important and reduce the maximum energy slightly such that is a realistic estimate.
If one considers the functional representations found for the fit of the gamma-ray spectrum of RX J1713.73946 (c.f. Table 4), the basic findings of Aharonian et al. (2006b) are confirmed with improved statistics and increased energy coverage: a pure power-law spectral shape is clearly ruled out, alternative models like a broken power-law, a power with energy-dependent exponent, and a power law with exponential cutoff describe the data significantly better. Assuming an exponential–cutoff shape, a “slow” cutoff with exponent , as suggested by detailed Monte-Carlo simulations (Kelner et al. 2006), yields a perfect description of the data, however, different values of cannot be distinguished, but would rather require better event statistics at the highest energies.
Given the good agreement of the results presented here with the previously published ones, our restrictive conclusions regarding the nature of the parent particles remain unchanged to those outlined in Aharonian et al. (2006b). Both scenarios with a leptonic, or hadronic primary particle distribution are able to accommodate an exponential–cutoff shape with an index of . However, if the mean magnetic field in the SNR region is indeed strongly amplified by the shock to values well beyond typical interstellar fields, the hadronic nature of the observed gamma-ray emission would be difficult to conceal and this latter emission scenario would be clearly favoured (Berezhko & Völk 2006).
With the deep H.E.S.S. observations of RX J1713.73946 we approach now energies, at which attenuation due to pair production on the Galactic interstellar radiation field begins to affect the gamma-ray spectrum (Zhang et al. 2006). At the currently measured maximum energy this effect is negligible, particularly since RX J1713.73946 is neither in the direction of the Galactic Center (more than angular separation in line-of-sight), nor is it at the distance where the interstellar radiation field peaks (Moskalenko et al. 2006). RX J1713.73946 will therefore presumably not be the astronomical source, where we will obtain a clear observational confirmation of the attenuation of gamma rays due to the interstellar radiation field. However, RX J1713.73946 remains an exceptional SNR in respect of its VHE gamma-ray observability, being at present the remnant with the widest possible coverage along the electromagnetic spectrum. The H.E.S.S. measurement of significant gamma-ray emission beyond 30 TeV without indication of a termination of the high-energy spectrum provides proof of particle acceleration in the shell of RX J1713.73946 beyond eV, up to energies which start to approach the region of the cosmic-ray knee.
Acknowledgments
The support of the Namibian authorities and of the University of Namibia in facilitating the construction and operation of H.E.S.S. is gratefully acknowledged, as is the support by the German Ministry for Education and Research (BMBF), the Max Planck Society, the French Ministry for Research, the CNRS-IN2P3 and the Astroparticle Interdisciplinary Programme of the CNRS, the U.K. Particle Physics and Astronomy Research Council (PPARC), the IPNP of the Charles University, the South African Department of Science and Technology and National Research Foundation, and by the University of Namibia. We appreciate the excellent work of the technical support staff in Berlin, Durham, Hamburg, Heidelberg, Palaiseau, Paris, Saclay, and in Namibia in the construction and operation of the equipment.
References
- Aharonian et al. (2004a) Aharonian et al. (H.E.S.S. Collaboration) 2004a, APh, 22, 109
- Aharonian et al. (2004b) Aharonian et al. (H.E.S.S. Collaboration) 2004b, Nature, 432, 75
- Aharonian et al. (2005a) Aharonian et al. (H.E.S.S. Collaboration) 2005a, A&A, 437, L7
- Aharonian et al. (2005b) Aharonian et al. (H.E.S.S. Collaboration) 2005b, A&A, 430, 865
- Aharonian et al. (2006a) Aharonian et al. (H.E.S.S. Collaboration) 2006a, submitted to ApJ
- Aharonian et al. (2006b) Aharonian et al. (H.E.S.S. Collaboration) 2006b, A&A, 449, 223
- Aharonian et al. (2006c) Aharonian et al. (H.E.S.S. Collaboration) 2006c, A&A, 457, 899
- Berezhko & Völk (2006) Berezhko, E. G. & Völk, H. J. 2006, A&A, 451, 981
- Berge (2006) Berge, D. 2006, PhD thesis, Ruprecht-Karls Universität, Heidelberg, http://www.ub.uni-heidelberg.de/archiv/6156
- Bernlöhr et al. (2003) Bernlöhr, K., Carrol, O., Cornils, R., et al. 2003, Astroparticle Physics, 20, 111
- Cornils et al. (2003) Cornils, R., Gillessen, S., Jung, I., et al. 2003, APh, 20, 129
- Drury et al. (1994) Drury, L. O., Aharonian, F. A., & Voelk, H. J. 1994, A&A, 287, 959
- Funk et al. (2004) Funk, S., Hermann, G., Hinton, J., et al. 2004, Astroparticle Physics, 22, 285
- Hillas (2005) Hillas, A. M. 2005, Journal of Physics G Nuclear Physics, 31, R95
- Hinton et al. (2005) Hinton, J., Berge, D., & Funk, S. 2005, in Conference Proceedings ”Towards a Network of Atmospheric Cherenkov Detectors VII”, Palaiseau, France
- Hiraga et al. (2005) Hiraga, J. S., Uchiyama, Y., Takahashi, T., & Aharonian, F. A. 2005, A&A, 431, 953
- Hofmann et al. (1999) Hofmann, W., Jung, I., Konopelko, A., et al. 1999, Astroparticle Physics, 12, 135
- Hofmann (2005) Hofmann, W. (H.E.S.S. Collaboration) 2005, in Conference Proceedings ”Towards a Network of Atmospheric Cherenkov Detectors VII”, Palaiseau, France, 43–56
- Kelner et al. (2006) Kelner, S. R., Aharonian, F. A., & Bugayov, V. V. 2006, Phys. Rev. D, 74, 034018
- Lafferty & Wyatt (1995) Lafferty, G. D. & Wyatt, T. R. 1995, Nuclear Instruments and Methods in Physics Research A, 355, 541
- Li & Ma (1983) Li, T.-P. & Ma, Y.-Q. 1983, Astrophysical Journal, 272, 317
- Moskalenko et al. (2006) Moskalenko, I. V., Porter, T. A., & Strong, A. W. 2006, ApJ, 640, L155
- Uchiyama et al. (2002) Uchiyama, Y., Takahashi, T., & Aharonian, F. A. 2002, PASJ, 54, L73
- Vincent et al. (2003) Vincent, P. et al. (H.E.S.S. Collaboration) 2003, in Proc. 28th ICRC, 2887
- Zhang et al. (2006) Zhang, J.-L., Bi, X.-J., & Hu, H.-B. 2006, A&A, 449, 641