Multi-wavelength variability of the magnetar 4U 0142+61
Abstract
We have collected data spanning seven years of observations of the magnetar 4U 0142+61 in the infrared, optical and soft X-rays. These combine our own observations and analysis of archival data. We find that the source is variable in the optical, in contrast to what had been previously reported, that the K-band flux can vary by over a magnitude on the time-scale of days, and that the X-ray pulsed flux is not obviously correlated with either the total X-ray flux or infrared and optical fluxes. Furthermore, from multi-color photometry of the source within single nights, we conclude that there are two separate components to the infrared emission. The overall picture is unclear, and prompts the need for further, more frequent observations.
1 Introduction
The Anomalous X-ray Pulsars (AXPs) are a group of about six young, energetic neutron stars. They are termed anomalous since their energy source was initially not known: the rotational spin-down luminosities are too low and no binary companions are found. They are now modeled as magnetars along with the Soft Gamma-ray Repeaters. Magnetars are neutron stars with external magnetic fields of the order G and even stronger internal fields. It is this magnetic field which acts as an energy reservoir and powers the observed emission as it decays (Thompson & Duncan, 1995, 1996). See Woods & Thompson (2004) for a review of magnetar characteristics.
The variability of AXPs has for a long time been of interest both in the X-ray band and the infrared for long-term and transitory events. For example, whereas 1E 2259+586 and XTE J1810197 showed correlated X-ray and infrared emission following outbursts (Tam et al. 2004; Gotthelf at al. 2004), Durant & van Kerkwijk (2005) found that for 1E 1048.15937 there was possibly an anti-correlation between the infrared and X-ray fluxes. Nevertheless, the AXPs generally seem to have consistent X-ray to infrared flux ratios.
4U 0142+61 was discovered at a 8.7s X-ray pulsar by Israel et al. (1994), and is the brightest of the AXPs in the sky. It was initially modeled with a hot black-body spectrum ( keV, e.g. White et al. 1996), and soft power-law at higher energies. No narrow features have yet been found in the X-ray spectrum in the 1–10 keV range (Juett et al. 2002).
Hulleman et al. (2000, 2004) detected 4U 0142+61 in the optical and infrared. The emission was found to be orders of magnitude below the extrapolation of an X-ray power-law fitted to the X-ray spectrum, yet orders of magnitude above the extrapolation of an X-ray black-body component. By excluding the possibility of a faint binary companion or of substantial accretion from supernova fall-back material, they excluded two alternative scenarios to the magnetar model. The optical emission was found to be pulsed at the pulsar period, with a large pulsed fraction (Kern & Martin, 2002; Dhillon et al. 2005), clearly identifying it as magnetospheric in origin.
Recently, 4U 0142+61 has been detected in new spectral windows: Wang et al. (2006) detected the object in two Spitzer imaging bands, attributing the measured flux to thermal emission from a dusty circumstellar disc; and den Hartog et al. (2006) identified the AXP from long (2MS) INTEGRAL observations - they found it has a rising spectrum in the 20–150keV range which dominates the energetics.
Durant & van Kerkwijk (2006) determined the interstellar extinction to 4U 0142+61 by direct measurement of the optical depths in individual photo-electric absorption edges from high-resolution X-ray spectra. They found that the inferred column density was 40% less than had typically been stated from broad-band spectral modeling, which solved a long-standing inconsistency between the implied reddening to the source and the total reddening along the line of sight (see Hulleman et al. 2004). This also revealed a possible, broad spectral feature in the X-ray spectrum near 830 eV (13Å), a first for an AXP.
In this paper we present many different observations at different epochs, from different observatories and in different parts of the spectrum. Some of these we take from the literature, some we have obtained from archival data and some are from our own observations. We describe in detail the data and reduction for both the observations we obtained and those retrieved from the archives. The following sections enumerate the observations in decreasing order of wavelength. In Section §5 we compare both our data and those in the literature and investigate the time-scales, correlations and spectral dependence of the variability seen.
2 Near-Infrared Observations
Table 1 lists all the observations of 4U 0142+61 we are aware of in the near-infrared (NIR), spanning several years. The Keck magnitudes were taken from Hulleman et al. (2004), and we obtained new observations from Gemini. For the other observations (from CFHT and Subaru), we analyzed data from the archives. All the final magnitudes and associated uncertainties are listed in Table 1. We briefly describe the reduction and analysis procedures we followed for each of the observations that we analyzed.
For the K-band, we have analyzed observations taken in the three similar, but not identical, filters: K, KS, and K’. Each has a roughly rectangular bandpass, centered on , 2.15 and 2.12 m and with width 0.16, 0.15 and 0.18 m, respectively. Using KS as our baseline, the overlap between the filters is greater than 80% for K and greater than 90% for K’. From the standard star list of Oersson et al. (1998) and their interpolation to K’111see http://www.mpia-hd.mpg.de/IRCAM/FAINTSTD/faintstd_kprime.html, we find that the magnitude difference between KS and K, and K’ and K is between 0 and 0.04 mag for a range of stellar colors. Since 4U 0142+61 has an intermediate color, the uncertainty on the K flux from assuming that the filters are identical is at most 4%.
2.1 Gemini
The Gemini observations were taken in a concerted effort to investigate the infrared variability of 4U 0142+61, using NIRI, the Near Infrared Imaging instrument (Hodapp et al. 2003) at Gemini-North. NIRI is available for both imaging and spectroscopy, and can be used as the detector for the output of ALTAIR, the Gemini adaptive optics (AO) system. Here we do not use AO. The plate scale is 011 per pixel on the 1024 square Aladdin array.
The observation are from four separate nights from September 2003 to July 2005. On the 2, Nov 2004 H-and J-band images were obtained in addition to the K-band images. The last of our Gemini infrared observations (July 2005) was taken under a DDT proposal to attempt to observe 4U 0142+61 across the whole EM spectrum quasi-simultaneously (see Den Hartog et al, in prep.).
We created final images after subtracting dark frames and dividing by a flat-field image derived from the science images. For the image, we measured our magnitudes relative to the stars listed in Hulleman et al. (2004). We find that the relative zero-point offsets accurate to mag, and that the magnitudes measured for the AXP are in-between the and magnitudes presented by Hulleman et al. In November 2004, we also obtained images of standard stars FS-34, FS-112 and FS-145 in all three filters, and used these to calibrate the magnitude zero points of the J- and H-band images. To do this, we calculated an aperture correction for the science images by performing aperture photometry around our PSF stars with the same large aperture used to measure the standard stars. These calibrations are not as accurate as for the K-band (uncertainty mag), but the detections are poorer, so this does not contribute any additional uncertainty.
2.2 CFHT
Israel et al. (2004) reported observations of 4U 0142+61 on 18 August 2002 with the Adaptive Optics Bonette (AOB, Rigaut et al. 1998) of Canada-France-Hawaii Telescope (CFHT), Hawaii. The adaptive optics system produces PSFs of reduced size in order to increase the signal-to-noise ratio, and the corrected beam is imaged by KIR, a 1024 square Hawaii infrared detector with 0035 per pixel. We retrieved the data from the CADC archive and re-analyzed them in order to derive accurate relative magnitudes. The frames were dark-subtracted and then flat-fielded using the median of the data frames. The field of view is relatively small and contains only a handful of stars. The FWHM of the PSF near the AXP was 14.
We performed photometry using the PSF-fitting package, daophot (Stetson, 1987). The PSF varies somewhat across the field of view, so we constructed the model PSF from a few stars distributed across the field. The analytic portion of the PSF was best fitted by a Lorentzian function, and the residual image showed no systematic effects.
To calibrate the magnitude zero-points for the K-band image, we used the photometry of several stars in the field listed by Hulleman et al. (2004). The KS band and K’ band do not exactly co-incide, but they are very close in effective wavelength (2.15m and 2.12m respectively), and so we treat them as identical, in the absence of standard stars observed on the night. To calibrate the J- and H-band photometric zero points, we used our images from Gemini (above).
We verified our calibration with two 2MASS stars on the image, which gave consistent zero points. We chose to use the relative photometry as it does not add any additional uncertainty. With the relative photometry we compare the brightness of our source with stars of similar brightness rather than the 2MASS stars which are much brighter.
2.3 Subaru
4U 0142+61 was imaged with the Infrared Camera and Spectrograph for the Subaru Telescope (IRCS, Kobayashi et al. 2000) on two successive nights, Sep 3 and 4, 2003 - see Morii et al. (2005). IRCS has a 1024 pixel square Aladdin array, with 0053 per pixel. On the first night, only K-band imaging was performed, and on the second night J, H and K. We retrieved the data from the archives (SMOKA) and reduced them.
The IRCS detector suffers from a number of cosmetic artifacts, and variable sensitivity across the detector. In order to successfully perform the flat-fielding, we found the screen flats only partially useful, leaving medium to large scale variations uncorrected. We created flat-field images by taking the median of the science images, scaled by the mode of their data and after rejecting outliers. For the K-band images of the second night (showing the largest variations across the field and with a variable sky background), we used both the screen flat, followed by the median of the partially corrected images.
The photometry for the -band was calibrated relative to Hulleman et al. (2004) and relative to the Gemini frames above for the H- and J-bands, as for the CFHT images. The 2MASS stars in the field again give consistent zero-point offsets to our method.
| Date | MJD | Telescope/Instrument | aaMagnitudes refer to the K, KS and K’ bands, as shown. These are all approximately interchangeable (see text). | ||
|---|---|---|---|---|---|
| 1999-02-08 | 51393 | Keck-I/NIRC | bbTaken from Hulleman et al. (2004). | ||
| 2001-10-30 | 52213 | Keck-I/NIRC | bbTaken from Hulleman et al. (2004). | ||
| 2002-08-18 | 52505 | CFHT/AOB | |||
| 2003-09-08 | 52891 | Subaru/IRCS | |||
| 2003-09-09 | 52892 | Subaru/IRCS | |||
| 2003-09-14 | 52897 | Gemini/NIRI | |||
| 2003-10-29 | 52942 | Gemini/NIRI | |||
| 2004-11-02 | 53312 | Gemini/NIRI | |||
| 2005-07-26 | 53578 | Gemini/NIRI |
Note. — Uncertainties are 1-sigma, and do not include zero-point errors (which are small in comparison); they are accurate relative to one-another.
3 Optical Observations
Table 2 lists all the observations of 4U 0142+61 in the optical over the last few years. We include both measurements made by us from our own observations, and several from the literature. We do not have access to any of the archival data, so re-analysis for better relative photometry was not possible.
| Date | MJD | Telescope/Instrument | |||
|---|---|---|---|---|---|
| 1994-10-31 | 49657 | Keck-I/LRIS | aaTaken from the literature: Hulleman et al. (2004), Dhillon et al. (2005) and Morii et al. (2005) | aaTaken from the literature: Hulleman et al. (2004), Dhillon et al. (2005) and Morii et al. (2005) | |
| 1999-09-06 | 51428 | Keck-II/LRIS | aaTaken from the literature: Hulleman et al. (2004), Dhillon et al. (2005) and Morii et al. (2005) | aaTaken from the literature: Hulleman et al. (2004), Dhillon et al. (2005) and Morii et al. (2005) | |
| 2002-09-12 | 52530 | WHT/ULTRACAM | aaTaken from the literature: Hulleman et al. (2004), Dhillon et al. (2005) and Morii et al. (2005) | aaTaken from the literature: Hulleman et al. (2004), Dhillon et al. (2005) and Morii et al. (2005) | |
| 2003-01-02 | 52642 | Keck-II/ESI | |||
| 2003-09-04 | 52887 | UH88/OPTIC | aaTaken from the literature: Hulleman et al. (2004), Dhillon et al. (2005) and Morii et al. (2005) | aaTaken from the literature: Hulleman et al. (2004), Dhillon et al. (2005) and Morii et al. (2005) | aaTaken from the literature: Hulleman et al. (2004), Dhillon et al. (2005) and Morii et al. (2005) |
| 2003-12-21 | 52995 | Keck-II/ESI | |||
| 2005-07-13 | 53566 | Gemini/GMOS | |||
Note. — Magnitudes that are not in the standard Johnson-Cousins system are listed under the nearest band, and the appropriate filter is given. These are based on the Sloan filter-set and have magnitudes which follow the AB system, rather than Vega magnitudes. The estimated Johnson-Cousins magnitudes are given immediately below each (for this is not possible, since it lies blueward of V).
3.1 Keck
We obtained two nights of observations of 4U 0142+61 using the Echellette Spectrograph and Imager (ESI; Epps & Miller, 1998) at Keck-II, Hawaii. In imaging mode, the instrument provides a standard set of Johnson-Cousins filters, with the exception of the R-band, where the Ellis filter is used (), which is slightly shifted from the standard Cousins R filter.
The detector employs dual-amplifier readout, and the bias has to be subtracted from the two separate regions of the images (the bias is easily derived from over-scan regions). In the case that the field of view was located wholly within one amplifier area, we discarded the other half of the image. We created flat-field images from screen-flats taken on each night, and registered and stacked the images after the correction. Since the observations in each band typically consisted of only two images, some artifacts and cosmic rays remain on the final image. None of these fall close to the object of interest, and they do no affect our measurements.
To calibrate the photometric zero points, we compared our instrumental magnitudes (from PSF fitting) with those listed in Hulleman et al. (2004). Whereas the I- and V-bands required no color term, the -band does, since it does not well match the standard Cousins R-band. Fortunately, we identified enough stars in the December observation to achieve a well-defined zero-point offset versus color. For the January 2003 observation, rather that repeat this process, we found the relative offset from one image to the other and used the same calibration (since the January observation was less good). Photon-noise dominates the uncertainty in the magnitudes listed in Table 2.
3.2 Gemini
As part of the simultaneous, multi-wavelength observation campaign for 4U 0142+61 (see §2.1 above), we obtained imaging data with the Gemini Multi-Object Spectrograph (GMOS-North, Hook et al. 2004). GMOS is equipped with an integral field unit, but we used it in imaging mode, with one amplifier covering a 10242304 pixel region with a pixel scale of 007. Unfortunately, the instrument is equipped with the SLOAN filter-set rather than Johnson-Cousins filters, so we opted for the middle of the optical band with the r’ filter.
We subtracted the bias and applied a screen-flat correction, before stacking the images, and analyzing them with daophot as before. For the calibration, we used again the photometry listed in Hulleman et al. (2004), interpolating between the R- and V-bands using the relationship in Smith et al. (2002). Since we do not have a measure of color from the GMOS observations, we cannot interpolate the magnitude to either the R- or I-bands for comparison with earlier observations. However, we can obtain from earlier measurements. Doing this, we find that the r’ magnitude is consistent with that inferred from the 01/2003 observations, but not from the other pairs of V and R magnitudes.
4 X-ray Observations
4U 0142+61 has been the subject of a long-term monitoring campaign with the Rossi X-ray Timing Explorer (RXTE) satellite. These observations have yielded roughly weekly measurements of the pulsed flux and pulse period of the pulsar. In addition, there have been extensive observations with XMM-Newton (the X-ray Multi-mirror Mission, see below) and Chandra (e.g. Juett et al. 2002). We do not consider the Chandra data, since there have been too few observations and using different instruments/modes to be useful.
4.1 RXTE
The Proportional Counter Array (PCA) instrument of RXTE has five proportional counting units, and provides very high time-resolution and moderate energy resolution in the 2–60 keV energy range (Jahode et al. 1996). The pulsed flux measurements are much more reliable than the total flux due to the non-imaging nature of the PCA instruments, and the nearby variable high-mass binary X-ray pulsar RX J0146.9+6121 (Motch et al. 1991). Observations were made for the epoch to 53700.
The data was analyzed in the same procedure as described in Gavriil & Kaspi (2002): an average pulse profile was created from several observations, and cross-correlated with each observation in order to obtain the (barycentred) average pulse arrival times, without losing coherence from one observation to the next.
The timing of the pulsar was found to be stable across the whole epoch, and well-described by a single ephemeris. Phase residuals are less than 0.05 cycles for the entire time-span.
In the first analysis, it appeared that the pulsed flux increased nearly linearly with time, by about 40% across the whole time-span. On closer inspection, this was found to be the case for only one of the five PCUs, and hence its data were discarded. We here use the pulsed flux measurements only from the remaining (four or less) PCUs. See Dib et al. (2006) for details.
4.2 XMM-Newton
In addition to the RXTE data, we analyzed archival XMM-Newton data, which is able to measure the total flux rather than just pulsed flux due to its better spatial resolution. Four observations exist in the archives, and these too span the range of time comparable to the other data. XMM has three telescopes and five instruments which take data simultaneously, but we decided only to use the data from the Reflection Grating Spectrometers (RGS; den Herder et al. 2001), since they were used in the same observation mode for all four observations.
We used the standard pipeline and the Science Analysis Software, (6.1.0, 2004-11-22) and the latest calibration files. For the final (background-subtracted) fluxes, we used the SAS task rgsfluxer. Although this task is not recommended for detailed spectral analysis, for calculating the total flux, its accuracy is ample.
In the range 515eV to 1550eV (8 to 15Å, where the sensitivity and calibration are well known), we find statistically significant variability between the observations, but only by about 10% at most, see Table 3.
| Obs Code | Date | MJD | Flux (8–15Å) |
|---|---|---|---|
| ( erg s-1 cm-2) | |||
| 0112780301 | 2000-12-28 | 51907 | |
| 0112481101 | 2003-01-24 | 52664 | |
| 0206670101 | 2004-03-01 | 53066 | |
| 0206670201 | 2004-07-25 | 53212 |
Note. — 1-sigma errors are derived from the XMM task rgsfluxer
5 Results
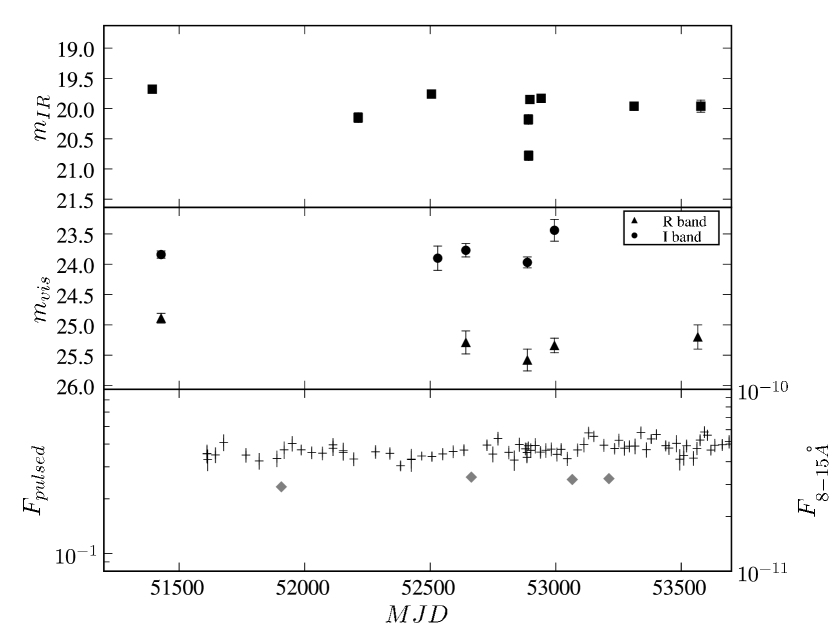
We plot the results of the measurements in infrared, optical and X-rays in Figure 1. For the optical magnitudes made under the AB magnitude system (from WHT/ULTRACAM and Gemini/GMOS-N), we estimate the appropriate Johnson-Cousins magnitude based on the transformations of Smith et al. (2002). In neither of the cases do we have colors, but these can be estimated from the range of colors from the other observations. We show the points with increased error-bars to account for this uncertainty (see also Table 2).
5.1 Variability Time-scales
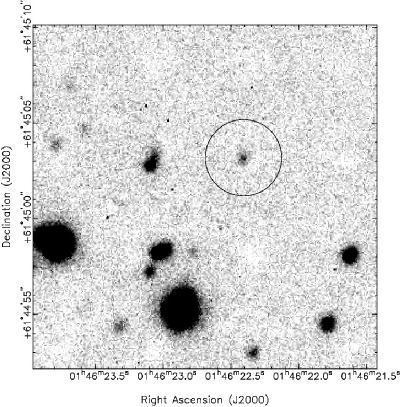
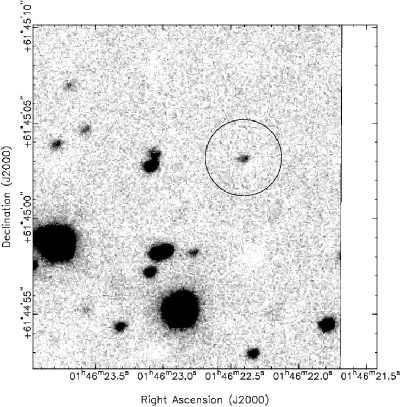
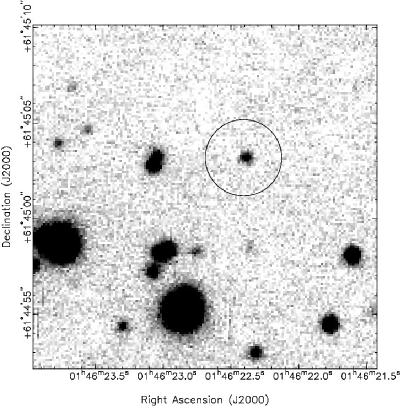
Whereas 4U 0142+61 was regularly observed with RXTE roughly once a week, the shortest delay between subsequent measurements occurred in the infrared K-band, with three observations within a week in September 2003. We find that the source varied by over a magnitude over a time-scale of days. Such rapid and large variability was not expected and was not seen before. Even more surprising, is the rapid dimming between the two Subaru nights – a rapid brightening could have been explained as originating in some kind of energetic outburst.
In figure 2 we show the three images of 4U 0142+61 in question, and clearly the object does vary substantially. The background blemish visible in the Subaru images near the source is outside of the PSF fitting radius and does not affect the photometry.
In the other wave-bands, such rapid variability is not seen, but the sampling has not been dense enough for us to be able to discount the possibility. Only in the X-ray can we state that for the longest observation, 44.1ks for the March 2004 observation, the flux remained constant within the observation to high precision (in the 8–15Å range).
5.2 Correlations
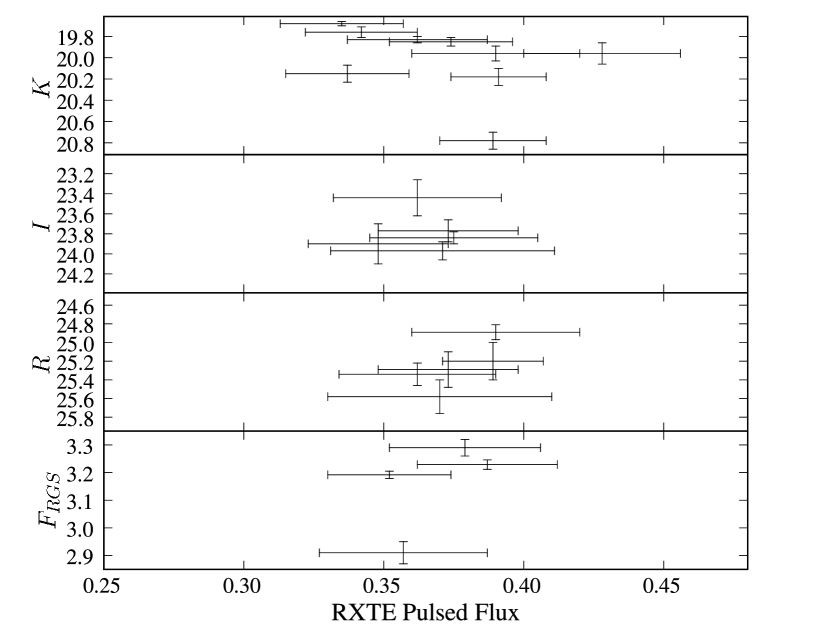
We plot the flux measurement of 4U 0142+61 in the infrared, optical and X-rays versus time in Figure 1, and in Figure 3 we plot the measures of flux against one-another. We have calculated the RXTE pulsed flux appropriate for each observation in another band by linear interpolation between the two closest measurements in time.
No clear picture emerges from the two Figures. There is no apparent correlation between the K-band magnitude and pulsed flux. For the I and R bands and the XMM/RGS flux, the range of values is not big enough compared to the uncertainties to be able to make a definite statement.
Intriguingly, the large feature in the time-series of K-band photometry starting around , showing a rapid dimming and re-brightening, has no change in the pulsed X-ray emission at that time. At this time, the source was at its faintest in and (but not ).
5.3 Spectral Changes and Components
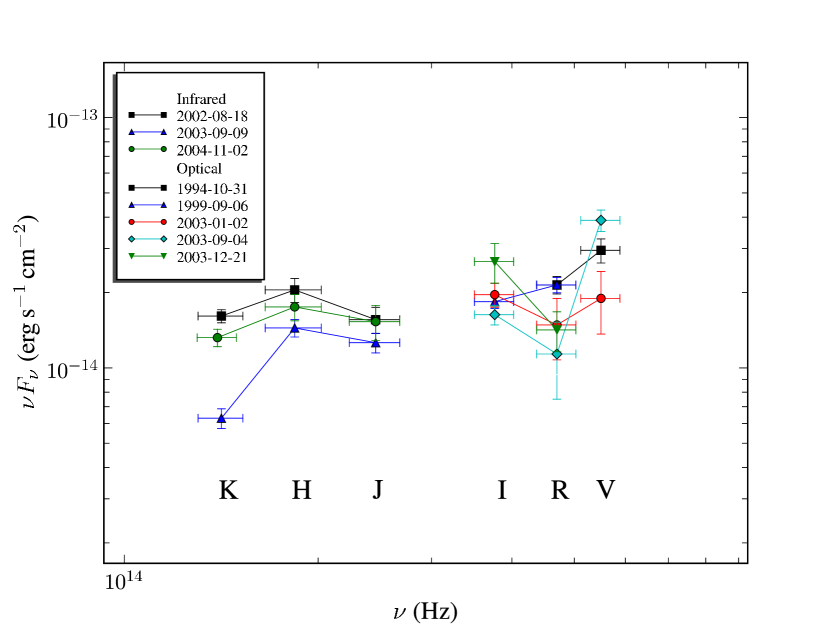
In Figure 4, we show infrared and optical spectral energy distributions for each observations (each spectrum from within a simgle night’s observation). In the infrared, the magnitude in H is clearly correlated with K, but K varies more than H. For J, it is not clear from our data whether it is also related to K, or whether it is better described as remaining constant; both are consistent with the data.
For the optical, the data show no apparent correlation at all between and . With only two simultaneous and measurements, we can say nothing of their possible relationship, except that both do vary (the estimated I and V magnitudes from the ULTRACAM data have very large uncertainties associated with them). The spectrum appears to be markedly different for each observation.
6 Conclusions and Discussion
We have shown that the infrared emission of 4U 0142+61 varies by over a magnitude on the time-scale of days, that there are no obvious correlations between the infrared, optical and X-ray fluxes. The lack of correlations suggests that separate emission component are required for the various parts of the spectrum.
The first important point is that although we see no obvious correlations, if the flux in any given wave-band is varying as fast as it varies in the infrared, the observations are not near enough to simultaneous to be certain. Only a concerted campaign of simultaneous observations at each wavelength would resolve this issue. In this study we are not sensitive to shorter time-scales, so even faster variability could in principle be occurring. On the other hand, the longest XMM observations reveals a steady light-curve for over 44ks, and significant changes are not seen in the individual exposures which make up each optical/infrared observation. (The latter is not very conclusive, however, as the signal in each frame is only small.)
The variability in the optical comes as a surprise, following Hulleman et al’s (2000) statement that they saw stability to within 0.02 mag, and Dhillon et al.’s (2004) rough agreement with these magnitudes. The variability is most pronounced in the R-band, and suggests that perhaps there were transitory absorption features (e.g. in the UH88 R-band observation). Beloborodov & Thomson (2006) suggest two likely mechanisms for the optical emission from a magnetar. One possibility is from ions from the outer magnetosphere, which absorb surface radio and microwave radiation at their cyclotron resonance, and re-emit as they head nearer the poles to higher cyclotron energies. A second possibility is coherent curvature radiation from bunched pairs. Both mechanisms can in principle explain the B-band cut-off seen by Hulleman et al. (2004), but both also predict a smooth spectrum at longer wavelengths. These predictions are valid, however, only for the equilibrium state, and how they would be affected by variations of magnetic field and particle kinetic energies is as yet unclear.
Wang et al. (2006) detected 4U 0142+61 in the mid-infrared using Spitzer, with fluxes well described as a cool thermal spectrum. They proposed that the K-band emission also arises mainly from a dusty circumstellar fall-back disc at the sublimation radius, which reprocesses incident X-rays. If this were so, one would expect a strong correlation with X-ray flux (with perhaps a time-lag). We see, however, that the X-ray flux varies by much less than the K-band, that there is no variability in the longest (44ks) XMM observation, and that the pulsed component is roughly stable across the whole epoch. In particular, we see no counterpart in X-rays to the dimming even seen in the K-band.
These measurements relate, however, to only the soft part of the X-ray spectrum, whereas den Hartog et al. (2006; see also Kuiper et al. 2006) have shown from INTEGRAL data that a rising power-law component in the range 20–150keV dominates the energetics. Due to the low photon-flux and instrumental sensitivity, time resolution of the order of days is not currently possible, and it is unclear whether any variability has been seen in the INTEGRAL observations to date (P. den Hartog, 2006, pers. comm.).
If the infrared emission is magnetospheric in origin (e.g. from cyclotron emission), one would expect it to be varying on the fastest time-scales. This is because the region with cyclotron energies in the infrared range is farthest from the neutron star and thus contains the smallest inertia both in particles and in the magnetic field energy (the latter being dominant). We have shown from the correlation between the infrared magnitudes in KHJ that the component responsible for the variability in K affects also H and possibly J, but is dominant towards the long-wavelength end of the infrared.
The lack of obvious correlations between the various spectral bands comes as another surprise, compared to cases such as that of 1E 2259+586, where the X-ray and infrared decreased on the same time-scale following an outburst (Tam et al. 2004). The latter case may, however, have been a special one, where the normal emission mechanisms were overwhelmed by an extra reservoir of energy which was deposited at the time of the flare. Either the spectral components are truly independent and caused by unique emission mechanisms, the variability is of a larger scale and shorter time-scale than had been previously thought, or there is some hysteresis in the system, which creates a lag between the emission observed in different wave-bands.
It seems clear that in order to understand the variability of this intriguing source, multi-wavelength observations must be made much more frequently than done until now. Nevertheless, a number of hints and interesting relationships seem to be revealing themselves through persistent examination.
References
- (1) Beloborodov, A & Thompson, C., 2006, ApJ submitted, (arXiv:astro-ph/0602417)
- (2) den Herder, J., et al., 2001, A&A, 365, L7
- (3) den Hartog, P., Hermsen, W., Kuiper, L., Vink, J., in ’t Zand, J., Collmar, W., 2006, A&A, accepted (see arXiv:astro-ph/0601644)
- (4) Dhillon, V., Marsh, T., Hulleman, F., van Kerkwijk, M., Shearer, A., Littlefair, S., Gavriil, F., Kaspi, V., 2005, MNRAS, 363, 609
- (5) Dib, R., Gonzalez, M., Kaspi, V., Gavriil, F., 2006, ApJ, submitted
- (6) Durant, M. & van Kerkwijk, M., 2005, ApJ, 627, 376
- (7) Durant, M. & van Kerkwijk, M., 2006, ApJ, accepted (astro-ph/0606604)
- (8) Epps, H. & Miller, J., 1998, SPIE, 3355, 48
- (9) Gavriil, F. & Kaspi, V., 2002, ApJ, 567, 1067
- (10) Gotthelf, E., Halpern, J., Buxton, M., Bailyn, C., 2004, ApJ, 605, 368
- (11) Hodapp, K., Jensen, J., Irwin, E., Yamada, H., Chung, R., Fletcher, K., Robertson, L., Hora, J., Simons, D., Mays, W., Nolan, R., Bec, M., Merrill, M., Fowler, A., 2003, PASP, 115, 1388
- (12) Hook, I., J rgensen, I., Allington-Smith, J., Davies, R., Metcalfe, N., Murowinski, R., Crampton, D., 2004, PASP, 116, 425
- (13) Hulleman, F., van Kerkwijk, M., Kulkarni, S., 2000, Nature, 408, 689
- (14) Hulleman, F., van Kerkwijk, M., Kulkarni, S., 2004, A&A, 416, 1037
- (15) Israel, G., Mereghetti, S., Stella, L., 1994, ApJ, 433, L25
- (16) Israel, G., Stella, L., Covino, S., Campana, S., Angelini, L., Mignani, R., Mereghetti, S., Marconi, G., Perna, R., 2004, IAU Symposium 218, eds. Camilo & Gaensler
- (17) Jahoda, K., Swank, J., Stark, M., Strohmayer, T., Zhang, W., & Morgan, E. 1996, Proc. SPIE, 2808, 59
- (18) Juett, A., Marshall, H., Chakrabarty, D., Schulz, N., 2002, ApJ, 568, L31
- (19) Kern, B., Martin, C.,2002, Nature, 417, 527
- (20) Kobayashi, N., et al. 2000, IRCS: Infrared Camera and Spectrograph for the Subaru Telescope, in Proc. SPIE 4008: Optical and IR Telescope Instrumentation and Detectors, eds M. Iye & A. F. Moorwood, 1056
- (21) Kuiper, L., Hermsen, W., den Hartog, P., Collmar, W., 2006, ApJ accepted, (arXiv:astro-ph/0603467)
- (22) Morii, M., Kawai, N., Kataoka, J., Yatsu, Y., Kobayashi, N., Terada, H., 2005, Adv Sp Res, 35, 1177
- (23) Motch, C., Belloni, T., Buckley, D., Gottwald, M., Hasinger, G., Pakull, M., Pietsch, W., Reinsch, K., Remillard, R., Schmitt, J., Trumpler, J., Zimmermann, H., 1991, A&A, 246, L24
- (24) Persson, S., Murphy, D., Krzeminski, W., Roth, M., Rieke, M., 1998, ApJ, 116, 2475
- (25) Rigaut, F., Salmon, D., Arsenault, R., Thomas, J., Lai, O., Rouan, D., Véran, J., Gigan, P., Crampton, D., Fletcher, J., Stilburn, J., Boyer, C., Jagourel, P., 1998, PASP, 110, 152
- (26) Smith, J., Tucker, D., Kent, S., et al. 2002, AJ, 123, 2121
- (27) Stetson, P., 1987, PASP, 99, 191
- (28) Tam, C., Kaspi, V., van Kerkwijk, M., Durant, M., 2004, ApJ, 617, L53
- (29) Thompson, C. & Duncan, R., 1995, MNRAS, 275, 255
- (30) Thompson, C. & Duncan, R., 1996, ApJ, 473, 322
- (31) Wang, Z., Chakrabarty, D., Kaplan, D., 2006, Nature, in press
- (32) White, N., Angelini, L., Ebisawa, K.,, Tanaka, Y., Ghosh, P., 1996, ApJ, 463, L83
- (33) Woods, P., & Thompson, C., 2004, in “Compact Stellar X-ray Sources”, eds Levin & van der Klis