Beat Cepheids as Probes of Stellar and Galactic Metallicity
Abstract
The mere location of a Beat Cepheid model in a Period Ratio vs. Period diagram (Petersen diagram) puts very tight constraints on its metallicity . The Beat Cepheid Peterson diagrams are revisited with linear nonadiabatic turbulent convective models, and their accuracy as a probe for stellar metallicity is evaluated. They are shown to be largely independent of the helium content , and they are also only weakly dependent on the mass-luminosity relation that is used in their construction. However, they are found to show sensitivity to the relative abundances of the elements that are lumped into the metallicity parameter . Rotation is estimated to have but a small effect on the ’pulsation metallicities’. A composite Petersen diagram is presented that allows one to read off upper and lower limits on the metallicity from the measured period and period ratio .
Subject headings:
(stars: variables:) Cepheids, stars: oscillations (including pulsations), stars: rotation, galaxies: abundances1. Introduction
The idea of using the periods extracted from the lightcurves of Beat Cepheids (BCs) to constrain the astrophysical parameters of these Cepheids is certainly not new. It goes back to the introduction of Period Ratio vs. Period diagrams, or Petersen (1973) diagrams (PDs). The usefulness of PDs comes from the fact that the period ratios turn out to be strongly dependent on the metallicity . This was subsequently exploited to show that the newly introduced OPAL opacities (Iglesias & Rogers, 1996) largely removed a longstanding mass discrepancy problem (e.g., Moskalik, Buchler & Marom (1992)). With the microlensing projects a large number of extra-galactic BCs were discovered, and the consequent utility of PDs, both observationally, e.g., (Andrievsky et al. , 1994; Beaulieu, Buchler & Kolláth, 2001), and theoretically, e.g., (Morgan & Welch, 1997; Christensen-Dalsgaard & Petersen, 1995; Kovács, 2000) was quickly realized.
The modeling of galactic evolution relies heavily on observational galactic metallicity distributions. The latter have traditionally been estimated by spectroscopic means of a number of different objects: through the observations of HII regions (e.g., Vílchez et al. (1988), Urbaneja et al. (2005)), of B type supergiant stars (Monteverde et al. , 1997) of Planetary Nebulae (Magrini et al. , 2004), of Wolf Rayet stars (Abbott et al. , 2004), of red giant branch photometry (Tiede et al. , 2004) and of classical Cepheids (Andrievsky et al. , 1994). Techniques based on multiband photometry of regular Cepheid lightcurves (Caputo et al. , 2001) and the use of the shapes of Bump Cepheid lightcurves (Keller & Wood, 2006) have also been proposed. All these methods have varying degrees of accuracy and, in the case of M33, for example, a controversy has arisen between the ’traditional’ large value of the [O/H] gradient dex/kpc (Vílchez et al. , 1988; Garnett et al. , 1997) and a revised shallower one of –0.012 dex/kpc of Crockett et al. (2006).
It is therefore extremely useful to have an additional, independent and accurate method for obtaining a metallicity. In this spirit Beaulieu, Buchler, Marquette, Hartman & Schwarzenberg (2006) used 5 newly discovered BCs in M33 as metallicity tracers. From the ’pulsational’ metallicities that they calculated and from the galacto-centric distances of these Cepheids they could extract a metallicity gradient of –0.16 dex/kpc for M33 which allowed them to weigh heavily in favor of the traditional value of [O/H] and against a recent downward revision.
In this paper we explore in some detail both the power and the limitations of the ’pulsational’ determination of the metallicities of BCs on the basis of linear nonadiabatic convective stellar models. In a subsequent paper we will present an extended survey of nonlinear models, and we show how they can be used to further narrow down the metallicity determination of BCs.

2. Linear Pulsation Models for Beat Cepheids
Only the envelope of the Cepheids is engaged in pulsation. This allows theorists a convenient simplification: One needs to construct Cepheid envelopes only on which one imposes an inner boundary condition (v=0) at a fixed core radius , where in addition the luminosity is constant and is provided by the nuclear burning in the stellar interior, a region which is irrelevant insofar as the pulsation is concerned. The envelope which can be taken as chemically uniform because of a prior evolutionary stage of extended convection, is uniquely specified by 3 astrophysical parameters, e.g., the stellar mass , the luminosity and the effective temperature of the equilibrium model (i.e. the state it would be in if it did not pulsate), as well as the composition parameters, i.e. , and , that appear in the equation of state and in the opacities. We recall that and are the mass fractions of hydrogen and helium, and that all other elements are lumped into the ’metallicity’ . The three parameters, , , , are the most convenient from a computational point of view, and are the input to our equilibrium model builder and linear pulsation codes (e.g., Yecko, Kolláth & Buchler (1998)). Other astrophysical parameters can be substituted, but at the expense of an iteration, e.g., the stellar radius of the equilibrium model, , or one or more of the linear periods, , where label the radial pulsation modes. Note that the three basic parameters are also the natural quantities , , and () whose temporal behavior, i.e. the evolutionary tracks, are given by stellar evolution calculations.
Our stellar equilibrium models are constructed and their linear (nonadiabatic) periods and growth rates are computed with the Florida pulsation code. Turbulent convection is approximated with time-dependent mixing length (described e.g., in Kolláth et al. (2002, 1998)) e.g., with the values of the parameters chosen to be {= 2.177, = 0.4, = 0.433, = 0.12, = 0.001, = 0.4, = 0, = 1.5}). OPAL (Iglesias & Rogers, 1996) and Alexander & Ferguson (1994) opacities are used.
For our purposes we can use linear (nonadiabatic) periods. Linear periods are sufficiently accurate because they differ from the nonlinear ones at most in the fourth decimal figure (e.g., Antonello & Aikawa (1998), Szabó & Buchler (2007)). It is in the modal selection problem where nonlinearity plays an important role in limiting the region where beat pulsations can occur (see Kolláth & Buchler (2001), Kolláth et al. (2002)). We will address this issue in Szabó & Buchler (2007) which deals with nonlinear BC model pulsations.
During the galactic evolution metal enrichment occurs through helium and hydrogen burning. Because the helium content thus correlates with , we have assumed a relation , obtained by fitting a parabola in Log Y vs. Log Z through the 3 points (, )= (0.280, 0.020), (0.276, 0.008) and (0.270, 0.004). With this relation we reduce the 3 composition parameters (, =1--, ) to a single one, .
3. Results
3.1. Log – Log plane
In their calculation of the metallicities of the BCs in the M33 galaxy (Beaulieu et al. , 2006) used the 2 observed periods and , and the as the 3 parameters that determine the stellar model. This then produced, for a given composition, a one parameter family of models, with as the parameter. They then further limited the models to those that were linearly unstable simultaneously in the fundamental F and first overtone O1 modes. This yielded, for each , loci of potential BCs in a Log vs. Log diagram (potential because this double instability is only a necessary condition for BCs to exist).
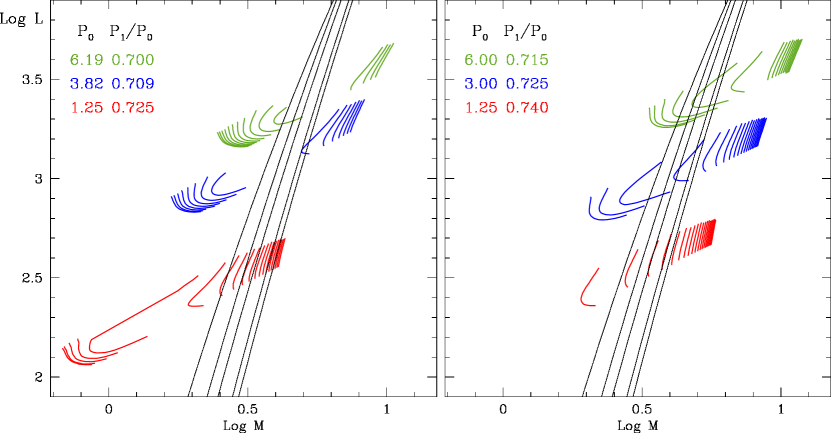
In Fig. 1, to illustrate the procedure, we similarly display the dependent set of loci of 6 hypothetical BCs, with the values that are indicted in the figure. For each sequence (in , with fixed and ) we have plotted the loci as a function of . For the top 2 sequences on the left, ranges from 0.003 to 0.017, and for the other four it ranges from 0.001 to 0.020.
Superposed on the loci we display the - relations derived from Pietrinferni et al. (2006), for = 0.001, 0.004, 0.008, 0.019 and 0.027, from left to right. The acceptable BC candidate models are those for which the locus of a given intersects the - curve for the same . As noted in Beaulieu et al. (2006), as increases the loci move toward the northeast, at first very slowly, then they speed up as they cross the region of the - curves to slow down again when they arrive on the right. It is this rapid crossing of the - region that allows one to narrow down the of the BCs. We recall that the loci depend only on the period and period ratio , and pulsation theory. Stellar evolution comes into play through the - relation which determines what are the acceptable metallicity values for the given and . It is apparent from Fig. 1 of Beaulieu et al. (2006) that these values are relatively insensitive to the chosen - relation (see also § 3.4 below).
While this procedure allows us to determine the metallicity of BCs, it is computer intensive as it necessitates the computation of the loci for a range of , and this for each BC. Furthermore for some parameter values that fall far away from those of normal Cepheids the models do not always converge.
3.2. Log – plane (Petersen Diagrams)
We find it useful to present a different, more practical procedure. This consists of constructing Petersen diagrams ( in which we delimit the ranges of acceptable BC models for a finely spaced set of values. For a given BC with its observationally derived and one can then readily determine into which of these ranges it falls, interpolate, and thus impose upper and lower limits on .
Our PDs are constructed as follows. We specify the F period , and the - relation . These 2 constraints allow us to compute a sequence of models of a specified with different values of and consequently different . Of these models we then only retain those that are linearly unstable both in the F and the O1 mode. Our set of ranges from 0.75 d to 6.5 d. Our values range from 0.001 to 0.026 in steps of = 0.001.
We recall that there exists a slightly slanted, vertical strip in the HR diagram, called the instability strip (IS) in which the stars become unstable to pulsation and are called Cepheids. In Figure 2 we display our doubly unstable models in an HR diagram for selected metallicities (=0.004, 0.008 and 0.019). The lines run at an angle because the sequences (in ) are computed at constant period and constant . The full IS is much wider in as its extends leftward and rightward into the regimes where only the O1 and F modes, respectively, are linearly unstable. Note also that not the whole doubly unstable region will give rise to BCs: first, simultaneous instability in the two modes is only a necessary condition for beat behavior, and second, the tracks that actual Cepheids follow may indeed not penetrate everywhere into this region. In these calculations we have made use of a - relation derived from Girardi et al. (2000) shown in Table. 1 (we will return to a discussion of - relations in §3.4).
In Figure 2 we superpose the tracks of Girardi et al. (2000) for Z=0.004, 0.008 and 0.019, respectively. Among the many tracks in the literature we have chosen these because they cover the whole mass range and range of interest to us. Furthermore we have found that the pulsational properties of the Cepheid models along these evolutionary tracks, as calculated with our pulsational code, are in good agreement with the resonance constraints imposed by the OGLE-2 data of the Small and Large Magellanic Clouds (Buchler, Kolláth & Beaulieu, 2004).
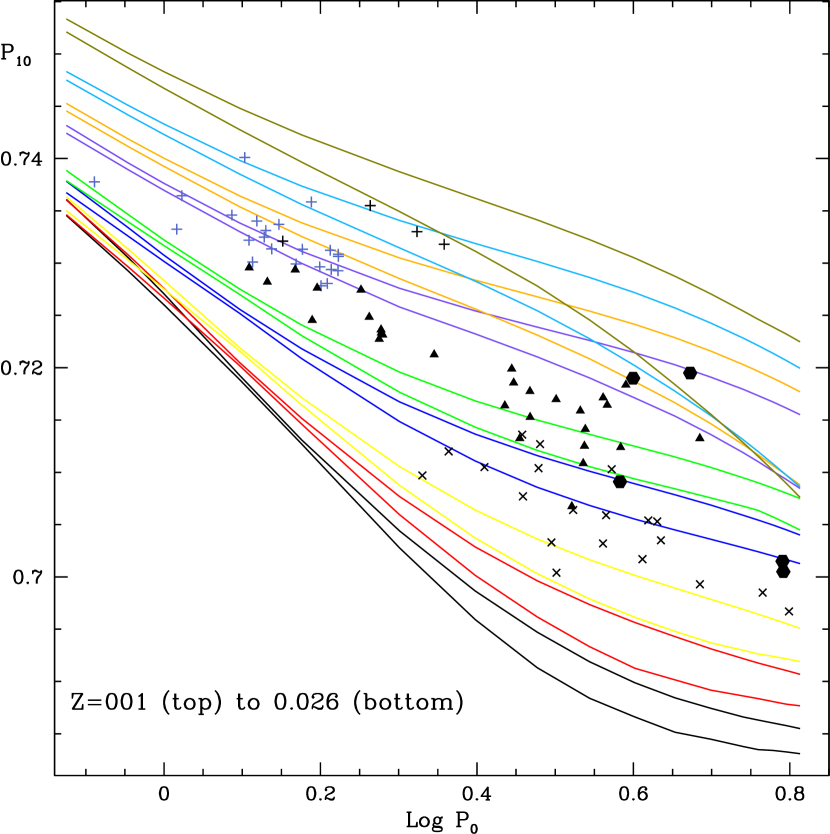
The key results of our survey are displayed as a PD in Fig. 3. The pairs of lines delineate for each the range of values for which the F and O1 modes are simultaneously linearly unstable. The metallicity is increasing downward for selected values of = 0.001, 0.002, 0.003, 0.004, 0.008, 0.010, 0.016, 0.020, 0.026. The lines become crowded for the higher indicative a spacing that is closer to Log than to .
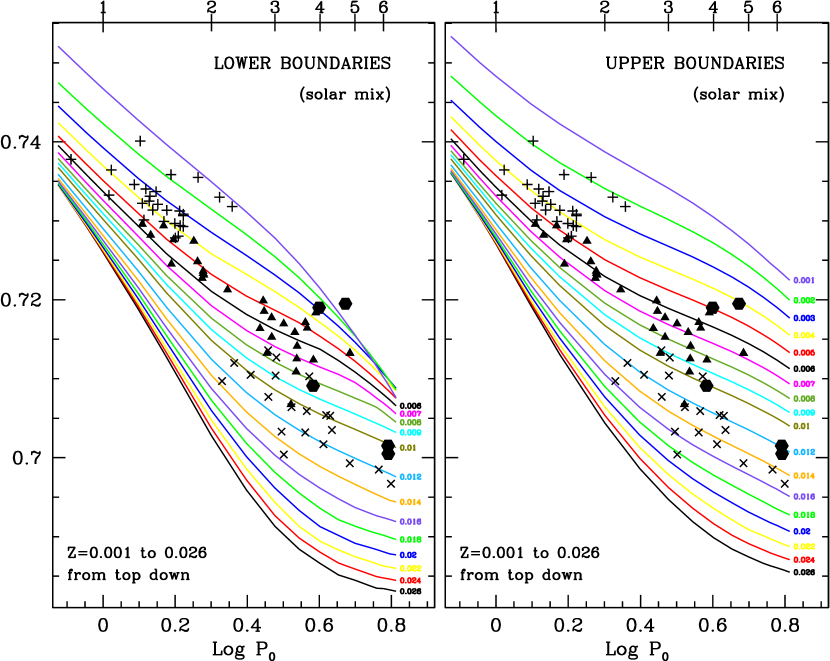
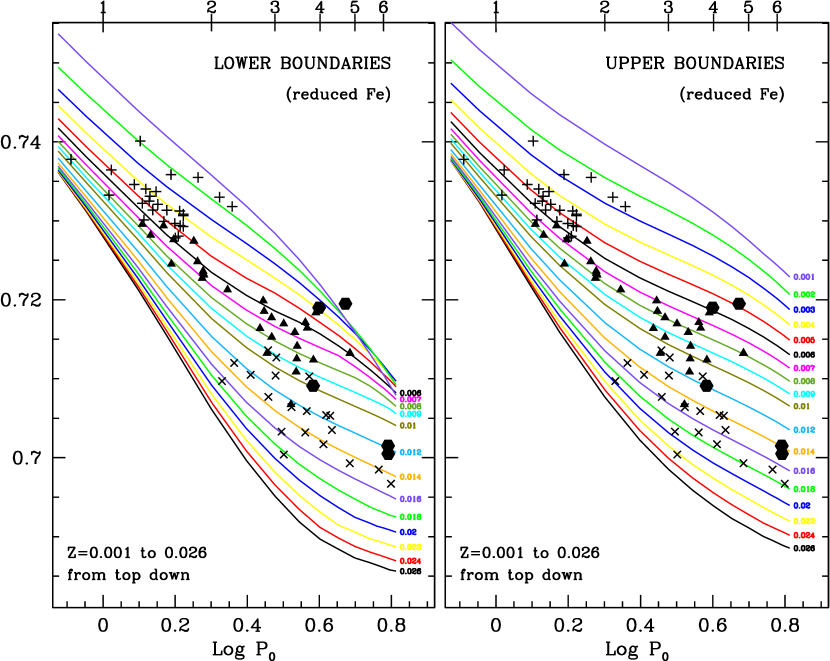
Because of overcrowdedness we could only display very few values of in Fig. 3 which we have therefore split into 2 subfigures Fig. 4, showing respectively the lower and upper limits of for a finer set of values. The are increasing downward from =0.001 to 0.010 insteps of 0.001, and then from = 0.010 to 0.026 in steps of 0.002.
For reference we have superposed the location of known BCs in the Galaxy (x’s), in M33 (Beaulieu et al. , 2006) (hexagons), in the LMC (triangles) (Alcock et al. , 1995; Soszyński et al. , 2000) and in the SMC (crosses) (Beaulieu et al. , 1997; Udalski et al. , 1999).
Fig. 3 and, more conveniently, Fig. 4 can now be used to infer upper and lower bounds on the metallicity of a given BC star from its coordinates, (, ). We identify the range(s) into which a star falls which gives a and . If it falls between the calculated ranges, as happens for short periods, we get a and from the adjacent ranges. One can refine and by interpolation in the table from which the figures are constructed.
Consider, for example, the M33 BC (hexagon) with the lowest . The left panel of Fig. 4 shows that the star falls between the =0.010 and 0.011 lines, and from the right we find 0.0120.013. An interpolation gives 0.0106 0.0124 with an average of =0.0115.
The ’Beat Cepheid metallicities’ that we infer for the Galactic BCs, =0.0074 – 0.0182, with an average of =0.0118 are on the low side, but for the MC and the M33 BCs they fall in the generally accepted ballpark, 0.001 – 0.007 with average = 0.0037 for the SMC, 0.0035 – 0.012, with average = 0.0062 for LMC, and 0.0075 – 0.0124, with average = 0.0075 for M33. We will return to a discussion of a possible remedy for this discrepancy.
In the upper left corner of Fig. 3 , the ranges for the plotted values do not overlap, meaning that the position in the PD very narrowly determines the allowed for a given and . In the upper right, in contrast, there is more overlap and the allowed range of is a little broader, albeit still in the range for . In general toward the bottom there is less overlap as well.
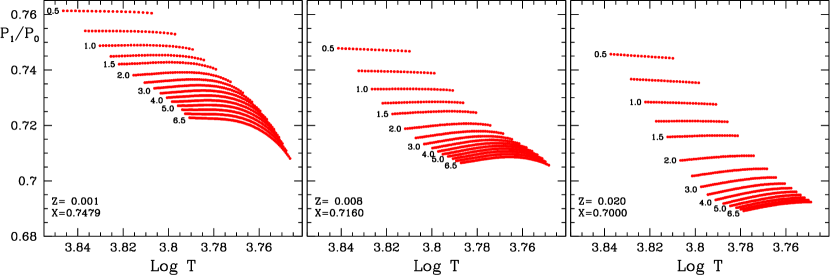
Fig. 4 provides us with no information about how the temperature or mass vary between the upper and lower loci at fixed . In Fig. 5 we display the behavior of the period ratio as a function of , each sequence at fixed period . We see that for high (on the right) the upper boundary, i.e. the maximum , of the doubly unstable models is at a higher for the short periods, but the reverse is true for the longer periods. For the low (left) the behavior of with is not even monotone. Referring back to Fig. 3 it is therefore apparent that the behavior of between the boundaries of the doubly unstable models (vertically, at fixed ) can be increasing, decreasing or even be nonmonotone. Fig. 6 indicates that similar nonmonotone behavior occurs for as a function of mass.
In the following we examine what physical factors can influence the PD, and we will examine in turn the effects of the helium mass fraction of the - relation, and of stellar rotation.
3.3. Effect of the Helium Content
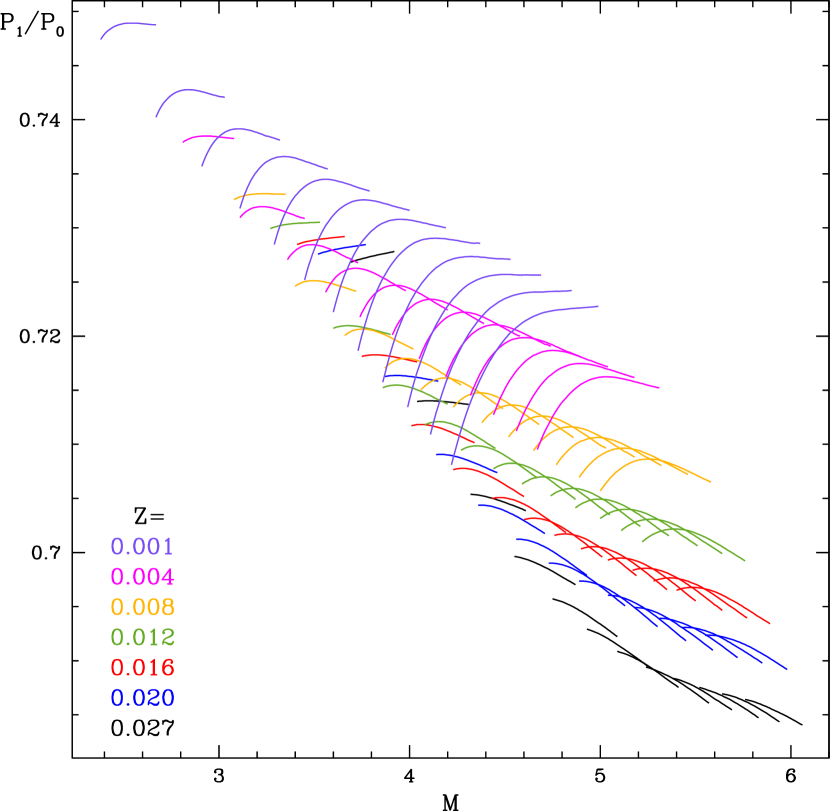
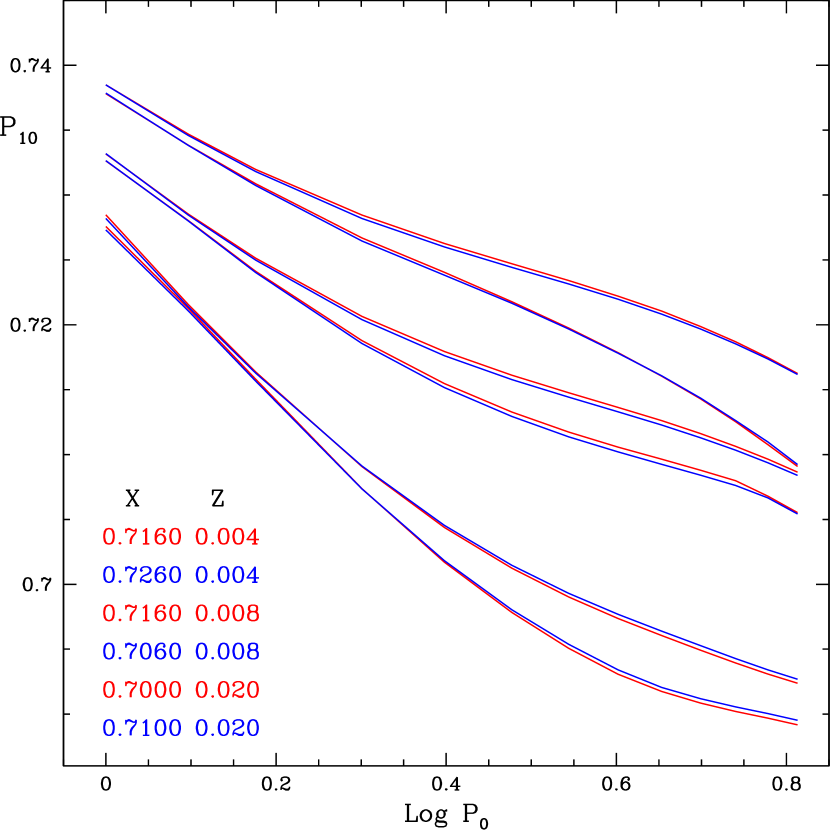
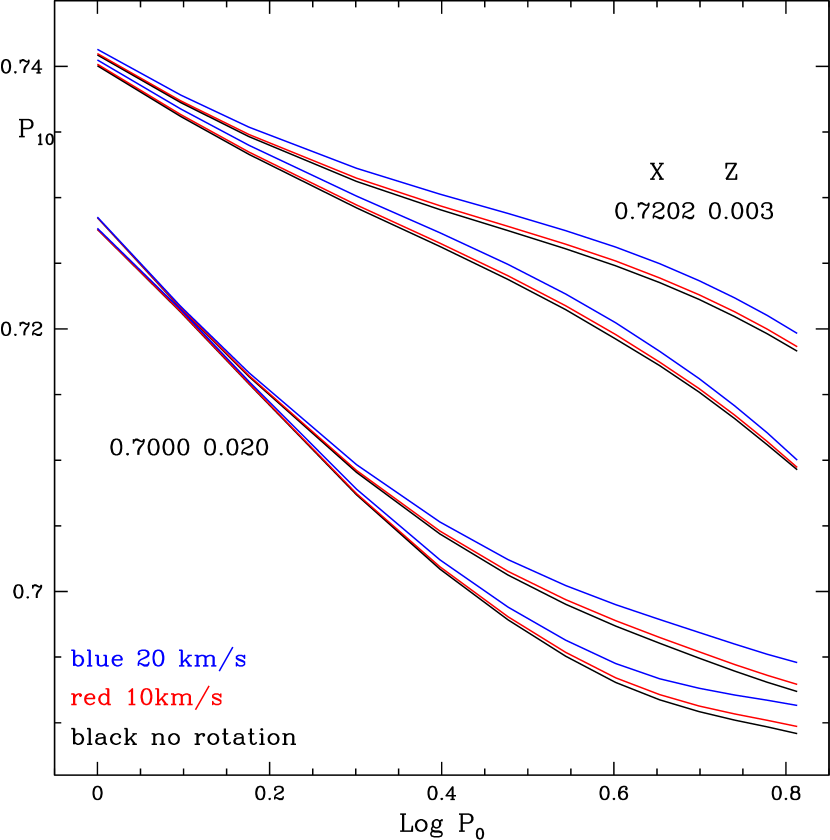
Because we have chosen the helium content relation in a somewhat cavalier way, we want to explore the sensitivity of the ranges of BC models in the PD to . In Fig. 7 we show the ranges for 3 selected values of = 0.004, 0.008 and 0.20. The figure also displays the associated and values. It is very clear from this figure that the sensitivity to even large changes of is minimal. The period ratios are essentially only sensitive to (because opacity mostly is mostly sensitive to ).
3.4. Effects of the - relation
It is well known that a Cepheid star of given mass may cross the IS three times, as seen e.g., in Fig. 2 for the Girardi et al. (2000) tracks. The first crossing occurs very fast, and, statistically, very few stars would be caught in that state of evolution. Most Cepheids are expected to be found on the slow leftward (blueward) loop, and some on the faster rightward return.
Clearly the tracks of Fig. 2 show some serious and well known deficiencies as far as observation is concerned (which are shared by all other published evolutionary tracks): the blueward ’Cepheid’ loops peter out as is increased, and by the time one reaches Galactic values of , there are no more loops at all that penetrate the BC Cepheid region, in strong discordance with observation. While some decrease of the lengths of the horizontal loops with is acceptable because there is a lower observed cutoff in the Cepheid periods, it is patently excessive. A good discussion of the problems associated with the horizontal Cepheid loops can be found in Cordier (2000) and Cordier et al. (2002).
Aside from these problems, the very use of an - relation is an approximation, first, because we limit ourselves to the second crossing, and second, because even then the stellar tracks are not horizontal in the HR diagram (- plane). In addition, referring back to Fig. 2 one realizes that extracting an - relation from the evolutionary tracks requires some guesswork as to where some of the aborted horizontal loops really should be. Another problem is that in essentially all the evolutionary calculations the horizontal loops exhibit a nonmonotone behavior with , some of which may be of numerical origin. There is also broad evidence from the LMC and SMC Cepheids that the computed evolutionary tracks may be underluminous for a given mass to account for their pulsational properties (e.g., Beaulieu, Buchler & Kolláth (2001)), and a smilar conclusion was reached for the bump Cepheids by (Keller & Wood, 2002; Bono et al. , 2002). However, it is not our purpose here to present a critical review of the various evolutionary calculations and the - relations one can derive from them, especially, as it will turn out that our application to BCs fortunately has only a moderate sensitivity to the - relation. This was already noted in Beaulieu et al. (2006) and in Fig. 1 above.
With these caveats, using the blue tips of the Girardi et al. (2000) tracks we have made fits to Log that are bi-quadratic in Log M and Log in the range and . They have the largest uncertainty for large in general, and for small (because of the lack of horizontal loops in the evolutionary tracks). Table 1 presents the - relations that we have extracted from Girardi et al. (2000) and from Pietrinferni et al. (2006). Both these evolutionary calculations give a full grid of M values and Z values in the range that we are interested in, and they use a nonzero overshooting parameter. Alibert et al. (1999) give an - only for some values of and we have therefore not used them here. Cordier et al. (2002) find that the evolutionary calculations without overshooting does not give good agreement with observational constraints. In addition, we find that for Cepheids with periods as low as 15 d with Bono’s - relation one would need to go to very high masses of 8.5 – 9 as opposed to 7.0 – 7.5 for the other - relations. However, just for comparison we also consider the - of Bono et al. (2000) derived from tracks without any overshooting. - fitting formulae are presented in their paper.
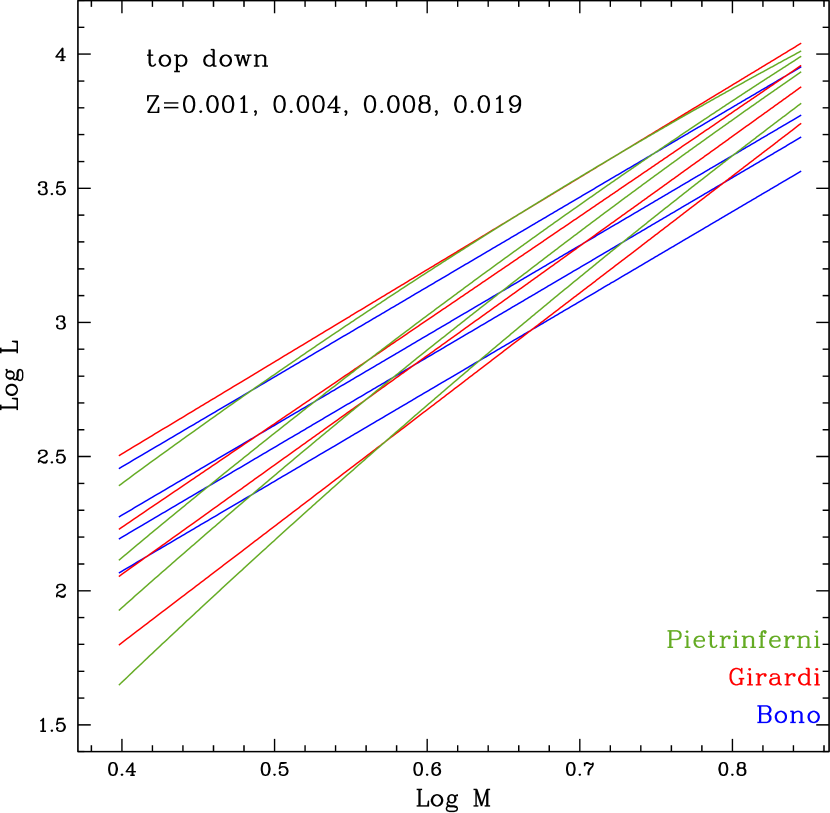
Fig. 8 displays the - relations of Girardi et al. (2000); Pietrinferni et al. (2006); Bono et al. (2000) for = 0.001, 0.004, 0.008 and 0.019. One sees that Bono is much flatter than the other two.
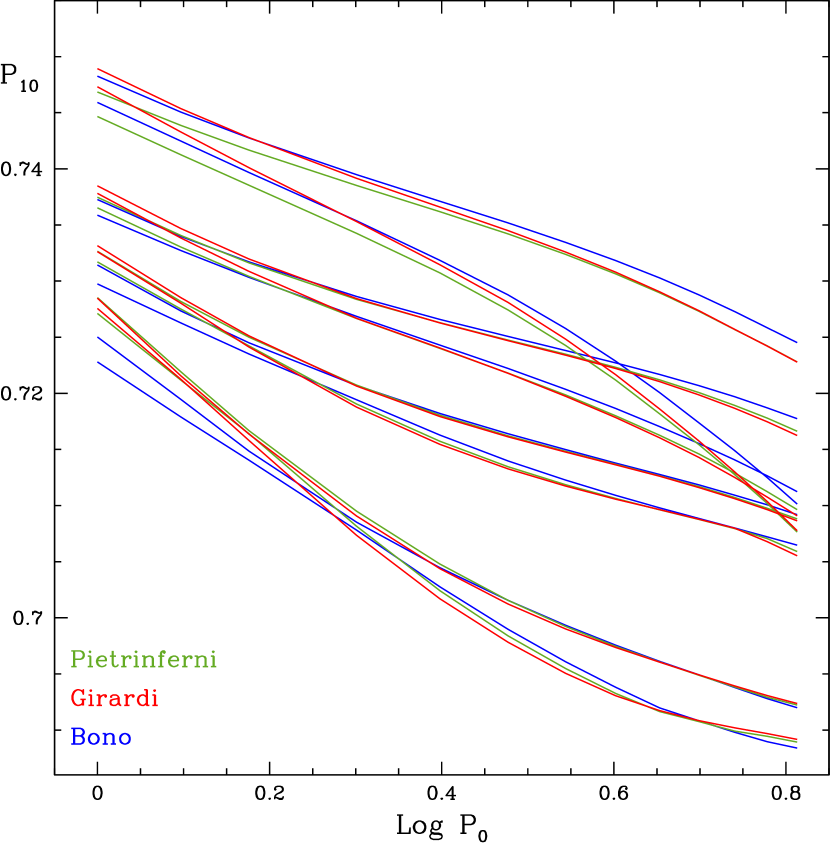
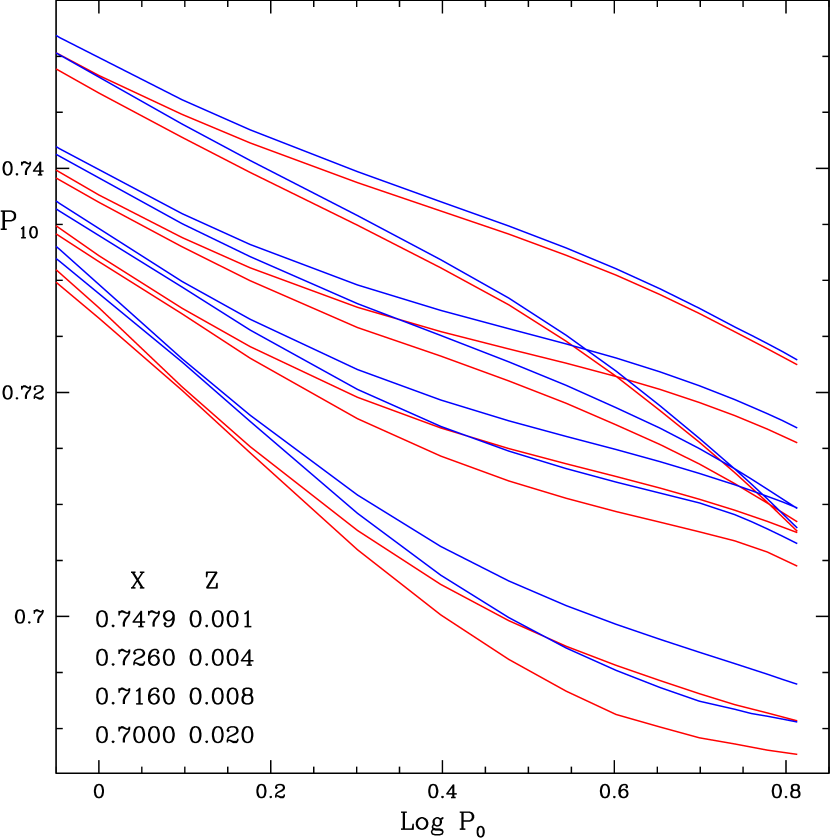
The period ratios obtained with the three - relations are compared Fig. 9. The metallicities range from =0.001 (top), 0.004, 0.008 to 0.020 (bottom). Despite the large difference in the 3 - relations, one finds, perhaps unexpectedly, that the PDs for the 3 relations agree quite well for periods down to = 1.5 d for all . The discrepancies between the - relations show up for short periods only, and especially for Bono.
Gir –3.2822 8.0864 –1.7988 –1.2764 –0.1771 0.9588 Piet –2.0937 5.5361 –1.5061 0.0306 –0.1421 0.7112
3.5. Effects of Rotation
The effect of rotation on PDs has been considered in the past, generally with the help of the crude, but reasonable simplifying assumption of a ’spherical centrifugal force’, (Stothers, R. (1974); Kovács & Buchler (1990)) that is added in the model builder and in the linear stability analysis. Note that this subterfuge is likely to exaggerate the effect of rotation.
The results of our calculations with pseudo-rotation are displayed in Fig. 10 for surface rotation velocities of = 0, 10 km/s and 20 km/s. The PD indicates only small shifts even with rotations as high as 20 km/s. A comparison with Fig. 3 shows that for the low models, with their high values, the neglect of rotation amounts up to 20 km/s generally leads to an error in of less than 0.001, but up to 0.002 for the longer periods and smaller (larger ).
Recently a flag has been raised by Suarez, Garido & Goupil (2006) who found that the PDs of delta Scuti models exhibit a large sensitivity to the assumed rotation rate, and that even a modest rotation rate can cause an increase in the period ratio which would then be misinterpreted as a lower metallicity than the star has. In contrast, we have seen that for Cepheid models rotation has only a small effect on PDs, all the more so that the observed Cepheid rotation rates ( sin ) are typically less than 20 km/s (Nardetto et al. , 2006) and thus much smaller than those of delta Scuti stars.
We conclude that neither the helium mass fraction , nor the stellar rotation, nor the - relation can appreciably affect the PD. Remaining uncertainties are associated with the relative elemental concentrations of the ’metals’ in .
3.6. Effect of Elemental Mixture that is Lumped into
So far we have used the OPAL (Iglesias & Rogers, 1996) opacities with the standard solar elemental mixture of Grevesse & Noels (1993). One needs to ask the question of whether the PDs are sensitive to as a whole, or to the relative fraction of the heavier metals, i.e. the Fe group elements, which provide the bulk of the opacity. We therefore have made several tests.
In Figs. 11 and 12 we display PDs obtained with OPAL opacities in which the number densities of the dominant heavy elements (Fe, Ca, Ar, S, Si and Mg) are arbitrarily lowered by factors of 0.75 (before renormalization to unity) in a ’Type 1 OPAL Table’ with fixed , and . This can be compared to the PD of Fig. 3 which was for a solar mix (GN93 in OPAL). One notes that, in first approximation, the lines are just shifted, but there is also a deformation. For example, the old =0.022 line in Fig. 3 is now the =0.026 line in Fig. 12, and the =0.005 is close to the 0.006 line.
As far as the Galactic BCs are concerned we find a range of = 0.0089 – 0.0221, with an average of = 0.0141, better than the average of 0.0118 that we find with a solar mix, but still a little low compared to the generally quoted values. For the SMC we have = 0.0015 – 0.0100 with average = 0.0047, for the LMC 0.0047 – 0.0148, average = 0.0076, and for M33 0.0013 – 0.0146, average = 0.009.
We are led to conclude that there is a discrepancy between the stellar models that use opacities with the GN95 solar mix and the metallicities that are quoted in the literature. Better agreement can be achieved with a reduction in the relative number densities of the Fe group elements.
We have also examined other changes. The Grevesse G91 mix (in OPAL) has a reduction of about 10% in the heavier elements. Not astonishingly, the results fall in between those of the 25% reduction and GN95. Similarly, increasing the heavy elements (Fe, Ca, Ar, S, Si and Mg) by a factor of 1.1 produces a comparable change, but in the opposite direction, as expected. The alpha-enhanced opacities, labeled Charboyer in the OPAL opacity library, which have a chemical makeup that is quite different from solar produce large changes in the PD. Space does not permit us to look with more detail into the effects of the chemical makeup in order to see if we can isolate what effects the various subgroups of elements in the mix have on the PDs. This will be done in a subsequent paper.
We conclude that the chemical makeup does play a non-negligible role, mostly for the short periods. Decreasing the relative Fe content at fixed is seen to be equivalent to decreasing at fixed elemental mixture in first approximation. This confirms what one may have expected, namely that the PD are predominantly sensitive to the strength of the opacity which is provided by the Fe group elements.
4. Conclusions
With the help of our convective pulsation code we have constructed Petersen diagrams ( vs. Log ) for Beat Cepheids. In these PDs we have delineated the region of simultaneous linear instability in the F and the O1 modes for a range of relevant values of metallicity . Our results are presented in Fig. 4 such a way that from the measured period and period ratio one can determine upper and lower limits on the metallicity of the corresponding Beat Cepheid.
The results are found to be rather insensitive (1) to the assumed helium content , (2) to the exact form of the mass-luminosity relation, and (3) to the presence of stellar rotation. By comparing PDs with solar abundances to those in which the heavier elements (in particular Fe) are reduced or increased relative to the lighter elements we conclude that the PDs are sensitive to the chemical makeup of .
Interestingly, we find that with a reduction in the number densities of heavier elements at fixed the ’pulsation metallicities’ for the Galactic Beat Cepheids are in better agreement with the values that are in the literature than with the solar elemental mix of Grevesse-Noels (1993). We plan to examine the effect of the relative abundances in greater detail in a companion paper, especially in light of recent suggested revisions of the abundances (Asplund, Grevesse & Sauval, 2005).
References
- Asplund, Grevesse & Sauval (2005) Asplund, M., Grevesse, N. & Sauval, A.J. 2005, in Cosmic Abundances as Recods of Stellar Evolution and Nucleosynthesis, ASP Conf. Ser. 336, 25.
- Abbott et al. (2004) Abbott, J. B., Crowther, P. A. & Drissen, L. 2004, MNRAS, 350, 552.
- Alcock et al. (1995) Alcock, C., et al. 1995, AJ, 109, 1653.
- Alexander & Ferguson (1994) Alexander, D. R. & Ferguson, J. W. 1994, ApJ, 437, 879.
- Alibert et al. (1999) Alibert, Y., Baraffe, I., Hauschildt, P. & Allard, F. 1999, A&A, 344, 551.
- Andrievsky et al. (1994) Andrievsky, S.M., Kovtyukh, V.V., Usenko, I.A., Klochkova, V.G. & Galazutdinov, G.A., 1994, A&ASuppl., 108, 433.
- Antonello & Aikawa (1998) Antonello, E. & Aikawa, T. 1998, A&A, 337, 145.
- Beaulieu et al. (1997) Beaulieu, J. P., et al. 1997, A&A, 321, L5.
- Beaulieu, Buchler & Kolláth (2001) Beaulieu, J.P. Buchler, J.R. & Kolláth, Z. 2001, A&A, 373, 164.
- Beaulieu et al. (2006) Beaulieu, J.P., Buchler, J.R., Marquette, J.B. Hartman, J.D. & Schwarzenberg-Czerny, A., 2006, ApJ, 653, L101.
- Bono et al. (2000) Bono G., Caputo, F., Cassisi S., Marconi M., Piersanti L. & Tornambè A. 2000, ApJ, 543, 955.
- Bono et al. (2002) Bono G., Castellani, V. & Marconi, M. 2002, ApJ, 565, L83.
- Buchler, Kolláth & Beaulieu (2004) Buchler, J.R., Kolláth, Z. & Beaulieu, J.P. 2004, A&A, 423, 643.
- Caputo et al. (2001) Caputo, F., Marconi, M., Musella, L. & Pont, F. 2001, A&A, 372, 544.
- Christensen-Dalsgaard & Petersen (1995) Christensen-Dalsgaard, J. & Petersen, J.O. 1995, A&A, 299, L17.
- Cordier (2000) Cordier, D. 2000, Thèse de Doctorat, Université de Rennes, France, http://astro.ensc-rennes.fr/
- Cordier et al. (2002) Cordier, D., Lebreton, Y., Goupil, M.J., Lejeune, T. & Beaulieu, J.P. 2002, A&A392, 169.
- Crockett et al. (2006) Crockett, N.R., Garnett, D.R., Massey, P. & Jacoby, G. 1997, ApJ, 489, 63.
- Garnett et al. (1997) Garnett, D.R., Shields, G.A., Skillman, E.D., Sagan, S.P. & Dufour, R.J. 1997, ApJ, 489, 63.
- Girardi et al. (2000) Girardi, L., Bressan, A., Bertelli, G. & Chiosi, C. 2000, A&AS, 141, 371.
- Grevesse & Noels (1993) Grevesse, N. & Noels, A., 1993, in Origin and evolution of the elements Eds. N. Prantzos, E. Vangioni-Flam and M. Casse, Cambridge University Press, Cambridge, England, p.14.
- Iglesias & Rogers (1996) Iglesias, C. A. & Rogers, F.J. 1996, ApJ, 464, 943, www-pat.llnl.gov/Research/OPAL/
- Keller & Wood (2002) Keller, S.C. & Wood, P.R. 2002, ApJ, 578, 144.
- Keller & Wood (2006) Keller, S.C. & Wood, P.R. 2006, ApJ, 642, 834.
- Kolláth et al. (1998) Kolláth, Z., Beaulieu, J. P., Buchler, J. R. & Yecko, P. 1998, ApJ, 502, L5.
- Kolláth & Buchler (2001) Kolláth, Z. & Buchler, J. R. 2001, In: Stellar pulsation - nonlinear studies, Eds.: Mine Takeuti and Dimitar D. Sasselov, Astrophysics and space science library, Vol. 257, Dordrecht: Kluwer Academic Publishers, 29.
- Kolláth et al. (2002) Kolláth, Z., Buchler, J. R., Szabó, R. & Csubry, Z. 2002, A&A, 385, 932.
- Kovács (2000) Kovács, G. 2000, A&A, 360, L1.
- Kovács & Buchler (1990) Kovács, G. & Buchler, J.R. 1990, Confrontation Between Stellar Pulsation and Evolution, Ed. C. Cacciari & G. Clementini, ASP Conf. Ser. 11, p. 226.
- Magrini et al. (2004) Magrini, L., Perinotto, M., Mampaso, A. & Corradi, R.L.M. 2004, A&A, 426, 779.
- Monteverde et al. (1997) Monteverde, M.I., Herrero, A., Lennon, D.J. & Kudritzki, R.P. 1997, ApJ, 474, L107.
- Morgan & Welch (1997) Morgan, S.M. & Welch, D.L. 1997, AJ, 114, 1183.
- Moskalik, Buchler & Marom (1992) Moskalik, P., Buchler, J.R. & Marom, A. 1992, ApJ, 385, 685.
- Nardetto et al. (2006) Nardetto, N. et al. 2006, A&A, 453, 309.
- Pietrinferni et al. (2006) Pietrinferni, A., Cassisi, S., Salaris, M. & Castelli, F. 2006, ApJ, 642, 797.
- Petersen (1973) Petersen, J.O. 1973, A&A, 27, 89.
- Soszyński et al. (2000) Soszyński, I. et al. 2000, Acta Astr., 50, 451.
- Stothers, R. (1974) Stothers, R. 1974, ApJ, 192, 145.
- Suarez, Garido & Goupil (2006) Suarez, J.C., Garido, R. & Goupil, M.J. 2006, A&A, 447, 649.
- Szabó & Buchler (2007) Szabó, R. & Buchler, J.R. 2007, ApJ, (to be submitted)
- Tiede et al. (2004) Tiede, G. P., Sarajedini, A. & Barker, M. K. 2004, AJ, 128, 224.
- Udalski et al. (1999) Udalski, A. et al. 1999, Acta Astr. 49, 1.
- Urbaneja et al. (2005) Urbaneja, M. A., et al. 2005, ApJ, 635, 311.
- Vílchez et al. (1988) Vílchez, J. M., Pagel, B. E. J., Diaz, A. I., Terlevich, E. & Edmunds, M. G. 1988, MNRAS, 235, 633.
- Yecko, Kolláth & Buchler (1998) Yecko, P.A., Kolláth, Z. & Buchler, J.R., 1998, A&A, 336, 553.