Proceedings of the CRAL-Conference Series I ”Chemodynamics: from first stars to local galaxies” \Editorseds. Emsellem, Wozniak, Massacrier, Gonzalez, Devriendt, Champavert
Simulations of Cosmic Chemical Enrichment with Hypernova
Abstract
We simulate cosmic chemical enrichment with a hydrodynamical model including supernova and hypernova feedback. We find that the majority of stars in present-day massive galaxies formed in much smaller galaxies at high redshifts, despite their late assembly times. The hypernova feedback drives galactic outflows efficiently in low mass galaxies, and these winds eject heavy elements into the intergalactic medium. The ejected baryon fraction is larger for less massive galaxies, correlates well with stellar metallicity. The observed mass-metallicity relation is well reproduced as a result of the mass-dependent galactic winds. We also predict the cosmic supernova and gamma-ray burst rate histories.
1 Introduction
While the evolution of the dark matter is reasonably well understood, the evolution of the baryonic component is much less certain because of the complexity of the relevant physical processes, such as star formation and feedback. With the commonly employed, schematic star formation criteria alone, the predicted star formation rates (SFRs) are higher than what is compatible with the observed luminosity density. Thus feedback mechanisms are in general invoked to reheat gas and suppress star formation. We include both supernova and hypernova feedback in our hydrodynamical model in this paper (see Kobayashi, Springel & White 2006b, hereafter K06b, for the details).
2 Hypernovae
Supernovae eject not only thermal energy but also heavy elements into interstellar medium. Thus the star formation history is imprinted in the chemical abundances of stars and galaxies. Different types of supernovae, i.e., Type II and Ia supernovae (SNe II and Ia), produce different heavy elements with different timescales. Recently, it is found that hypernovae (HNe), which have more than ten times larger explosion energy (), produce a certain amount of iron.
Kobayashi et al. (2006a) calculated the nucleosynthesis yields for wide ranges of metallicity and energy, based on the light curve and spectra fitting of individual supernovae. With these yields, the elemental abundance ratios are in good agreement with observations from oxygen to zinc. Especially, the observed abundance of Zn ([Zn/Fe] ) can be explained only by a large contribution of HNe. We adopt these yields and energies in our hydrodynamical model.
3 Cosmological Simulations
We simulate the evolution of gas and stellar systems and the chemical enrichment from SNe II, SNe Ia, and HNe, from the cosmological initial condition with km s-1 Mpc-1, , , , , and . We use an SPH code GADGET-2 by Springel (2005), and introduce the metal-dependent cooling rates (Sutherland & Dopita 1993) and chemical enrichment scheme by Kobayashi (2004). The initial condition is calculated in a Mpc cubic box with periodic boundary conditions with . We adopt the Salpeter IMF, the star formation timescale , and the feedback neighbors .
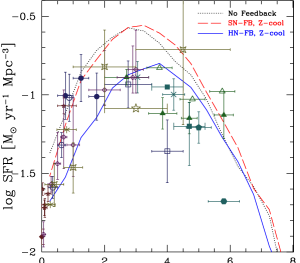
Figure 1 shows the cosmic SFRs that are directly measured from the ages of stellar particles for the low resolution simulations. Supernova feedback (dashed line) decreases the SFR from , but metal-dependent cooling increases as large as no feedback case. For comparison, Figure 1 also shows observational estimates of the cosmic SFR density at different epochs. Note that these determinations are derived from the observed luminosity densities, and this involves uncertainties from dust extinction and completeness, as well as from the IMF. If we include hypernova feedback (solid line), the SFR starts to be suppressed from onwards, and is overall smaller by a factor of at . The resulting SFR is in broad agreement with the observations that show a peak of at . Since the metallicity dependence of the cooling rate clearly appears for [Fe/H] , metal-dependent cooling does not play such a prominent role in the HN feedback case, and enriched gas can remain hot without forming stars.
Without feedback, of baryons turn into stars, which is too large compared with observational estimates. With SN feedback, the stellar fraction reduces to , which may be consistent with observation. Recently, the observational estimate has been reduced to less than (Fukugita & Peebles 2004), which may require larger feedback. The larger energy ejection by HNe could provide a solution. The present mean gas metallicity is [Fe/H] for SN feedback, and is reduced to for HN feedback. The mean stellar metallicity is almost solar for the SN feedback, and becomes sub-solar for the HN feedback.
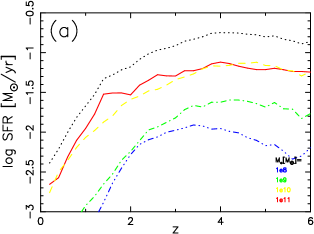
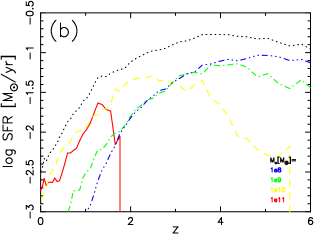
When and where do stars form? To answer this question, we break up the cosmic SFR history according to galaxy mass. In Figure 2a, the galaxies have been identified by FOF at for this plot, and thus these SFRs correspond to the age distribution of stars in the galaxies. For all galaxy masses, the SFRs show a peak around , and the majority of stars are as old as Gyr. On the other hand, in Figure 2b, we identify galaxies at each redshift, which are comparable to the observations of high redshift galaxies. This shows that most stars have formed in low-mass galaxies with at high redshift . galaxies exist at high redshift , but galaxies appear only after . From these two figures we conclude that most stars have formed in dwarf galaxies before they merge to massive galaxies in our simulation. As a result of the hierarchical clustering of dark matter halos, such old stars belong to massive galaxies at low redshifts.

How are heavy elements ejected from galaxies to the IGM? In the simulation, we can trace the orbit of gas particles over time. Exploiting this, we define as wind particles those that are not in galaxies now, but have been in galaxies before. In this simulation, of baryons turn into stars, of the gas stays in galaxies ( is hot), and is ejected as galactic winds. The rest, half of the baryons, never accretes onto galaxies.
When we follow the orbits of gas particles, we can also examine from which galaxies the wind gas particles are ejected. This allows a measurement of the ejected wind mass from each galaxy. In Figure 3a, a clear relation is found between the wind fraction and the total mass. Winds are efficiently ejected from small galaxies, with of accreted baryons being ejected from galaxies. A similar relation is also found for the ejected metal fraction, i.e. the ratio between the wind metal mass to the total metal mass. It is interesting that the wind fraction and the ejected metal fraction correlate well with the stellar metallicity (Fig.3b). Based on this finding, we conclude that the origin of the mass-metallicity relation can be explained with galactic winds.
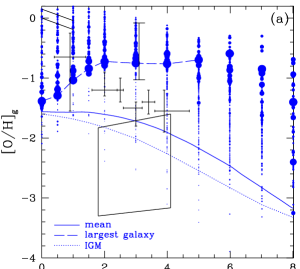
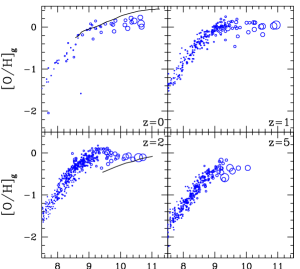
The metal enrichment timescale depends on the environment. Figure 4a shows the evolution of oxygen abundances in the gas phase. In large galaxies, enrichment takes place so quickly that [O/H] reaches at , which is consistent with the sub-solar metallicities of the Lyman break galaxies (large errorbar at , Pettini et al. 2001). The low metallicities of DLA systems (errorbars, Prochaska et al. 2003) are also consistent with our galaxies, provided these systems are dwarf galaxies or the outskirts of massive galaxies. The low [C/H] of the IGM (box, Schaye et al. 2003) can be explained if the IGM is enriched only by SNe II and HNe. The average metallicity of the universe reaches [O/H] and [Fe/H] at , but reaches the same values at in the IGM.
In galaxies, metallicity of the cold gas increases with galaxy mass (Fig.4b), which is comparable to observations with a large scatter (solid line at , Tremonti et al. 2004; , Erb et al. 2006). The central cold gas shows a relation between galaxy mass and metallicity with shallower slope than observed in emission-line galaxies. For the stellar population, the observed mass-metallicity relation is well reproduced (Kobayashi & Arimoto 1999; Pahre et al. 1998; Gallazzi et al. 2005), and originates in mass-dependent galactic winds. These relations are present since .
4 Cosmic Supernova Rates
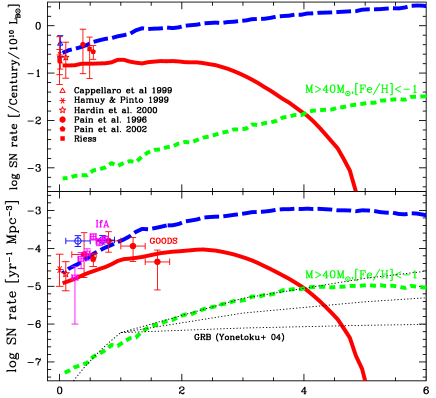
We provide the cosmic supernova rates that is calculated with the cosmological chemodynamical simulations in Figure 5. Recently, large scale and deep surveys can give the SNe Ia rates as a function of redshift ([Dahlen et al. 2004], [Barris & Tonry 2005]). From the evolution of SN Ia rates, the delay time of SNe Ia have been constrained as a few Gyr ([Mannucci et al. 2006]). However, the theory of the SN Ia progenitor (i.e., a binary system of a white dwarf) is not simple and the evolution of the binary system should be taken into account. The delay time corresponds to the lifetime of the binary companion, and the shortest time of SNe Ia is much shorter as Gyr for the double-degenerate system ([Tutukov & Yungelson 1994]), Gyr for [Matteucci & Recchi(2001)]’s model, and Gyr for our single-degenerate system ([Kobayashi et al. 1998]).
In addition, because the occurrence of SNe Ia depends on the metallicity in our SN Ia progenitor scenario, the SNe Ia rate depends on the environments, i.e., the star formation and chemical enrichment histories of host galaxies. Therefore, not with one zone model of the Universe but with the chemodynamical simulations, we should predict the cosmic supernova rates. In our simulations, the effects of hypernovae are included, and we can also provide the cosmic gamma-ray burst (GRB) rates assuming that the progenitors of GRB are massive () and low-metal ([Fe/H] ) hypernovae. Our predictions are in good agreement with observations.
References
- [Barris & Tonry 2005] Barris, B. J. & Tonry, J. L. 2006, ApJ, 637, 427
- [Dahlen et al. 2004] Dahlen, T. et al. 2004, ApJ, 613, 189
- [Kobayashi(2004)] Kobayashi, C., 2004, MNRAS, 347, 740
- [Kobayashi et al.(2006)] Kobayashi, C., Springel, V, & White, S. D. M. 2006, MNRAS, submitted, astro-ph/0604107 (K06b)
- [Kobayashi et al. 1998] Kobayashi, C., Tsujimoto, T., Nomoto, K., Hachisu, I, & Kato, M. 1998, ApJ, 503, L155
- [Kobayashi et al.(2006)] Kobayashi, C., Umeda, H., Nomoto, K., Tominaga, N., & Ohkubo, T. 2006, ApJ, in press, astro-ph/0608688 (K06a)
- [Mannucci et al. 2006] Mannucci, F., Della Valle, M., & Panagia, N. 2006, MNRAS, 370, 773
- [Matteucci & Recchi(2001)] Matteucci, F. & Recchi, S. 2001, ApJ, 558, 351
- [Springel(2005)] Springel, V. 2005, MNRAS, 364, 1105
- [Sutherland & Dopita(1993)] Sutherland, R. S., & Dopita, M. A. 1993, ApJS, 88, 235
- [Tutukov & Yungelson 1994] Tutukov, A. V., & Yungelson, L. R. 1994, MNRAS, 268, 871