∎
Nizhniy Arkhyz, Karachaevo-Cherkessia, Russia, 369167
22email: beskin@sao.ru
Search for fast optical activity of SGR 1806-20 at the SAO RAS 6-m telescope††thanks: This work has been supported by the Russian Foundation for Basic Research (grant No 04-02-17555), Russian Academy of Sciences (program ”Evolution of Stars and Galaxies”), and by the Russian Science Support Foundation. Also the authors are thankful to the anonymous referee for his/her valuable comments.
Abstract
The region of SGR 1806-20 localization was observed during its gamma-ray activity in 2001. The observations have been performed on the 6-meter telescope of the Special Astrophysical Observatory, using the Panoramic Photometer-Polarimeter (PPP). The search for variability was performed on the - s time scale, and its results were compared to the properties of corresponding x-ray flares.
Keywords:
methods: data analysis objects: SGR 1806-20pacs:
95.75.-z 95.75.Wx 95.85.Kr 97.60.Jd1 Introduction
There is now increasing evidence that the soft repeater SGR 1806-20 hosts a magnetar, i.e. a neutron star with an anomalously high magnetic field Gs (Duncan & Thompson, 1992; Woods & Thompson, 2004). The SGR 1806-20 is the most active among soft gamma repeaters and is characterized by the emission of short sporadic flashes of soft gamma rays with characteristic durations of 10 ms - 1 s and luminosities of - erg/s. (Gogus et al., 2001; Hurley, 2000). They are detected during sporadic periods of the object’s activity lasting from days to months. Pulsations of the persistent X-ray flux of SGR 1806-20 with a period of 7.47 s were discovered (Kouveliotou, 1998). The culmination of the long period of its activity that started in the end of 2003 was a giant flare of 27th December 2004 (Borkowski et al, 2004; Mazets et al., 2004; Golenetskii et al., 2004). During the main spike that lasted 0.2-0.5 s, about ergs above 50 Kev was emitted for a distance of 15 kpc (Palmer et al., 2004; Mereghetti et al., 2005; Schwartz et al., 2005; Terasawa et al., 2005). The long part of the flare showed a pulsation with the period of 7.57 s during about 300 s (Borkowski et al, 2004).
Unfortunately, even the minimal estimation of the distance to SGR 1806-20 is 6 kpc (while the most reasonable one is 15 kpc), and the absorption reaches (Eikenberry et al., 2004; McClure-Griffiths & Gaensler, 2005), so there is not much hope of detecting its optical emission, even though its infrared counterpart seems to have been found, with a magnitude of (Israel et al., 2005).
However, we have carried out a set of observations of the location of SGR 1806-20 in the optical band with 1 s temporal resolution to try to detect very short and strong optical spikes. The epoch of the observations has been chosen in relation to the increase of -ray activity of the source, according to HETE data (Ricker et al., 2001a, b).
2 Observations, hardware and software
The field of SRG 1806-20 has been observed using the 6-meter telescope of the Special Astrophysical Observatory. Observations were carried out with Panoramic Photometer-Polarimeter (PPP) with high time resolution (Plokhotnichenko et al., 2003) in the telescope prime focus on June 20 2001 (2 days after HETE trigger), and on August 22 2001 (15 hours after HETE trigger) (Ricker et al., 2001a, b).
The main part of PPP is the Positional Sensitive Detector (PSD), which consists of a vacuum tube with a standard S20 photocathode, a set of microchannel plates and a four-electrode anode. The pixel size of the detector is , the FOV is a circle of about , and the time resolution (dead time) is 1 s (Debur et al., 2003).
For the determination of the photon arrival times and coordinates, and for the storage of the whole data set, a special “time-code” converter “Quantochron 4-48” connected to the PC in realtime has been used. The information on the observations is summarized in Table 1.
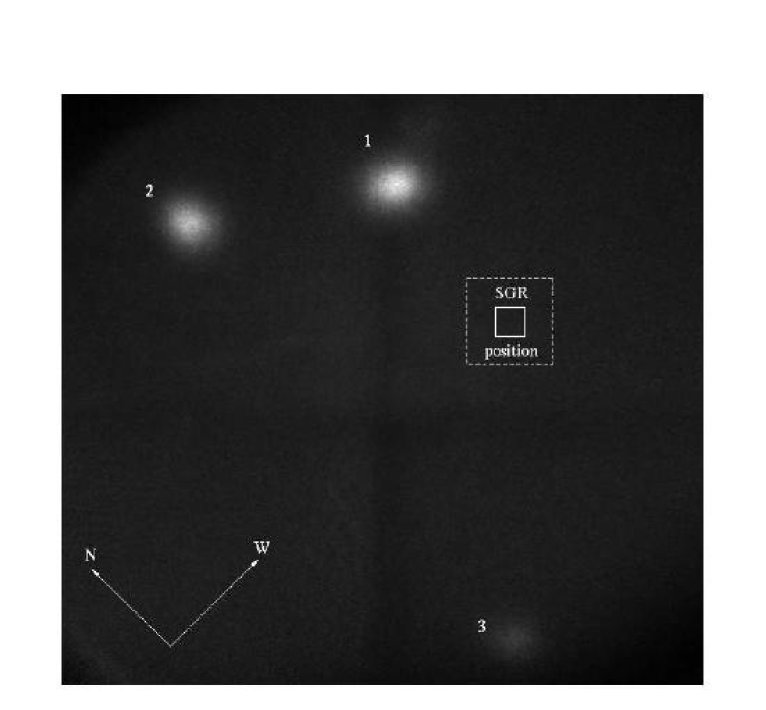
The search for variability has been performed in the region centered on the IPN localization of the source (Hurley et al., 1999). The statistical properties of the photon lists have been studied separately for 9 square boxes with the size of covering the localization region (see Fig.1).
As an indicator of the variability we used the function , defined as the ratio between the distributions of the photon arrival time intervals for the source and background (Schvartsman, 1977). It is:
| (1) |
where is the interval between the times of arrival of successive photons, while and are the distribution functions of for the source and background boxes, respectively.
We used the following definitions and relations: - intensity variation during the flare and its mean value:
| (2) |
where is the mean interval between the arrival times of successive photons, - mean time between the flares and - persistent emission intensity; - maximum intensity of the flare; characteristic time scale of the variability:
| (3) |
relative amplitude of the intensity variations , and relative power of the variable emission component
| (4) |
where - the flares duty cycle.
The function is related to the variability parameters defined above (Schvartsman, 1977) as
| (5) |
where - flare shape cofficient. For example, sinusoidal flares have , triangular ones have .
3 Results of observations
Using the arrival times of photons, detected in each sub-box of the SGR 1806-20 localization, the distribution function of intervals between the following photons has been built. The mean background intensity has been counts/s with nearly Poissonian statistics.
Fig.2 shows the upper limits for the relative power of the variable emission component derived using equations (1) - (7). The model of triangular flares with the duty cycle of was used.
We used the information on flares detected in gamma and X-ray bands (see, for example, Woods & Thompson (2004) and Götz et al. (2006)).
For the photometric calibration, the stars listed in Table 2 have been used.
| Date | Start Time | Exposure | Zenith | Filter |
|---|---|---|---|---|
| (UT) | Time (s) | Distance | ||
| 20.06.2001 | 4544.6 | B | ||
| 22.08.2001 | 800.33 | B |
| N | R.A. | DEC. | Bmag | Rmag |
|---|---|---|---|---|
| J2000* | J2000 | |||
| 1 | 14.6 | 13.7 | ||
| 2 | 15.5 | 14.6 | ||
| 3 | 16.5 | 15.9 |
*Monet D.G., 1998, BAAS 30, Vol.4, 120.03

So, the upper limits for flashes with the duration of s (similar to the parameters of -ray flashes) will be about . For very rare flashes with the duty cycle of , the upper limits will be thirty times better - we should be able to detect events of .
Unfortunately, even having good upper limits for the variable optical component, due to huge absorption it is impossible to derive a reasonable estimate of the luminosity. Assuming and a distance of 6 to 15 kpc (Eikenberry et al., 2004; McClure-Griffiths & Gaensler, 2005), we have for the upper limits of flaring optical luminosity of SGR 1806-20 values ranging from erg/s to erg/s. These values are similar to the peak luminosity of the object in the -ray band, i.e. to the values registered during the giant flare. This means that very short and very rare “giant optical flares” could be detected.
References
- Beskin et al. (2001) Beskin G., Debur V., Panferov A. et al. GCN 1129 (2001)
- Beskin et al. (2003) Beskin G., Debur V., Panferov A. et al. AIPS Conf.Proc., 662, 583 (2003)
- Borkowski et al (2004) Borkowski J., Götz D., Mereghetti S. et al. GCN 2920 (2004)
- Debur et al. (2003) Debur V., Arkhipova T., Beskin G. et al. Nuclear Instruments and Methods in Physics Research, A 513, 127 (2003)
- Duncan & Thompson (1992) Duncan R.C. & Thompson C. ApJ, 392, L9 (1992)
- Eikenberry et al. (2004) Eikenberry S. S., Matthews K., LaVine J. L. et al. ApJ, 616, 506 (2004)
- Gogus et al. (2001) Gogus E., Kouveliotou C., Woods P. M. et al. ApJ 558 228 (2001)
- Golenetskii et al. (2004) Golenetskii S., Aptekar R., Mazets E. et al. GCN 2923 (2004)
- Götz et al. (2006) Götz D., Mereghetti S., Molkov S. et al. A&A, 445, 313 (2006)
- Hurley et al. (1999) Hurley K., Kouveliotou C., Cline T. et al. ApJ, 523, L37 (1999)
- Hurley (2000) Hurley K., in AIP Proc., 5th Huntsville Symp. on Gamma-Ray Bursts (2000)
- Israel et al. (2005) Israel G. L., Covino S., Mereghetti S. et al The Astronomerś Telegram, 378 (2005)
- Kouveliotou (1998) Kouveliotou C., Dieters S., Strohmayer T. et al. Nature, 393, 295 (1998)
- Mazets et al. (2004) Mazets E., Golenetskii S., Aptekar R. et al. GCN 2922 (2004)
- McClure-Griffiths & Gaensler (2005) McClure-Griffiths N. M. & Gaensler B. M. ApJ, 630, L161 (2005)
- Mereghetti et al. (2005) Mereghetti S., Götz D., von Kienlin A. et al. ApJ, 624, L105 (2005)
- Palmer et al. (2004) Palmer D. M., Barthelmy S., Gehrels N. et al. Nature, 434, 1107 (2005)
- Plokhotnichenko (1983) Plokhotnichenko V.: Communications of the Special Astrophysical Observatory, 38, 29 (1983)
- Plokhotnichenko (1992) Plokhotnichenko V. PhD thesis (1992)
- Plokhotnichenko et al. (2003) Plokhotnichenko V., Beskin G., Debur V. et al. Nuclear Instruments and Methods in Physics Research, A 513, 167 (2003)
- Ricker et al. (2001a) Ricker D., Lamb D., Woosley S. et al. GCN 1068 (2001)
- Ricker et al. (2001b) Ricker G., Lamb D., Woosley S. et al. GCN 1089 (2001)
- Schvartsman (1977) Shvartsman V.: Communications of the Special Astrophysical Observatory, 19, 5 (1977)
- Schwartz et al. (2005) Schwartz S. J., Zane S., Wilson R. J. et al. ApJ, 627, L129 (2005)
- Terasawa et al. (2005) Terasawa T., Tanaka Y. T., Takei Y. et al Nature, 434, 1110 (2005)
- Woods & Thompson (2004) Woods P.M. & Thompson C. astro-ph/0406133 (2004)