Observations of the unidentified TeV -Ray Source TeV J2032+4130 with the Whipple Observatory 10 m Telescope
Abstract
We report on observations of the sky region around the unidentified TeV -ray source (TeV J2032+4130) carried out with the Whipple Observatory 10 m atmospheric Cherenkov telescope for a total of 65.5 hrs between 2003 and 2005. The standard two-dimensional analysis developed by the Whipple collaboration for a stand-alone telescope reveals an excess in the field of view at a pre-trials significance level of 6.1. The measured position of this excess is , . The estimated integral flux for this -ray source is about 8% of the Crab-Nebula flux. The data are consistent with a point-like source. Here we present a detailed description of the standard two-dimensional analysis technique used for the analysis of data taken with the Whipple Observatory 10 m telescope and the results for the TeV J2032+4130 campaign. We include a short discussion of the physical mechanisms that may be responsible for the observed -ray emission, based on possible association with known astrophysical objects, in particular Cygnus OB2.
1 Introduction
During observations of the Cygnus X-3 region in 1993 by the Crimean Astrophysical Observatory, using the GT-48 imaging atmospheric Cherenkov telescope, a serendipitous source at a pre-trial significance of 6 was detected at a position of approximately 0.7∘ to the north of Cygnus X-3. Assuming an integral spectral index of -1.5, Neshpor et al. (1995) reported the -ray flux of this unidentified source above 1 TeV as , which is about 1.7 times the Crab-Nebula flux.
Independent observations of the Cygnus X-3 region with the High Energy Gamma Ray Astronomy (HEGRA) system of five imaging atmospheric Cherenkov telescopes deployed at La Palma, Canary Islands, were performed during 1999-2001 with 10 milliCrab sensitivity and arc-minute resolution. These observations revealed a region of extended -ray emission at a significance level of 5 (Aharonian et al., 2002) that is positionally consistent with the -ray source originally detected by the Crimean Astrophysical Observatory. Follow-up observations of this unidentified TeV -ray source in the Cygnus region with HEGRA in 2002 enabled a rather accurate measurement of the source position, , and its angular extent, (Aharonian et al., 2005a). The -ray flux above 1 TeV reported by Aharonian et al. (2005a) was , which is 5% of the Crab Nebula flux. The source has a power-law energy spectrum with a hard photon index of .
Cygnus X-3 was the focus of extensive observations with the Whipple Observatory 10 m imaging atmospheric Cherenkov telescope during 1989-1990. There was no evidence of a signal from Cygnus X-3 (O’Flaherty et al., 1992). A total of 50.4 hrs of analyzable data were accumulated during that campaign. These observations included in the field of view the reported location of TeV J2032+4130. An analysis of these archival data by Lang et al. (2004) resolved an excess of emission close to the HEGRA position of TeV J2032+4130 at a significance level of 3.3. It is worth noting that the peak signal in the Whipple Observatory data was noticeably offset by to the north-west of the HEGRA source position. Lang et al. (2004) reported the -ray flux of TeV J2032+4130 to be 12% of the Crab-Nebula flux above 400 GeV.
There are presently no well-established counterparts of TeV J2032+4130 at other wavelengths (Butt et al., 2006) despite the fact that the source is located within the bounds of the Cygnus OB2 association (Aharonian et al., 2005a), an active star-forming region. As such, TeV J2032+4130 represents a new class of the TeV -ray sources commonly referred to as dark accelerators owing to their unknown origin.
2 Experiment
The Whipple 10 m atmospheric Cherenkov telescope consists of a cluster of photomultiplier tubes placed at the focus of a relatively large optical reflector. The images of the Cherenkov light flashes generated both by -ray and charged cosmic-ray primaries interacting in the Earth’s atmosphere are digitized and recorded. A dedicated off-line analysis of these images enables a substantial suppression of the large cosmic-ray background and therefore dramatically improves the resulting signal-to-noise ratio.
The reflector of the Whipple Observatory imaging atmospheric Cherenkov telescope is a tessellated structure consisting of 248 spherical mirrors, which are hexagonal in shape and 61 cm size from apex to apex, arranged in a hexagonal pattern (Cawley et al., 1990). The mirrors are mounted on a steel support structure, which has a 7.3 m radius of curvature with a 10 m aperture. Each individual mirror has 14.6 m radius of curvature and is pointed toward a position along the optical axis at 14.6 m from the reflector. This arrangement constitutes a Davies and Cotton (1957) design of the optical reflector. The point-spread function of the Whipple Observatory 10 m telescope has a FWHM of on-axis.
In 1999, a 490-pixel high-resolution camera (GRANITE III) was installed at the Whipple Observatory (Finley at al., 2001). It consists of an inner camera of 379 PMTs in a close-packed hexagonal arrangement (each PMT subtending on the sky) and has a diameter. The inner camera is surrounded by 111 PMTs of in 3 concentric rings. The overall field of view of the camera is in diameter. However, the 3 concentric rings of pixels were removed from the camera in 2003 so that only the 379 inner pixels were present during the TeV J2032+4130 campaign. A set of light concentrators is mounted in front of the inner pixels to increase the light-collection efficiency by %. The camera triggers if the signal in each of at least 3 neighboring PMTs out of the inner 331 exceeds a threshold of 32 mV, corresponding to 8-10 photoelectrons. The post-GRANITE III upgrade trigger rate of the Whipple Observatory 10 m telescope is Hz at zenith. The recorded images are first flat-fielded using nightly measured nitrogen arc lamp PMT responses and then cleaned by applying a standard picture and boundary technique with thresholds of 4.25 and 2.25 times the standard deviation of the PMT pedestal distributions, respectively (see, e.g., Kildea et al. 2006). To characterize the shape and orientation of calibrated images, the standard second-moment parameters are calculated as described by Reynolds et al. (1993). To equalize the night-sky noise in the ON and OFF fields, a software padding technique (see, e.g., Lessard et al. 2001) is applied.
The response of the Whipple 10 m telescope has changed over time due primarily to degradation of the optical elements, occasional readjustment of the PMT gains and seasonal variations of atmospheric transparency. Fortunately the telescope response (e.g., event-detection rate, distribution of image sizes) to the steady cosmic-ray flux is extremely sensitive to each of these effects and it can be effectively used for validating the actual telescope performance. LeBohec and Holder (2003) developed a standard procedure to use cosmic-ray events taken at the zenith to track changes in the instrument throughput that reflect changes in the instrument sensitivity over time. This throughput factor can be measured using the luminosity distribution of the recorded cosmic-ray flashes and it allows accurate monitoring of the telescope response throughout periods of observation not affected by major hardware upgrades. A somewhat similar approach was used earlier with the first stand-alone HEGRA telescope (Konopelko et al., 1996).
3 Observations
The position of TeV J2032+4130 was observed with the Whipple Observatory 10 m imaging atmospheric Cherenkov telescope at Mt. Hopkins for about 65 hrs of good on-source data between 2003 and 2005. Data were obtained in the ON/OFF mode where each ON-source data run is either immediately preceded or followed by a matching OFF-source run where the telescope tracks the same region of zenith angles but with an offset in right ascension from the true source position. The observations were taken in pairs of both “ON before OFF” and “OFF before ON” runs of 28 min duration each. This practice provided two independent background fields to help minimize systematic effects due to the bright sky in the vicinity of TeV J2032+4130. To further reduce any possible systematic bias in the on-source sample of recorded images, caused by inhomogeneous illumination across the camera field of view, a fraction of observational data was taken using 38 min “ON before OFF” and “OFF before ON” runs. Thus the total data set employed 4 independent background fields to minimize sky-brightness systematics. TeV J2032+4130 was observed during four nearby epochs between 2003 and 2005 (see Table 1). A total of 132 data pairs were collected in good weather at zenith angles less than . The average elevation and the average throughput factors for the four observational periods are given in Table 1.
The 10 m telescope has custom tracking software that has been in use for approximately 10 years. The 10 m telescope pointing model has been determined by imaging stars on a white screen mounted at the focal plane to measure pointing errors as a function of azimuth and elevation. These pointing errors are used to develop the corresponding T-point corrections. Typically the T-point corrections are done at intervals of about three months, with an error between subsequent corrections typically less than . T-point corrections are applied to the tracking software to account for gravitational flexure of the structure as a function of the azimuth and elevation of the telescope. To monitor the tracking of the telescope during routine data taking, tracking records are stored once every 30 seconds in the data stream. These records include the position of the pointing direction at the current epoch, the canonical position of the source at the current epoch, and the azimuth and elevation of the telescope derived from the telescope encoders. These data allow us to check that the pointing direction of the telescope are consistent from run to run and season to season as we accumulate a database of long observations on a particular source. We have examined the results of comparing the encoder-derived azimuth and elevation of the source under study here, TeV J2032+4130, and the pointing direction of the telescope. The pointing direction is consistent with the source direction from season to season and any offset is much smaller than the size of the central PMT. Additionally, pointing checks are acquired on a routine basis by placing a bright star (in the vicinity of the source under study) at the center of the field of view and recording the PMT currents. These pointing checks indicate an absolute offset of (i.e., less than half the single-pixel field of view) and are consistent with the offline analysis of Crab-Nebula data (see Figure 2).
4 Data Analysis
The data-analysis pipeline consists of two distinct phases. The data are first processed and distributions from the raw uncut data are accumulated as diagnostics of both the condition of the instrument and the stability of the weather conditions. Each data run is visually inspected for rate stability, timing stability and tracking consistency, and either accepted or rejected based on this first pass. Once this diagnostic pass is made, acceptable runs are further processed for scientific investigation. Despite the significant advancements that have been made in different aspects of the imaging atmospheric Cherenkov technique during the last decade, a canonical analysis method known as Supercuts (Punch et al., 1991) still stands as the most effective set of -ray image-selection criteria for the Whipple Observatory 10 m telescope. This method utilizes both the shape and orientation information in the recorded Cherenkov light images (Fegan, 1997). The choice of optimal analysis cuts heavily relies on the actual configuration of the imaging camera, e.g. the angular size of PMTs, total field of view, the level of night-sky background light in each pixel etc. Therefore after the recent hardware upgrade for GRANITE III had been completed, a new set of Supercuts was developed in 2001 using a Crab-Nebula data sample that was rich in -ray content (see Table 2). Since then, this particular implementation of Supercuts has remained the standard selection method for subsequent data taken with the Whipple Observatory 10 m telescope.
In an a priori search for point-like -ray sources, the standard Supercuts includes an orientation parameter, , in addition to the parameters listed in Table 2. In the present investigation, we used instead a two-dimensional analysis described previously by Buckley et al. (1998) and Lessard et al. (2001) for off-axis or extended -ray sources. Images of the -ray showers have their major axes preferentially pointed towards the source position on the sky. The elongation of an image, which commonly has an elliptic shape, defines a point of origin for that individual event. For a source of rays positioned anywhere within the camera field of view, the shower images will point towards that actual source position in the camera. The angular distance from the image centroid (the center of gravity) to the point of origin can be determined as
| (1) |
where and are the transverse and lateral angular extensions of the image, respectively (Fegan, 1997). is an ellipticity parameter of the image, which is by definition equal to 0 for a circular image. Note that is the only free parameter in Eqn.(1). The straight line along the major axis of the image can be rendered in a Cartesian coordinate system on the camera focal plane using the position of the image centroid and the azimuthal angle of the image. The angular distance along this line from the image centroid to the point of origin can be computed using Eqn.(1), which ultimately determines a unique arrival direction for every recorded shower. A large set of Crab-Nebula data was used to derive that optimal value of parameter which provides a minimal spread of the points of origin around the known position of a point-like -ray source. Analysis of the Crab-Nebula data yields an optimal value of . The resulting precision for directional shower reconstruction with this optimal is . Source localization for a bright -ray source (1 Crab) is of the order of a few arcmins after 1 hr observing time and is comparable to the systematic uncertainty in the telescope pointing, about .
In the two-dimensional analysis of images recorded by the Whipple Observatory 10 m telescope, all calibrated, cleaned and parameterized events in the ON and OFF data sets are analyzed, first, with Supercuts (see Table 2) and consequently binned in a two-dimensional grid, mapping the sky field around the position tracked by the telescope. There were three major approaches used to perform a two-dimensional analysis. In particular, one can generate (i) a sky map (declination vs right ascension) of uncorrelated rectangular bins with an angular size of ; (ii) a sky map smoothed with a circular aperture of radius, and (iii) a Gaussian-smoothed sky map, in which each candidate -ray event receives a statistical weight of
| (2) |
where is the actual width of the telescope point-spread function, derived from Crab-Nebula observations, and is the current reference position within the grid. By subtracting the number of counts in the OFF map from the corresponding number of counts in the ON map, one can compute the excess in recorded events for each position within the camera field of view covered by the grid. Excess counts in this difference map represent the number of rays from the putative source. Due to truncated events (i.e., events that are not contained within the fiducial area of the camera) and the front/back ambiguity of the two-dimensional analysis (Lessard et al., 2001) we restrict the field of view for the analysis to a radius of from the telescope pointing direction. This restriction minimizes systematics resulting from events with their light distribution close to the edge and external to the camera field of view. Note that the actual observing time in the ON and OFF fields might not be identical: this is taken into account by applying the procedure described by Li & Ma (1983).
5 Telescope Performance
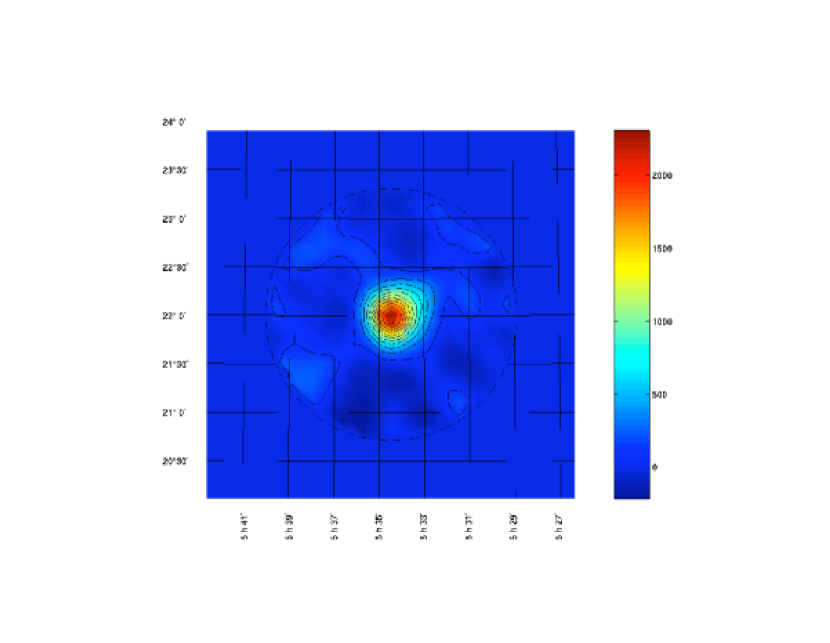
The performance of the Whipple Observatory 10 m telescope during 2003-2005 can be estimated using contemporaneous observations of the Crab Nebula, which is the standard candle of VHE -ray astronomy (Weekes et al., 1989). The Crab Nebula was routinely observed with the Whipple Observatory 10 m telescope for normalization of the instrumental response during three consecutive epochs during the winter seasons of 2003/2004, 2004/2005 and 2005/2006, for 13.8 hr, 12.2 hr and 18.7 hr, respectively. The complete data-reduction chain described here was tested in great detail on the Crab-Nebula data. The two-dimensional sky maps of extracted candidate -ray events were generated separately for the ON and OFF data sets for a similar field of view with uncorrelated rectangular bins. These two-dimensional sky maps have been used to produce the excess-counts map. An excess of very high statistical significance is seen at the position of the Crab Nebula. The angular shape of the -ray signal from the Crab Nebula can be well reproduced by the two-dimensional Gaussian
| (3) |
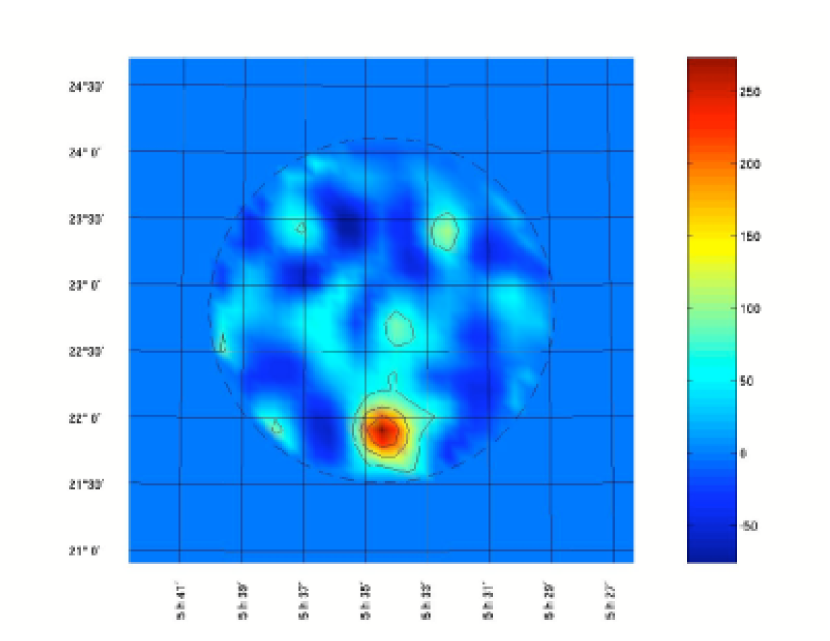
where two sets of parameters, (,) and (,), characterize the systematic offset and broadness of the point-spread function, respectively. The parameters of the fit obtained for three nearby observational epochs are summarized in Table 3. Note that the position of the -ray peak deviates from the position of the Crab Nebula by less than . The average width of the point-spread function is (see Figure 1). This observationally determined is used as the width of the Gaussian distribution invoked in Eqn.(2), which was adopted for the smoothing of the two-dimensional sky maps. For an additional crosscheck, a number of ON and OFF Crab-Nebula pairs were taken with a and offsets from the nominal position (see Figure 2). These data runs were analyzed using exactly the same two-dimensional analysis method as described above and the resulting sky maps of the Crab-Nebula region show a clear -ray excess displaced from the center of the field of view. The position of the Crab-Nebula -ray peak is found to be consistent with the initial offset and the width of the -ray signal distribution is the same size as for the ON-axis observations.
To determine the position and angular extent of a putative -ray source in the field of view of the 10 m telescope the two-dimensional excess counts map is fitted to a model of a Gaussian -ray brightness profile of the form , where and are the approximate angular size of the source and the width of the point-spread function, respectively. The origin of the Gaussian fit determines the source position.
The two-dimensional analysis of the Crab-Nebula data taken during three consecutive observing periods yields a rather stable -ray rate and signal-to-noise ratio (see Table 4). Some remaining seasonal variations can be attributed to changes of the telescope response corresponding to various hardware conditions such as gain change of the PMTs, mirror reflectivity, etc. After applying Supercuts and an aperture cut of , the measured Crab -ray rate was 1.0 /min, which corresponds to a signal-to-noise ratio of about 4 (see Table 4). It is worth noting that the one-dimensional analysis utilizing the parameter yields a higher signal-to-noise ratio as well as a correspondingly higher -ray rate. This is due to a front/back ambiguity of the arrival direction determination. Normally this ambiguity is resolved by measuring the asymmetry of the light distribution in the image to choose the “correct” arrival direction. However, the small field of view of the camera utilized for this data sample, in diameter, prevents us from making a reasonable estimate of the asymmetry. We are then forced to accept both solutions for the arrival direction, front and back, for a given image orientation in the focal plane.
The sensitivity of the Whipple Observatory 10 m telescope to a -ray signal within its field of view can be noticeably improved by applying Gaussian smoothing to the ON and OFF sky maps. In this approach (see Section 4) each of the events accepted by Supercuts obtains a statistical weight that is assessed according to the events angular distance from the current test position for a -ray source. A two-dimensional Gaussian distribution, centered at the test source position and with width along each dimension of the Cartesian coordinate system, determines the statistical weight of the candidate -ray events. The performance of this method was evaluated with the Crab-Nebula data sample (see Figure 1) and the summary of these results is given in Table 4. This method yields a substantial recovery in the -ray rate and a correspondingly higher significance of the excess. An analysis of the Gaussian-smoothed two-dimensional maps yields results which are comparable with those derived from a standard analysis of Crab-Nebula data taken in the ON-source observation mode (see Table 4).
6 Results
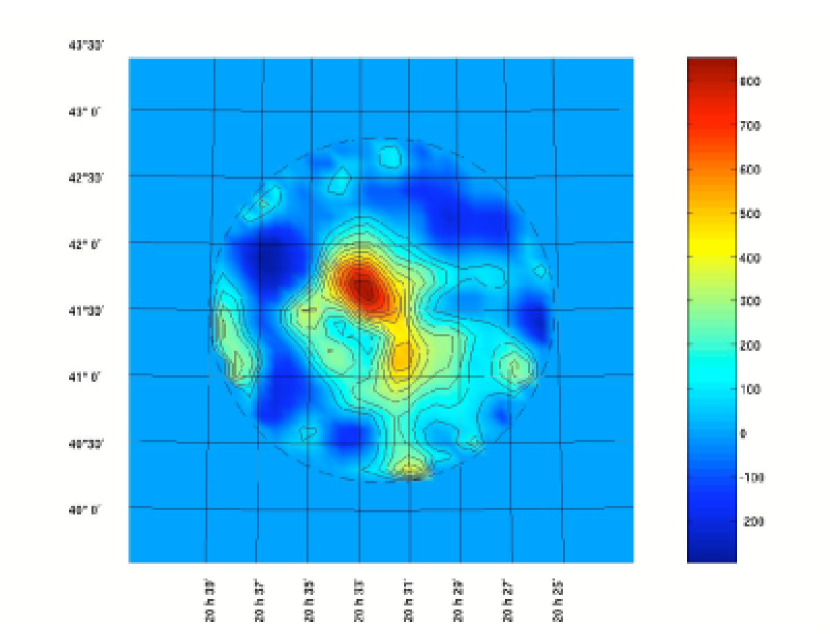
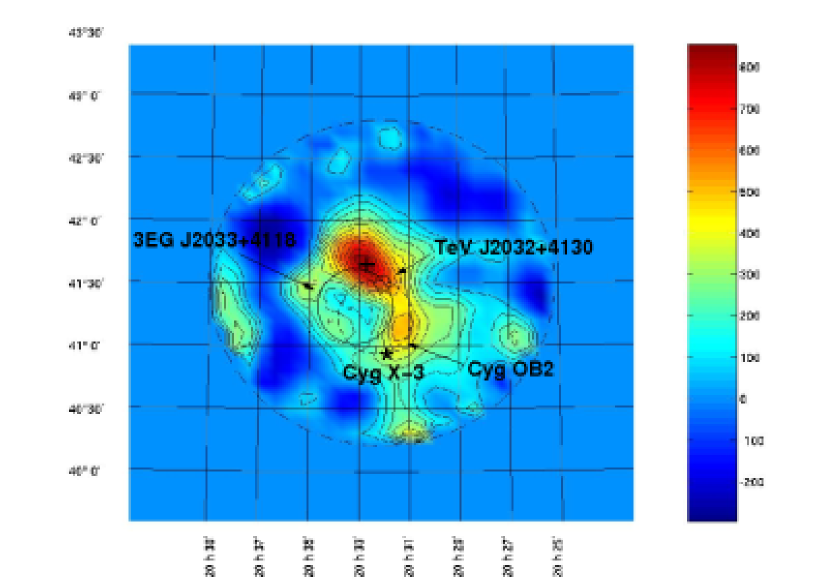
The TeV J2032+4130 observational data taken with the Whipple Observatory 10 m telescope at Mt. Hopkins between 2003 and 2005 in the ON/OFF mode for a total ON-source time of 65.6 hrs have been analyzed using the standard analysis methods developed by the Whipple collaboration. These methods have been tested in great detail for various well-established -ray sources detected with the Whipple Observatory 10 m telescope, particularly the Crab Nebula, which is a standard candle of ground-based TeV -ray astronomy. The two-dimensional Gaussian-smoothed excess-counts map of the TeV J2032+4130 sky region shows a distinct excess in the vicinity of the HEGRA unidentified -ray source (see Figure 3). The significance of this excess and its celestial coordinates are summarized in Table 5. This excess seen by the Whipple Observatory 10 m telescope (see Figure 3) has an angular displacement of about from the HEGRA -ray source. Given the statistical and systematic uncertainties in the source localization (about and , respectively), the displacement of the excess in Figure 3 is consistent with the position of the HEGRA unidentified -ray source. A Gaussian fit of the smoothed excess-counts map shown in Figure 3 gives as the width of the excess. For comparison the correponding width of the -ray excess from the Crab Nebula is . Based on these data, there is good statistical evidence for a source near the HEGRA detection and with angular extent less than . A detailed analysis of the map shown in Figure 3 reveals the presence of a second excess located to the south-west of the HEGRA unidentified -ray source. However, the statistical significance of this excess corrected for the number of trials does not reach the 3 level which precludes our determination of the nature of this enhancement as a -ray source. Follow-up observations of the TeV J2032+4130 field with the VERITAS system of four 12 m atmospheric Cherenkov telescopes with substantially improved angular resolution will allow us to carry out a dedicated search for possible extended -ray emission in the TeV J2032+4130 surroundings at a significantly improved sensitivity level.
Based on the data reported here the source seen with the Whipple Observatory 10 m telescope is consistent with a point-like -ray source. At the same time, given a width of the PSF for the 10 m Whipple collaboration telescope, we can not distinguish between a point source and a diffuse source with extent less than a . Thus the Whipple source is consistent with HEGRA source in terms of its extension.
The present Whipple Observatory signal for the -ray source resolved in the vicinity of the HEGRA unidentified -ray source does not have sufficient strength for adequate measurement of its -ray spectrum. Assuming that the spectral shape of the emission is similar to the standard candle -ray source, the Crab Nebula, one can estimate its -ray flux based on derived -ray rates. Based on that assumption, the -ray flux is at the level of 8% of the Crab Nebula. Assuming the source is at a distance D = 1.7 kpc, which is the distance to the Cygnus OB2 complex, its luminosity in TeV rays is
Although the -ray fluxes measured by different groups suggest a steady -ray emission, a variable or sporadic nature of the -ray emission from this source can not be ruled out at this stage given the large uncertainty in the flux estimates.
7 Discussion
The TeV J2032+4130 HEGRA source belongs to a class of -ray sources known as dark accelerators. These are presumably galactic sources owing to their low galactic latitudes and the lack of variability in TeV rays. They have no compelling counterparts at other wavelengths. Recently the High Energy Stereoscopic System (H.E.S.S.) collaboration has discovered a population of unidentified -ray sources in the Galactic plane (Aharonian et al., 2005b, c, 2006). The underlying nature of these sources is presently poorly understood. For instance, HESS J1303-631, which is the brightest among the unidentified -ray sources, could be plausibly interpreted as the remnant of a -ray burst that occurred in our Galaxy a few tens of thousands of years ago (Atoyan, Buckley and Krawczynski, 2006).
The TeV -ray emission observed by Crimean Astrophysical Observatory (Neshpor et al., 1995), HEGRA (Aharonian et al., 2005a) and the Whipple Observatory (Lang et al., 2004), and the -ray emission reported here, are located within the bounds of the Cygnus OB2 stellar association (Aharonian et al., 2002). It is 1.7 kpc away, rather compact (about across) and the most massive OB association known in the Galaxy, implying a tremendous mechanical power density accumulated in the stellar winds of its 2600 OB star members (Lozinskaya, Pravdikova and Finogenov, 2002). Such an association offers a unique case to test the hypothesis of Galactic cosmic-ray acceleration by the supersonic stellar winds of many young OB stars propagating into the interstellar medium (Cassé and Paul, 1980; Cesarsky and Montmerle, 1983). In this scenario, the TeV rays can be the tracers of the emission originating in the interactions of very energetic nuclei with interstellar matter. Steady MeV-GeV -ray emission detected by the EGRET instrument from the Cygnus OB2 region (3EG J2033+4118, Hartmann et al. 1999) generally supports such a physical interpretation.
Detection of the X-ray emission resolved from the -ray emitting region might help to constrain severely the origin of the -ray emission, specifically helping to determine whether electrons or nuclei are responsible for the production of the TeV rays seen from the Cygnus region. Recent observations of the unidentified TeV source in the Cygnus region with the Chandra satellite revealed no obvious X-ray counterpart (Mukherjee et al., 2003; Butt et al., 2003, 2006), evidently favoring a hadronic origin for the rays from the Cygnus region. However, it is worth noting that the -ray emission region reported here (see Figure 3) lies outside of the Chandra observational window. It is apparent that further X-ray observations of a relatively broad region around Cygnus could possibly provide a detection of the X-ray counterpart(s) and consequently help to elucidate the physics of the ’dark accelerators’ seen in TeV rays.
Future dedicated observations of the Cygnus region with advanced ground-based (e.g. VERITAS) and satellite-borne (GLAST) -ray detectors are required to help us understand the physics of this population of unidentified galactic TeV -ray sources.
Acknowledgements
This research is supported by grants from the Smithsonian Institution, U.S. DOE, NSF, PPARC (UK), NSERC (Canada), and SFI (Ireland).
References
- Aharonian et al. (2002) Aharonian, F., et al. (HEGRA collaboration) 2002, A&A, 393, L37-L40
- Aharonian et al. (2005a) Aharonian, F., et al. (HEGRA collaboration) 2005a, A&A, 431, 197-202
- Aharonian et al. (2005b) Aharonian, F., et al. (H.E.S.S. collaboration) 2005b, A&A, 439, 1013
- Aharonian et al. (2005c) Aharonian, F., et al. (H.E.S.S. collaboration) 2005c, Science, 307, 1938
- Aharonian et al. (2005d) Aharonian, F., et al. (H.E.S.S. collaboration) 2005d, Science, 309, 5735
- Aharonian et al. (2006) Aharonian, F., et al. (H.E.S.S. collaboration) 2006, ApJ, 636, 777
- Albert et al. (2006) Albert, J., et al. (MAGIC collaboration) 2006, Sciencexpress, 18 May 2006
- Atoyan, Buckley and Krawczynski (2006) Atoyan, A., Buckley, J. & Krawczynski, H. 2006, ApJ, 642, L153
- Buckley et al. (1998) Buckley, J., et al. 1998, A&A, 329, 639
- Butt et al. (2003) Butt, Y., et al. 2003, ApJ, 597, 494
- Butt et al. (2006) Butt, Y., et al. 2006, ApJ, 643, 238
- Cassé and Paul (1980) Cassé, M. & Paul, J.A. 1980, ApJ, 237, 236
- Cesarsky and Montmerle (1983) Cesarsky, C.J. & Montmerle, T. 1983, Space Sci. Rev., 36, 173
- Cawley et al. (1990) Cawley, M.F., et al. 1990, Exper. Astron., 1, 173-190
- Davies and Cotton (1957) Davies, J.M. & Cotton, E.S. 1957, Journal of Solar Energy, 1, No. 2-3, 16-22
- Fegan (1997) Fegan, D.J., 1997, J. Phys. G: Nucl. Part. Phys. 23, 1013-1060
- Finley at al. (2001) Finley, J.P., et al. 2001, Proc. of ICRC, Hamburg, 7, 2827
- Hartmann et al. (1999) Hartmann, R.C., et al. 1999, ApJS, 123, 79
- Kildea et al. (2006) Kildea, J., et al. 2006, Astropart. Phys., in preparation
- Knödlseder (2000) Knödlseder, J. 2000, A&A, 360, 539
- Konopelko et al. (1996) Konopelko, A., et al. 1996, Astropart. Phys., 4, 199-215
- Lang et al. (2004) Lang, M.J., et al. 2004, A&A, 423, 415-419
- LeBohec and Holder (2003) LeBohec, S. & Holder, J. 2003, Astropart. Phys., 19, 221-233
- Lessard et al. (2001) Lessard, R.W., et al. 2001, Astropart. Phys., 15, 1
- Li & Ma (1983) Li, T.P. & Ma, Y.O. 1983, ApJ, 272, 317
- Lozinskaya, Pravdikova and Finogenov (2002) Lozinskaya, T.A., Pravdikova, V.V. & Finogenov, A.V. 2002, Astron. Lett., 28, 223
- Mukherjee et al. (2003) Mukherjee, R., et al. 2003, ApJ, 589, 487
- Neshpor et al. (1995) Neshpor, Y.I., et al. 1995, Proc. 24th ICRC (Rome), 2, 385
- O’Flaherty et al. (1992) O’Flaherty, K.S., et al. 1992, ApJ, 396, 674
- Punch et al. (1991) Punch, M., et al. 1991, Proc. 22nd ICRC (Dublin), 1, 464
- Reynolds et al. (1993) Reynolds, P.T., et al. 1993, ApJ, 404,206-218
- Weekes et al. (1989) Weekes, T.C., et al. 1989, ApJ, 342, 379-395
| Epoch | Calendar period | ON time [min] | Number of runs | Elevation | Throughput |
|---|---|---|---|---|---|
| 1 | Sep - Nov 2003 | 1471 | 54 | 73∘ | 1.01 |
| 2 | Apr - Jun 2004 | 991 | 36 | 72∘ | 1.01 |
| 3 | Sep - Nov 2004 | 525 | 15 | 75∘ | 1.08 |
| 4 | May - Jul 2005 | 950 | 27 | 70∘ | 0.98 |
| Image parameter cut | |
|---|---|
| Trigger | Brightest pixel 30 dcaadigital counts |
| Second brightest pixel 30 dcaadigital counts | |
| Shape | |
| Muon rejection | aadigital counts) |
| Image quality |
| Obs. period | (counts) | (∘) | (∘) | (∘) | (∘) |
|---|---|---|---|---|---|
| 2003/2004 | 124 | -0.028 | -0.026 | 0.120 | 0.131 |
| 2004/2005 | 96 | -0.033 | -0.017 | 0.121 | 0.140 |
| 2005/2006 | 154 | -0.037 | 0.001 | 0.138 | 0.106 |
| Obs. period | t (min) | SaaThe data were analyzed with the one-dimensional analysis with . () | aaThe data were analyzed with the one-dimensional analysis with . () | SbbThese results have been obtained by applying an aperture cut of 0.22∘. () | bbThese results have been obtained by applying an aperture cut of 0.22∘. () | SccResults of the analysis of the Gaussian () smoothed ON and OFF sky maps. () | ccResults of the analysis of the Gaussian () smoothed ON and OFF sky maps. () |
|---|---|---|---|---|---|---|---|
| 2003/2004 | 828 | 21.1 | 3.01 | 16.0 | 1.18 | 22.3 | 2.6 |
| 2004/2005 | 734 | 17.7 | 2.40 | 14.9 | 1.00 | 21.9 | 2.1 |
| 2005/2006 | 1225 | 19.2 | 2.35 | 15.6 | 0.96 | 23.6 | 2.1 |
| / | S () | ON | OFF | ON - OFF | Flux (Crab) | |
|---|---|---|---|---|---|---|
| , | 6.1 | 9475 | 8652 | 823 | 0.19 | 0.08 |