Absence of H I in the Boötes Dwarf Spheroidal Galaxy
Abstract
Neutral hydrogen (H i) observations towards the Boötes dwarf spheroidal (dSph) galaxy (hereafter Boötes), a very low luminosity metal-poor Galactic satellite, were obtained using the Parkes Radio Telescope. We do not detect any H i in or around Boötes to a upper limit of within the optical half light radius and within 1.6 kpc. Its H i mass-to-light ratio is less than , making Boötes one of the most gas-poor galaxies known. Either reionisation severely inhibited gas infall onto the proto-Boötes, or large amounts of gas have been removed by ram pressure and/or tidal stripping. Since Boötes lies on the mass-metallicity fundamental line, this relation and the inefficiency of star formation at the faintest end of the galaxy luminosity function must be partly driven, or at least not disrupted, by extreme gas loss in such low luminosity galaxies. We also do not detect any H i associated with the leading tidal tail of the Sagittarius dSph galaxy, which fortuitously passes through the observed field, to a column density limit of . This suggests that either the leading gaseous tail is ionised, or the gas in the trailing tail was removed before the current tidal disruption of the parent dSph began.
keywords:
galaxies: individual: Boo dSph, Sgr dSph – galaxies: dwarf – Local Group – galaxies: ISM – galaxies: evolution1 Introduction
Analysis of the stellar distribution in the Sloan Digital Sky Survey has led to the recent discovery of many very faint dwarf satellite galaxies of the Milky Way (Willman et al., 2005; Zucker et al., 2006a, b; Belokurov et al., 2006a, b; Grillmair, 2006). Among the least luminous is the satellite in Boötes that was discovered by Belokurov et al. (2006a) and has an estimated distance of 60 kpc, with a right ascension (RA) of and declination of ( and in Galactic coordinates). Its central surface brightness is with an optical half-light radius of 13′. Muñoz et al. (2006) obtained spectra of a number of red giant branch and asymptotic giant branch stars in Boötes and found a heliocentric systemic velocity of (or , where is the velocity with respect to the Local Standard of Rest) and a velocity dispersion of . This implies a dynamical mass of , similar to that of most low luminosity dwarfs (Mateo, 1998). The combined spectra of Boötes member stars are consistent with a metallicity of , making it the most metal-poor galaxy known in the Local Group. From the periods of 15 RR Lyrae variable stars in Boötes, Siegel (2006) also calculated a metallicity of and a distance of .
Based on the population of red giant branch stars in its colour magnitude diagram, Muñoz et al. (2006) suggested that the luminosity of Boötes may be a factor of almost five larger than the estimate of Belokurov et al. (2006a), implying . Siegel (2006) also argued for a high luminosity based on the population of RR Lyrae stars. Further support for this higher luminosity comes from the “fundamental line”, a tight correlation between the mass-to-light ratio, metallicity, and central surface brightness of Local Group satellite galaxies (Prada & Burkert, 2002). Assuming and , this relation predicts a dynamical mass-to-light ratio for Boötes of , in agreement with the higher luminosity estimate of Muñoz et al. (2006), which we therefore adopt. The continuation of the fundamental line down to the most metal-poor galaxy in the Local Group makes Boötes an ideal place to probe the origin of the relation.
Although the environs of the Milky Way contain a number of low-mass faint dwarf galaxies, cosmological simulations predict an even larger number of potential host subhaloes (Klypin et al., 1999; Moore et al., 1999). A natural interpretation for this discrepancy is that lower-mass haloes are increasingly inefficient at converting their primordial baryons into stars. This interpretation is bolstered by the internal kinematics of the lowest luminosity dwarfs, whose luminosities drop dramatically as they approach a universal halo mass of , suggesting that this is the critical mass for efficient star formation (Mateo, 1998).
Gas loss from supernova feedback and stellar winds have been invoked to explain both the low luminosities of low-mass galaxies and the mass-metallicity relation (Dekel & Woo, 2003; Read et al., 2006). In the vicinity of larger galaxies, gas can also be lost to ram pressure stripping (Blitz & Robishaw, 2000; Grebel et al., 2003), tidal stripping (Connors et al., 2006), or both (Mayer et al., 2006). In contrast, hydrodynamic simulations of dwarf galaxies by Tassis et al. (2006) and Brooks et al. (2006) suggest that the low star formation efficiency is driven not by gas loss but by self-regulated star formation consistent with the Kennicutt (1998) star formation law. Reionisation may also dramatically reduce the number of baryons available to form stars in many low-mass haloes (Kepner et al., 1997; Bullock et al., 2000; Dong et al., 2003).
The predicted properties of the interstellar media of dwarf galaxies are different in each of these scenarios. If dwarf galaxies are inefficient at converting their available baryons into stars then they will still contain large reservoirs of gas. On the other hand, tidal stripping leaves streams of gas extending both in front of and behind dwarfs, while ram pressure stripping leaves only trailing streams. If reionisation inhibits gas infall then there will be no discernible gas associated with dwarfs.
Blitz & Robishaw (2000) examined the Leiden-Dwingeloo H i Survey (Hartmann & Burton 1997, LDS; see also Kalberla et al. 2005) for H i emission associated with most Local Group dSph galaxies. They found that many dSphs contain large amounts of gas, with typical velocity widths of , but that those within 250 kpc of either the Milky Way or M31 are devoid of H i (see also Burton & Lockman, 1999). They argued that ram pressure stripping is responsible for this deficit of gas among nearby satellites.
The relative proximity of the Boötes dSph galaxy allows us to detect very small quantities of gas and probe the relationship between stellar mass, gas mass and dynamical mass at the faintest end of the galaxy luminosity function. In this paper we present H i observations in the direction of Boötes, obtain strict upper limits for its H i mass, and use those limits to constrain the origin of its extremely low luminosity. By coincidence, the leading stellar tidal tail of the Sagittarius dSph galaxy, another satellite of the Milky Way which is in the process of tidal disruption, passes in front of Boötes along the line of sight (Muñoz et al., 2006). H i has been identified in the trailing tail (Putman et al., 2004), but none has yet been detected in the leading tail as might be expected if the gas were tidally stripped along with the stars. We obtain strict upper limits on the column density of H i associated with the Sagittarius leading tail.
2 Observations and Data Reduction
Observations were obtained at the 64m Parkes Radio Telescope in June 2006 using the 20cm multibeam receiver (Staveley-Smith et al., 1996). The 13 beams of the receiver are arranged in a hexagonal pattern with a 96′-wide footprint. To ensure full spatial sampling within the inner 25 25 of the field and to reduce artefacts introduced by scanning, scans in both constant RA and declination were observed, at a rate of . Each scan was 2°9′ in length and adjacent scans were offset by 32′. An approximately 3° 3° field was mapped, with 33 sets of 3 RA scans interleaved with 32 sets of 3 declination scans, or 195 individual scans total. To provide wider spatial coverage, these data were combined with 9 declination scans 8° in length spanning an area approximately 6° 8° centred on Boötes.
The receiver was operated in frequency switching mode with a throw of 3.125 MHz centred on 1420.4015 MHz, with 2048 channels over an 8 MHz bandwidth, resulting in a velocity coverage of and a channel width of . The spatial resolution of the data is . Fluxes were calibrated from observations of the standards S6, S8, and S9 (Williams, 1973). Although the data have not been corrected for stray radiation, it is unlikely to impact our observations due to the high Galactic latitude of the observed field.
Raw data were reduced using Livedata and then gridded into a 3D cube using Gridzilla, where data from beam 12 were omitted due to a failure of one of its low noise amplifiers. All analysis of the data cube was performed using IDL. After bandpass calibration, baseline residuals at the 10 mK level were present; we therefore corrected for these residuals by determing the baseline on a pixel-by-pixel basis using a median filter of width . This provided a good baseline fit except at , where Galactic emission biases the median. Therefore, when analysing the data at the expected Sagittarius stream velocity (Muñoz et al., 2006), we fitted a 3rd-degree polynomial over a 50 wide velocity range surrounding . Examples of this process are shown in Figure 1.
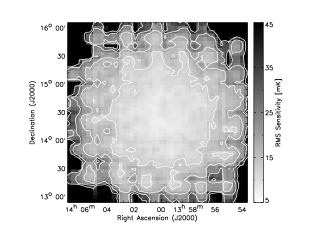
The rms brightness temperature sensitivity achieved in each channel varies across the field due to the arrangement of the beams, with a maximum sensitivity of 7 mK and a median sensitivity of 13 mK within 15 of the field centre. The sensitivity was empirically determined for each pixel from the rms dispersion in an emission-free region of the spectrum after baseline subtraction, and is shown in Figure 2.


Examination of individual channel maps reveals that the data over velocity ranges of and are affected by low-level radio frequency interference (RFI) of unknown origin. We mask out all affected channels in the analysis and discuss the effects on our upper limits in § 3.
3 Results for Boo dSph
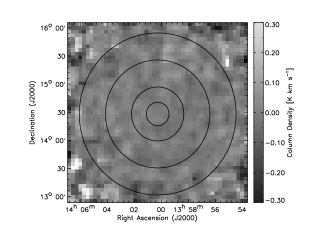
We find no evidence of H i emission at the velocity of Boötes. In Figure 3 we present the zeroth moment map integrated over a velocity width of centred at , excluding RFI-affected channels. No statistically significant features are seen over the entire 3° 3° field (3.5 x 3.5 kpc at a distance of 60 kpc). We have calculated the integrated line flux both at the central pixel and in a number of circular apertures with radii ranging from the half light radius of 13′ to 90′. Sample averaged spectra are shown in Figure 4, while corresponding mean column densities, , and H i masses, , are given in Table 1. The quoted uncertainty has been calculated empirically by performing an identical analysis at 200 randomly-chosen central velocities located far from local Galactic emission and taking the dispersion of these measurements; this method implicitly takes into account systematics such as residual baseline-fitting errors in addition to the random error component.

| Aperture | Integrated Line Flux | ||
|---|---|---|---|
| Radius | [K ] | [] | [] |
| 1 pixel | |||
| 13′ | |||
| 30′ | |||
| 60′ | |||
| 90′ |
aEquivalent mass within the beam half power radius.
Taking a upper limit, we conclude that there is no more than of H i at velocities within the optical half-light radius of Boötes. Although we cannot measure an upper limit in the region of the spectrum affected by RFI, we can rule out any significant reservoir of H i, which would be evident in the clean part of the spectrum. If we assume that any emission at RFI-affected velocities is of similar magnitude to that in the clean part of the spectrum then the upper limit on the total H i mass within the optical half-light radius is . This assumption is likely to be valid unless the H i emission is much narrower than the emission seen in other dSphs (Blitz & Robishaw, 2000) and offset to positive velocity with respect to the stars, a possibility we consider unlikely as gas removed by ram pressure stripping would trail the stars and appear offset to negative velocity. In an aperture with radius 90′ (1.6 kpc at a distance of 60 kpc) we find a upper limit of of H i at , and a total RFI-corrected H i mass upper limit of . The column density limit within the beam is at and correcting for RFI-affected channels.
4 Results for Sgr Leading Tail
Putman et al. (2004) found no detections of positive velocity H i along the orbit of the Sagittarius dSph in the H i Parkes All-Sky Survey (HIPASS). The HIPASS observations north of the celestial equator reach an rms sensitivity of 11 mK with a spectral resolution of , corresponding to a column density upper limit of .
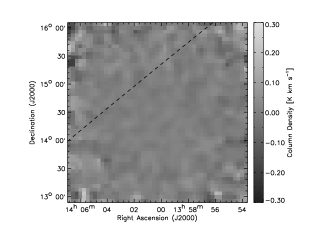
In Figure 5 we present our zeroth moment map integrated over a velocity width of centred at . These much deeper observations still reveal no evidence for any emission at the velocity of the Sagittarius leading tidal tail. Due to the polar orbit of Sagittarius, stream gas is expected to lie nearly parallel to lines of constant Galactic longitude, where is indicated by the dashed line in Figure 5. No features are found elongated in this direction. The column density upper limit averaged over the central pixels is . In an attempt to enhance any faint signal, we have calculated the mean column density in strips of constant with widths, , ranging from 15′ to 90′. An example for strips of width , corresponding closely to the beam FWHM, is shown in Figure 6 and does not reveal any emission. We conclude that there is no H i associated with the leading Sagittarius tidal tail at this location down to a column density limit of .
The leading tail also appears to be devoid of ionised gas, based on the non-detection of H emission at this location and velocity in the Wisconsin H-Alpha Mapper Northern Sky Survey (WHAM-NSS; Haffner et al. 2003) to a intensity upper limit of . If ionised leading stream gas exists with the same column density as the neutral gas that is in the trailing tail, then its volume density must be less than , implying an unreasonably large line-of-sight depth of . However, a moderate reduction in the mean column density within the WHAM beam could lower to plausible values.

5 Conclusions
We detect no H i gas associated with the Boötes dSph galaxy down to a column density limit of , corresponding to a mass limit of within the optical half-light radius and within 1.6 kpc of the optical galaxy. While the stellar body of Boötes appears distorted (Belokurov et al., 2006a), casting doubt on its morphological classification, the dearth of gas in Boötes clearly indicates that it is an early-type dSph galaxy.
In Figure 7 we plot the gas fraction of Boötes, as estimated by the ratio of the H i gas mass to the V-band luminosity, along with the other dSph companions to the Milky Way catalogued by Blitz & Robishaw (2000) (for Sagittarius we use the deeper limit of Burton & Lockman 1999). Our observations are more than 5 times deeper than those of the LDS; combined with the relative proximity of Boötes, we are able to detect much smaller quantities of H i than Blitz & Robishaw (2000). Boötes has the most stringent upper limit on its absolute H i mass of any Local Group galaxy, and is among the most gas-poor galaxies even relative to its extremely low luminosity, with a upper limit of . Only the much more luminous Sagittarius and Fornax dSphs are known to be more gas-poor.
Boötes has converted only a small fraction of its primordial baryons into stars. The leftover gas is no longer part of Boötes as would be expected if self-regulated star formation had been the only process operating. Unless reionisation prevented cool gas from falling onto Boötes at early times, gas must have been removed by tidal forces, ram pressure stripping, or supernova feedback. The proximity-gas mass relation (Blitz & Robishaw, 2000; Figure 7) argues strongly against supernova feedback as the primary mechanism, since it occurs in all environments. Neither streams of stripped gas nor outflowing gas from Boötes are detected, indicating that these gas removal processes have either already completed or have left streams too tenuous to be detected with current observations. As Boötes lies on the fundamental line (Prada & Burkert, 2002), the explanation for such a mass-metallicity relation cannot be entirely due to inefficient self-regulated star formation but must be partially driven, or at least not disrupted, by the extreme gas loss or primordial deficit in cool gas experienced by this low luminosity galaxy.
We detect no neutral gas associated with the leading Sagittarius tidal tail down to a column density limit of . If the gas detected along the trailing tail (Putman et al., 2004) had been tidally stripped along with the stars, then a leading tail of gas would also exist. Either this leading tail is ionised, which would require it to have a lower density than the trailing tail, or the gas in the trailing tail was removed by ram pressure stripping before the tidal disruption of the parent galaxy began.
No other non-Galactic emission is detected at over the entire 6° 8° field.

Acknowledgments
The Parkes Observatory is operated by the Australia Telescope National Facility, a division of the Commonwealth Scientific and Industrial Research Organisation. The Wisconsin H-Alpha Mapper is funded by the National Science Foundation. We thank John Reynolds, Andrew Hunt, and Jay Lockman for useful discussions. JB thanks the Australian Research Council for financial support.
References
- Belokurov et al. (2006a) Belokurov, V. et al. 2006a, ApJ, 647, L111
- Belokurov et al. (2006b) Belokurov, V. et al. 2006b, ApJ, in press, astro-ph/0608448
- Blitz & Robishaw (2000) Blitz, L., & Robishaw, T. 2000, ApJ, 541, 675
- Brooks et al. (2006) Brooks, A. M., Governato, F., Booth, C. M., Willman, B., Gardner, J. P., Wadsley, J., Stinson, G., Quinn, T. 2006, ApJL, submitted, astro-ph/0609620
- Bullock et al. (2000) Bullock, J. S., Kravtsov, A. V., Weinberg, D. H. 2000, ApJ, 539, 517
- Burton & Lockman (1999) Burton, W. B., Lockman, F. J. 1999, A&A, 349, 7
- Connors et al. (2006) Connors, T. W., Kawata, D., Gibson, B. K. 2006, MNRAS, 371, 108
- Dekel & Woo (2003) Dekel, A., Woo, J. 2003, MNRAS, 344, 1131
- Dong et al. (2003) Dong, S., Lin, D. N. C., Murray, S. D. 2003, ApJ, 596, 930
- Grebel et al. (2003) Grebel, E. K., Gallagher, III, J. S., Harbeck, D. 2003, AJ, 125, 1926
- Grillmair (2006) Grillmair, C. J. 2006, ApJ, 645, L37
- Haffner et al. (2003) Haffner, L. M., Reynolds, R. J., Tufte, S. L., Madsen, G. J., Jaehnig, K. P., Percival, J. W. 2003, ApJS, 149, 405
- Hartmann & Burton (1997) Hartmann, D., Burton, W. B. 1997, Atlas of Galactic Neutral Hydrogen (Cambridge University Press)
- Kalberla et al. (2005) Kalberla, P. M. W., Burton, W. B., Hartmann, D., Arnal, E. M., Bajaja, E., Morras, R., Pöppel, W. G. L. 2005, A&A, 440, 775
- Kennicutt (1998) Kennicutt, Jr., R. C. 1998, ApJ, 498, 541
- Kepner et al. (1997) Kepner, J. V., Babul, A., Spergel, D. N. 1997, ApJ, 487, 61
- Klypin et al. (1999) Klypin, A., Kravtsov, A. V., Valenzuela, O., Prada, F. 1999, ApJ, 522, 82
- Mateo (1998) Mateo, M. L. 1998, ARA&A, 36, 435
- Mayer et al. (2006) Mayer, L., Mastropietro, C., Wadsley, J., Stadel, J., Moore, B. 2006, MNRAS, 369, 1021
- Moore et al. (1999) Moore, B., Ghigna, S., Governato, F., Lake, G., Quinn, T., Stadel, J., Tozzi, P. 1999, ApJ, 524, L19
- Muñoz et al. (2006) Muñoz, R. R., Carlin, J. L., Frinchaboy, P. M., Nidever, D. L., Majewski, S. R., Patterson, R. J. 2006, ApJ, 650, L51
- Prada & Burkert (2002) Prada, F., Burkert, A. 2002, ApJ, 564, L73
- Putman et al. (2004) Putman, M. E., Thom, C., Gibson, B. K., Staveley-Smith, L. 2004, ApJ, 603, L77
- Read et al. (2006) Read, J. I., Pontzen, A. P., Viel, M. 2006, MNRAS, 371, 885
- Siegel (2006) Siegel, M. H. 2006, ApJ, 649, L83
- Staveley-Smith et al. (1996) Staveley-Smith, L. et al. 1996, PASA, 13, 243
- Tassis et al. (2006) Tassis, K., Kravtsov, A. V., Gnedin, N. Y. 2006, ApJ, submitted, astro-ph/0609763
- Williams (1973) Williams, D. R. W. 1973, A&AS, 8, 505
- Willman et al. (2005) Willman, B. et al. 2005, ApJ, 626, L85
- Zucker et al. (2006a) Zucker, D. B. et al. 2006a, ApJ, 643, L103
- Zucker et al. (2006b) Zucker, D. B. et al. 2006b, ApJ, 650, L41