11email: ginevra.trinchieri@brera.inaf.it 22institutetext: Institut für Astronomie, Universität Wien Türkenschanzstrasse 7, A-1180 Wien Austria 33institutetext: Max-Planck-Institut für extraterrestrische Physik, Giessenbachstrasse, D-85740 Garching Germany 44institutetext: Department of Physics and Astronomy, University of Alabama, Tuscaloosa, AL 35487, USA
Evidence of unrelaxed IGM around IC1262
Abstract
Aims. A peculiar morphology of the hot gas was discovered at the center of IC1262 with the ROSAT HRI. Sensitive Chandra and XMM-Newton data were requested to investigate the characteristics of this structure to understand its nature.
Methods. We have exploited the high resolution and sensitivity of Chandra’s ACIS-S to investigate the peculiar morphology and spectral characteristics of hot gas in the group around IC1262. XMM-Newton data are only partially usable due to very heavy high background contamination, but they are useful to confirm and strengthen the results from Chandra.
Results. The Chandra data show a quite dramatic view of the IC1262 system: a sharp discontinuity east of the central galaxy, with steep drops and a relatively narrow feature over 100 kpc long, plus an arc/loop to the N, are all indicative of a turmoil in the high energy component. Their morphologies could suggest them to be tracers of shocked material caused either by peculiar motions in the system or by a recent merger process, but the spectral characteristics indicate that the structure is cooler than its surroundings. The lack of evidence of significant structures in the velocity distribution of the group members and the estimated scale of the phenomenon make the interpretation of its physical nature challenging. We review a few possible interpretations, in light of similar phenomena observed in clusters and groups. The ram pressure stripping of a bright spiral galaxy, now near the center of the group, is a promising interpretation for most of the features observed. The relation with the radio activity requires a better sampling of the radio parameters that can only be achieved with deeper and higher resolution observations.
Key Words.:
ISM: general; X-rays: galaxies: clusters; Galaxies: ISM; X-rays: ISM1 Introduction
The presence of hot gas in groups, which is now being detected to fainter and fainter levels, raises many questions about the origins of the IntraGalacticMedium (IGM) and its role in the formation and evolution of the whole system. The existence of gas in groups is a strong indicator of a common gravitational potential, and its detection in the X-ray band ensures that this potential is sufficiently deep to heat gas to X-ray emitting temperatures. Given the short dynamical timescales, galaxies in groups are likely to be undergoing significant interactions and mergers. Infall of new material, interaction and/or merging of either accreted material or of group members can produce perturbations in the whole system. It is to be expected that the much smaller masses involved than in clusters of galaxies allow the detection of small perturbations that result from these processes in the intragroup material. In high resolution N-body simulations, arc-like structures with higher X–ray surface brightness relative to the underlying smooth gas emission are expected, since the X–ray emissivity is higher in high density regions. Moreover, in groups even fainter structures will be visible than in rich clusters, because the background IGM is cooler and less luminous, and therefore the X-ray contrast will be better.
IC1262 was identified with a ROSAT All Sky Survey source, and selected for follow up observations because of its unusually high X-ray to optical flux ratio. The detailed ROSAT-HRI observations and optical data have in fact suggested that the emission can be attributed to the presence of a small group around the galaxy, which explains to first order both the high luminosity ( 2.2 erg s-1, and 32.7 [log (erg s-1 L)]) and the extension of the source ( 250 kpc,111We have rescaled the original values to our current assumption of the distance, 140 Mpc (Ho = 70 km s-1), which corresponds to a scale of kpc-1. Trinchieri & Pietsch, 2000). However the high resolution image showed more than just what might be expected from a small group. A central complex structure, with significant surface brightness discontinuities, was evident in the X-ray image. This structure appears as a perturbation over a relatively flat plateau, outside of which there is a relatively smooth surface brightness decline, similar to what is observed in many other groups (and usually modeled with a -type function). Its luminosity, above the local emission, account for about 10% of the total, and it is comparable itself to that of small groups.

We have obtained follow-up observations with both Chandra and XMM-Newton, to better characterize the properties of the group and of the central morphology and understand its nature. Preliminary results from the Chandra data were presented in Trinchieri (2004) and Trinchieri & Saporiti (2004); here we present the detailed analysis of both sets of data.
Hudson et al. (2003) and Hudson & Henriksen (2003) have also studied this source with BeppoSAX and have used the same Chandra data as a follow up of the comparison between X-ray and the radio emissions, prompted by the results of the BeppoSAX observation. These authors claim a detection of diffuse, non-thermal emission to the S of IC1262, which they associate with a mini-halo in the radio, most likely produced by a merging episode with a smaller sub-clump. As will become clear in the data analysis and discussion sections, the Chandra data confirm the very complex morphology highlighted by the ROSAT HRI data, but also show a very complex temperature structure in the central region, that brings us to somewhat different conclusions regarding the presence of non-thermal emission. However, the paucity of data at other wavelengths is the major obstacle in our understanding of the characteristics of this source. We are planning to investigate its multiwavelength properties with new data. In the present work we will make use of the data already available in the literature and in the public archives.
2 Results of the data analysis
The galaxy IC1262 was observed by the Chandra Observatory (Weisskopf et al., 2000) in the ACIS-S imaging configuration in August 2001 for 31 ks. The peak of the emission was positioned at the aim-point of the back-illuminated CCD S3 (CCD7). A short and unfortunately relatively poor quality observation was also obtained with XMM-Newton in February 2003 with the Thin Filter for all EPIC instruments (Jansen et al., 2001; Strüder et al., 2001; Turner et al., 2001). The log of the observations is given in Table 1. We base our analysis on the Chandra observation; however, we will use XMM-Newton data when needed to confirm/strengthen the Chandra results.
2.1 Chandra data
The Ciao software (Version 3.2.2) was used to clean and update the level 2 event files and to apply the most recent calibrations, as suggested by the “Threads” provided online at asc.harvard.edu. No high background flares were contained in the dataset, so we retain the total observing time. The resulting raw image in the 0.3-7.0 keV energy range is shown in Fig. 1. Already in the raw image a complex morphology is evident at the center of the emission, along with several individual sources. The iso-intensity contours of the adaptively smoothed map on the DSS blue image (right panel) indicate a significantly larger extent than evident in the unsmoothed data.
| Observ. | Instrument | Livetime (ksec) | |
|---|---|---|---|
| ID. | Total | Used | |
| 2018 | ACIS-S | 30.7 | 30.7 |
| 002114091 | EPIC-pn | 30.1 | 3.1 |
| EPIC-MOS1 | 44.8 | 3.7 | |
| EPIC-MOS2 | 44.8 | 3.4 | |
NOTE: The XMM-Newton times refer to the last observation. All other attempts at observing the galaxy could not be used due to high background.
Since previous X-ray observations of this object with the ROSAT HRI had already suggested a large extent (r Trinchieri & Pietsch, 2000), we expect that a large portion of the field of view will be covered by the source. We have therefore considered blank sky observations to estimate the field background (see discussion in Markevitch et al., 2003) which we have re-projected to reproduce the orientation of the IC1262 observation. To normalize them to the IC1262 data we considered the data in the 10-12 keV range and estimated the count ratios between blank field and the IC1262 observations in the same region; the choice of the high energies should ensure us that the contamination from the extended emission is negligible, and we in any case excluded a region around the peak of the emission in CCD7. We have considered both CCD7, and the two adjacent front illuminated CCD’s, CCD6 to the SW and CCD8 to the NE, which should contain some of the extended emission from IC1262, given its extent. The rescaling factors that we obtain from the count ratios are remarkably close to the values obtained by a simple rescaling based on the observing times for all three CCDs. As will become clear from the comparison of the radial profiles (see Section 2.3), the shape and normalization of the count distribution in CCD8 (which we will not use for scientific analysis) match to % those of its relative normalized background field; we therefore will assume that the blank fields rescaled by the counts/time ratios give a good approximation of the shape and level of the background expected in the field.

2.2 XMM-Newton data
Due to an overwhelming contamination by high background events, we have used only the last of four attempts at observing this field. Unfortunately even this observation had to be cleaned from long-lasting and strong flaring events. We used the standard background light curve data provided by the SAS software to select the good time intervals where high energy count rate is stable, although not at the level observed in periods of real low background (count rates of for MOS, instead of an average value of , and cnt s-1 for PN, instead of ). After cleaning, only s of data remain, from the original request of 20 ks. Although of limited value on their own, they confirm and extend at larger radii the results obtained with the Chandra data, as will become apparent in the discussion of the individual issues.
To increase the statistics, we have merged MOS1+MOS2 event files, less affected by the CCD-gaps pattern than the PN observation, and we use the result to produce smoothed maps and radial profiles of the emission, along with the PN data.

2.3 X-ray images
The broad band Chandra image of Fig 1-right shows both the complex central morphology evident in the raw data and the extent of the emission, that covers the full CCD field of view. An even better sampling of the emission at large radii is provided by the bigger field of view of the XMM-Newton data. The isophotes of the adaptively smoothed maps in two broad energy bands shown on the optical image in Fig. 2 immediately suggest that the large scale structure is consistent with a relatively unperturbed emission from a group-like potential, in particular at energies above 2.5 keV.
Adaptively smoothed images of the central region in different energy bands from Chandra data are presented in Fig. 3, which clearly illustrates the dependence of the morphological features of the emission on energy. Since the use of adaptive smoothing, an excellent tool for displaying purposes, could be misleading, and selectively enhance/depress features as a function of the statistical significance of the data considered, we have tried to compare images with comparable statistics. The high energy data is the strongest limitation, with counts, so we present a selection of narrow band images at low energies with counts each. We have also used projections of real data in different energy bands, again in slices of comparable statistics, to quantify the reality of the visual impression given by Fig. 3. In spite of the considerable loss of statistics, that would produce sharper and better defined shapes, each narrow band image shows a different morphology, which are all different from the hard band image. The comparison points to a dependence of the central structure with energy, which becomes less prominent with increasing energy. At energies above 2 keV little remains of the perturbation seen most evidently in the softer images ( keV), and the emission is oblong in the E-W direction, relatively well centered on IC1262. This is again evidence that at higher energies the emission is strongly related to the galaxy and the group potential, and might represent the more relaxed, “more traditional” component of a hot InterStellar/InterGalactic medium commonly found in E-dominated groups (Mulchaey, 2000) down to the inner region around IC 1262.
At softer energies the emission around the galaxy is dominated by a complex structure. The comparison with the optical image, from the DSS2 plate, indicates little coincidence between X-ray features and the galaxies in the group: the coincidence of a few X-ray point sources with optical compact objects guarantees that the astrometry is good, and leaves little doubt that the arc-like structure is E and well outside of IC1262.
2.4 Source extent
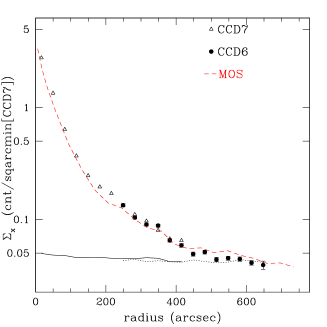
We compared the radial profiles of the emission from the source to those of the background in different CCD’s to evaluate the total extent of the source. Fig. 4 shows the comparison of the azimuthally averaged profile in the 0.3-7 keV band, both for IC1262 and the background files. Different symbols are used to distinguish different CCDs. All counts are rescaled to match the counts in CCD7. We have used a single point in the profile to normalize them to the CCD7 data: CCD6 counts are normalized at r, CCD8 at r. To ensure that the profiles cover only illuminated parts of the CCD, we have masked out the regions outside the respective fields of view. Therefore the azimuthal average covers 360 only out to a radius of . Outside this radius, CCD7 covers a progressively smaller angle to the NNE, CCD6 to the SSW, and CCD8 an even smaller angle again to the NNE.
Given the highly disturbed central morphology, we have used the higher energy profile, less affected by the central structure, to determine the centroid of the emission. Even with this choice we are somewhat sensitive to the presence of a possible source at the center of the emission that slightly biases the determination of the center of the large scale emission. Excluding this potential contaminant, we centered the profile at 17h33m02s.86,43°45′3433. This is consistent with the optical position of IC1262 given by NED222http://nedwww.ipac.caltech.edu/. Other point sources in the field have been masked out from the profile.
As evident from the figure, there is very good agreement between CCD7 and CCD6, at the same radial distance, so we are confident that we can use CCD6 data to estimate the extent of the emission. On the other hand, the radial distribution of the counts in CCD8 shows a modulation which is most likely due to residual features related to the flaw in the serial readout of the chips (see the discussion available on the asc.harvard.edu site). However, the same is true for the background data: in fact the two distributions look remarkably similar both in shape and in normalization, so we will no longer use CCD8 data.
The azimuthally averaged ACIS-S profile indicates an extent out to , after which the shape of source and background profiles become very much alike. This is confirmed by the XMM-Newton data (Fig. 4-right), that show a radially decreasing profile with a flattening at about the same radial distance. We will therefore assume a total radial extent of for IC1262, larger than reported previously (6′, Trinchieri & Pietsch, 2000). This indicates that the source has an extent of at least 350 kpc, typical of poor groups.
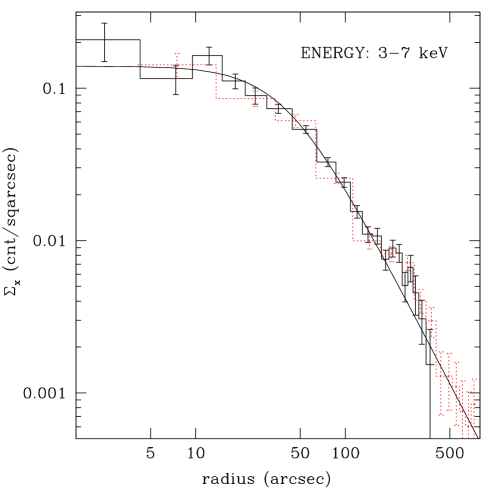
Figure 5 shows the radial distribution of the net emission from CCD7 in different azimuthal sectors and energy bands. The azimuthally averaged high energy profile (right panel) shows that the emission is well fit by a “-profile”: the line plotted represents a r and model; this is not a proper fit to the data but is simply an example of a reasonably good representation of the large scale photon distribution. Again the XMM-Newton data is in full agreement, and extends the profile at larger radii. The softer emission, obtained in two halves, can also be represented by the same law at large radii: in fact, outside of r, the two halves become indistinguishable and well represented by the assumed profile. Inside this radius, the NE half shows an excess over both the other half and the parameterization, while the SW direction shows an excess only within the innermost 5′′. The -profile values used here are entirely consistent with the values found in the ROSAT data (Trinchieri & Pietsch, 2000).
2.5 Characterization of the X-ray features
We have considered a more quantitative assessment of two parallel aspects of the complexity of the X-ray emission of IC1262: the morphological and spectral structures.
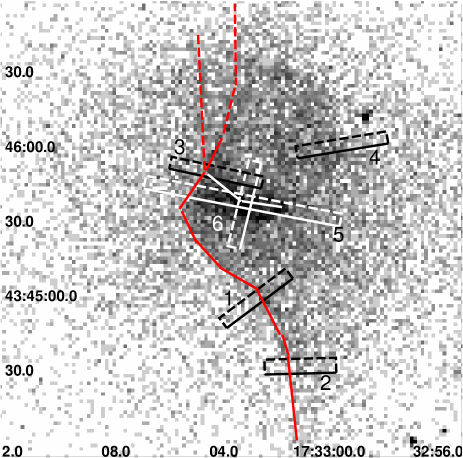
We have produced a series of projections across the sharp central feature along its full length, in regions chosen as perpendicular as possible to the ridge, to maximize the surface brightness discontinuity. In Fig. 7 we show a small but representative selection, obtained in the regions shown in Fig. 6. We also obtained projections along and across the central bright enhancement on and E of IC1262 (Fig. 8). Several interesting properties of the structure become apparent: 1) surface brightness jumps of factors of a few in less than 2′′ ( kpc at the distance of IC1262) appear to be a common feature in the data along the whole extent of the structure; 2) the NS structure can be as narrow as ; 3) there appears to be a plateau of higher emission “behind” the jump, 4) the EW enhancement closest to IC1262 is approximately 520 kpc, with structure along the E-W direction.
2.6 Spectra

Since the emission detected is significantly higher than the expected “sky” and detector backgrounds, we consider as background the emission around each region to highlight differences with the neighbouring emission. In particular, for all regions within from the center (see Fig. 9) we use a circle to the SE, all within the area delimited by the innermost circle, that does not contain any of the morphological high surface brightness features (included in the many smaller regions in the figure). We have checked that its energy distribution is consistent with that of other similar regions, chosen always within region “inner” but away from the features evident; the choice of the particular location is simply dictated by the fact that to the SE we can choose a larger circle than elsewhere. The outer regions have been used for the inner larger annuli, so region “middle” is the background for region “inner”, and region “outer” for “middle”. A separate region to the NE is used for the regions further out (“outer”,“N”, “E” and “NE”).

We have defined several regions of emission from which we derive both the contribution of each individual component and the photon energy distribution to be used for spectral analysis, using the color map shown in Fig. 9 as a guide. Figure 9 is obtained from the combination of three images in 0.3-1.1, 1.1-2.5, 2.5-4.0 keV bands. The data are adaptively smoothed with the same smoothing function to reduce the noise. Although colors might not be easy to translate into temperatures, the map clearly indicates that the central region is extremely complex, and that even outside the centre there is structure in the “colors”. The regions defined and the temperatures we derive for each of them are summarized in Fig. 10. Photons have been assigned only to one region so that each “external” region does not contain the inner ones. Point-like sources evident in the maps are also excluded.

We have binned the raw data with the dual purpose of minimizing the bin-to-bin fluctuations (using only a few channels, even when the statistical significance of each would be sufficient for the correct use of the chi-square test, mostly at low energies) and of obtaining a positive signal in all spectral channels considered, after the background is subtracted (larger bins, usually required at high energies, where the background contribution is most relevant).
In most cases the data can be fitted with a single temperature plasma. When the statistics is good we have let all parameters free to vary (low energy absorption, temperature and abundances). In all cases absorption is consistent with galactic NH. Best fit abundances also span a rather narrow range around 0.3-0.5 solar. When the data quality is poorer, we fixed NH at the galactic value and the abundance parameter at 0.5 (and checked also the results for 0.3 and 1) solar. We have used the Wilms et al. (2000) tables for all fits.
The 90% confidence values for the temperatures derived for each region, shown graphically in Fig. 10, indicate that: 1) the central feature has a systematically lower temperature, around kT1 keV, than the surrounding regions, even close-by ones at lower surface brightness; 2) there is a trend of increasing temperatures with radius, from an average 1.7 keV in the central region to 2 keV outside the inner ; 3) cooler temperatures can still be traced out to along what appears as the extensions of the tail to the S and N of the feature, in spite of little evidence in the morphology at those radii (but some distortions are visible in the isophotes in Fig. 1).
These results are in broad agreement with those published by Hudson & Henriksen (2003), who find that most of the regions sampled require a two component model. This is entirely consistent with the presence of a softer high density feature on top of a broader harder emission pictured in Fig. 10. However they suggest that a better representation of the data, and more physically meaningful, is found by adding a non-thermal component in the region to the north and south of the X-ray flux peak, rather than a second thermal component, to account for excess emission above a keV plasma emission. Since we have used a much finer sampling of the area, with smaller size regions, and have identified the softer component with the region of the perturbation, we identify the harder one with the large scale diffuse emission and therefore require a second thermal model to fit the data. Moreover, we have checked that the keV model is a good fit at different azimuthal angles (we have done it for region “middle”, and for the innermost circle, as explained above), and not just in one privileged direction, which supports the interpretation with emission from a pervasive hot gas.
3 Discussion
IC1262 is the dominant early type galaxy at the center of an aggregate of galaxies with 31 confirmed members (Smith et al., 2004) distributed over approximately 20′ (see Fig. 11). While a reliable census of membership is incomplete (for details, see the selection criteria in Smith et al., 2004), it is clear that IC1262 lies at the center of a rich group or poor cluster, with only a few galaxies of comparable magnitude (e.g. IC1263 to the NE, and IC1264, to the S, using the photometry given in NED). The group has a regular velocity distribution (cf. also Fig. 7 in Smith et al., 2004) and an estimated velocity dispersion 560 km s-1 (S. Andreon, private communication, using Beers et al., 1990; Andreon et al., 2006).
The total X-ray luminosity of the group, as measured from the ROSAT data (Trinchieri & Pietsch, 2000) and confirmed by the Chandra and XMM-Newton data, exceeds LX= erg s-1. With a gas temperature kT keV, the group falls at the upper end of the and LX- relations determined for Group Evolution Multiwavelength Study (GEMS) groups and close to the values for richer clusters ( Osmond & Ponman, 2004).
The spatial distribution of the extended gas, measured at energies above 2-3 keV, can be modeled with a -profile. The core radius we have assumed in Fig. 5, r25 kpc, is consistent with values obtained for the GEMS groups for the group-like component (Osmond & Ponman, 2004). Many groups could also display a central component, consistent with a contribution from the central galaxy, with a smaller core radius and located at the center of the more extended one (e.g., Mulchaey & Zabludoff, 1998; Helsdon & Ponman, 2000). The complexity of the X-ray structure near IC1262 makes it difficult even with Chandra resolution to map the central part of the diffuse gas component. Above 3 keV, where the central complexity is almost absent, we find no indication of a “shoulder” in the profile that is usually the signature of the central galaxy. However, such a signature might not be visible above keV if such a component has a softer spectrum as might be expected from the InterStellarMedium (ISM) of an early-type galaxy. The XMM-Newton data, both at high and low energies, confirm the Chandra results and extend the profile at least out to 350 kpc (Fig. 5).
The morphology of the extended gas in the inner is surprisingly complex with a narrow, sharp and cool structure. This is most likely a signature of recent significant events imprinted on an underlying relaxed component. The agreement between the centroid of the hard energy emission and IC1262 supports the idea that the overall system is in equilibrium. In that case the central structure is a perturbation with several interesting characteristics: 1) surface brightness “jumps” of factors of and 2) sharp edges (see Fig. 7 and 8); 3) long coherent structures in the form of a) a ( 2 kpc) narrow ridge, that can be visually traced for ( kpc), as roughly sketched in Fig. 6; an extension to this could also be found N, where a region of lower temperature is visible (see Fig. 9), and b) an almost complete “loop” or an arc on and N of IC1262, with a radius r (20 kpc); and 4) cooler temperatures along the full length of the high surface brightness ridge, relative to the average value in the lower surface brightness unperturbed inner region (see Fig. 10).
We can use the spectral results to estimate the gas density in the perturbation, which we consider on top of the unperturbed component. We have used the volume corresponding to the region shapes shown in Fig. 10. Since the third dimension is unknown, we assume an extension along the line of sight similar to that in the transverse direction. We find n cm-3 in the arc/loop, and values in the range n close to the center to n cm-3 at the south tip along the NS ridge. The total luminosity of the perturbation is L erg s-1 (0.5-2.0 keV), excluding the contribution from the point sources embedded in them, and could involve a mass M M☉. Assuming radiative cooling as the dominant energy loss mechanism, the structure could have a cooling time yrs. Although not measured, some degree of concentration is consistent with the appearance of the emission, and would result in higher densities and lower gas mass involved.
There is a general trend of higher pressures along and across the perturbation region than in the surrounding hot ICM gas, mainly due to somewhat higher densities along the X-ray ridge. Here the derived pressures range from to , while the average pressure in the inner region or just outside it is typically at . The overpressure in the high density regions will reduce due to expansion. For a temperature of 1 keV, the isothermal speed of sound will be roughly 400 km , and hence an expansion of about 0.4 kpc per Myr can be expected, decreasing strongly as the pressure difference with respect to the ICM becomes smaller. The “sharpness” of the feature can be maintained easily in regions with a small pressure difference or by an additional pressure component due to ICM turbulence or due to a magnetic field.
The timescale for the dissipation of discontinuities may cover a wide range, depending on the processes at work and the kind of discontinuities under consideration. If we have a tangential discontinuity, the stabilizing effect of a magnetic field would inhibit mixing due to magnetic tension, depending on the magnitude of the field. This could be one reason for the observed “sharpness” of the NS feature. If on the other hand the gas in the feature reaches a similar pressure than its surroundings, diffusion of the contact discontinuity progresses slowly and may be somewhat enhanced by a fluid instability (e.g. Kelvin-Helmholtz, bending mode). The diffusion coefficient is typically of the order of the diffusion speed (e.g. turbulent velocity) times the gradient scale (e.g. density or temperature). The reason that the feature would still remain sharp could then also be attributed to the fact that the density near the edge of the diffusion boundary drops rapidly, and the X-ray emissivity decreases quickly to the background level.

What can the origin of this feature be? We have looked for analogies with other better studied systems, where information in several additional bands (e.g. H, dust emission, radio structures) is available, to understand its nature. Indeed we found increasing evidence of structures in the IGM of groups and clusters of galaxies, that bear resemblances to this one, but also show clear differences. We examine here some of the most relevant phenomena that could explain the observational evidence.
3.1 Shock:
Since clusters of galaxies are thought to grow through gravitational infalls and mergers of smaller groups, shocks are expected to be common in groups and clusters. Indeed they are now imaged in the X rays: the Chandra image of 1E0657-56 (Markevitch et al., 2002) shows a clear cut example of a bow shock; the optical, IR and radio evidence of the shock in Stephan’s Quintet (SQ) is now very well documented in the X-ray images as well (Trinchieri et al., 2003; Trinchieri et al., 2005).
While the morphology of the structure could be indicative of a shock, its temperature, significantly cooler than the ambient medium, is a problem. In this respect, it could be analogous to the shock in SQ, which is also significantly cooler than predicted from the impact velocity of the galaxy that produces it. As extensively discussed in Trinchieri et al. (2005) the discrepancy cannot be easily overcome, unless we can resort to additional and very efficient cooling or peculiar geometrical effects. Most of the arguments used for SQ can be applied here as well, and again they are hard to reconcile with the shock interpretation.
An additional concern comes from the dynamics of the system. The distribution of the member velocities is regular (Smith et al., 2004), and although velocity differences of the order of 1000 km s-1 between members are observed, they are consistent with the velocity distribution from a relaxed and massive group. Neither the optical distribution of galaxies around IC1262 nor the distribution of redshifts would indicate peculiar motions in the system as a whole. In particular Fig. 11 shows that, even when we arbitrarily separate high and low velocity objects, we do not see any systematic effect that would suggest collisions or interactions between two systems. Unlike the SQ system, there is no evidence of a high velocity sub-system that could be slamming into the hot gas and produce the shock, unless the motion is all in the plane of the sky. Even in this case, there is no “obvious” structure which can be called in question: as already pointed out, the nearly NS distribution of objects, which could suggest that they all lie along the perturbation, could be a result of the selection, and not reflect the true distribution of member galaxies in the IC1262 system. A deeper image of the field, with proper identification of all potential members, is badly needed to clarify this. The lack of optical evidence of peculiar motions, or of high velocity “intruders” or large scale shocks that were instead unquestionable in Stephan’s Quintet, is a serious concern for such an interpretation.
3.2 Cold front/filament:
There is increasing evidence in the literature of sharp discontinuities in the surface brightness of the diffuse hot IGM component in clusters of galaxies. These have lower temperature than the surrounding medium, and have therefore been named “cold fronts” (Vikhlinin et al. 2001, Mazzotta et al. 2002). The origin of these features is also attributed to merging of smaller structures with larger systems, mostly in the plane of the sky, or even merging between major systems (Mathis et al., 2005; Bialek et al., 2002). The fronts have been interpreted as boundaries of dense cores moving through a hotter ambient medium (Markevitch et al., 2000; Vikhlinin et al., 2001). They are very sharp features, with lower temperatures on the brighter side of the discontinuity. Ram pressure stripping is thought to play a role also in giving the structure the characteristic curved shape observed (Markevitch et al., 2002; Heinz et al., 2003). Merger cold fronts have been reproduced in recent hydrodynamic simulations (e.g., Bialek et al., 2002; Nagai & Kravtsov, 2003; Mathis et al., 2005).
Cold narrow filaments have also been observed in a few cases: while some are associated with optical line emission (H) as in in A1795, (Crawford et al., 2005), and in Perseus (Fabian et al., 2006), a narrow arc-like feature is observed in A3667 (Mazzotta et al., 2002) and interpreted as evidence of large scale hydrodynamic instability developing from a prominent “cold front” due to a large cool cloud moving in the cluster atmosphere.
In IC1262 the morphology is more reminiscent of a cold narrow filament, since most “cold fronts” appear as more compact structures with a very sharp “front” and a more gradual trail-off behind it. However, unlike the above examples, the filamentary structure is not directly connected to optical objects or structures. The bright feature EW of IC1262 could be associated with the galaxy itself, and could be the result of stripping of the ISM as the galaxy moves into the hot IGM. However, its location at the center of the large scale distribution of the gas and its optical classification as a cD argue against significant motion relative to the cluster potential, unlike for example the tail observed in the late-type galaxy ESO 137-001 in A3627 (Sun et al., 2006). Moreover, the much larger structure could not be interpreted with stripping of IC1262. We cannot comment on an association with optical line emission or with dust, for lack of relevant observations. In addition, as explained above, we have no direct evidence from the velocity field of the relative motion of two distinct subgroups that would justify motion of cooler gas in the hot atmosphere, of the kind expected in cold fronts.
3.3 Current or past radio/AGN activity - cavities:

Structures associated with powerful radio sources have now been identified in many clusters of galaxies: in the Perseus cluster (Fabian et al., 2000), in Hydra-A (McNamara et al., 2000), and in several Abell clusters, A4059 (Huang & Sarazin, 1998), A2597 (McNamara, 2001), A2052 (Blanton et al., 2001), and A2634 (Schindler & Prieto, 1997), to cite a few. One of the most spectacular sources, Cygnus A, also shows a very complex central X-ray morphology and associated temperature structure (Wilson et al., 2006). The radio sources appear to act on the surrounding hot medium by pushing aside the gas and leaving low surface brightness “cavities” delimited by bright rims. In most of the cases studied, the emission from the rims is softer than the surrounding gas, consistent with models in which cooler material is displaced as the radio source expands subsonically. Models that would suggest these structures are produced by strong shocks (e.g. Heinz et al., 1998) are instead not supported by the observations.
The X-ray morphology and spectral characteristics of this system would strongly suggest that we are witnessing the same phenomenon here. A radio structure associated with IC1262 is visible in the Faint Images of the Radio Sky at Twenty-centimeters survey (FIRST Becker et al., 1995), NRAO VLA Sky Survey (NVSS Condon et al., 1998), and Westerbork Northern Sky Survey (WENSS Rengelink et al., 1997) archival data (see Fig. 12). At 327 MHz, the low resolution WENSS data indicate a rather extended source, with a morphology reminiscent of a radio galaxy centered on IC1262 and two lobes north and south of the galaxy. The NVSS data are not as extended, but show a source coincident with IC1262, and two sources N and S, at the position of the WENSS “lobes”, with the Southern source indicating possible substructure. At even higher resolution, FIRST detects compact sources at the core and the peak of the Southern lobe (as indicated in Fig. 12).
The interpretation of the radio structure is not clear, due to the limited data quality: the two sources N and S have relatively steep spectra (), while the central source is only visible at 1.4 GHz, indicative of a flatter spectrum. The comparison between the fluxes detected in the FIRST and NVSS surveys moreover suggests that both the central and southern sources are extended. Whether the radio emission is due to a double lobed radio source or whether a more complex structure should be considered (which would include a mini-halo near IC1262, see Hudson et al., 2003) will require higher resolution deeper observations. In any case, the luminosity of the radio source, if it is associated with IC1262, is quite low, P W Hz-1 (Central source only) or P W Hz-1 (including all three NVSS sources), significantly fainter than the power associated with most of the other radio galaxies responsible for cavities and rims. Moreover, the length of the X-ray structures associated with the radio sources is in most cases of the order of tens of kiloparsecs, rather than the a few hundred kpc size discussed here, except possibly for the Cygnus A source, which is several orders of magnitude brighter both in X rays and in radio.
In a few clusters, the interaction of the IntraClusterMedium (ICM) with a radio galaxy becomes less clear: X-ray cavities that do not coincide with the active radio lobes are found for example in Abell 2597, NGC 4636 and Abell 4059 (McNamara, 2001; O’Sullivan et al., 2005; Heinz et al., 2002) and the outer regions of Perseus A (Fabian et al., 2000). The presence of these cavities is now believed to be associated with past, currently faded, radio activity, related to previous cycles of nuclear activity.
The analogy with these other systems is again intriguing but not entirely satisfactory: Abell 4059, although host of ghost cavities, is currently classified as a FRI radio source, at Jy, which is considerably brighter than IC1262, also considering its larger distance. Heinz et al. (2002) argue that the source has faded significantly, from a FRII source responsible for the IGM structure. On a smaller scale, the structure in NGC 4636 has also been interpreted as due to past activity (Jones et al., 2002; Sun et al., 2006). The “current” radio source is comparable in strength with the source in IC1262 (Birkinshaw & Davies, 1985; Stanger & Warwick, 1986). The major difference is again in the size of the structures: O’Sullivan et al. (2005) suggest a scale of kpc for the expansion of the cool gas in the IGM of NGC 4636, and measure a size of kpc across the plume extending southwest from the galaxy core. The structure in IC1262 is in size!
However, the connection between the radio and X-ray structures is rather intriguing and worth of further studies.
3.4 Ram pressure stripping of a spiral member
In an exploratory study of parameter space, Stevens et al. (1999) modeled the interaction of a spherical galaxy with the ICM and showed that, although stripping is most efficient in rich clusters, where galaxies might lose all of their ISM due to higher ram pressure conditions, the best observable cases in X-rays should be cool clusters or groups of galaxies. This can be understood as follows: the best observable signatures should be the bow shock ahead of the stripped galaxy and the tail of stripped galaxy material. Whereas the bow shock is strongest in high velocity dispersion clusters, the actual contrast in X-ray surface brightness is small due to a more luminous ICM gas. On the other hand, the tail is strongest in a galaxy moving through a cool cluster environment, because here stripping is not complete and the stripped material does not disperse as fast as in the high velocity case. In addition, the effect of a high contrast X-ray surface brightness tail is enhanced by gravitational focusing of the slow moving material trailing behind the galaxy.
The observational evidence of the long narrow coherent structure and of distorted isointensity contours and cooler temperatures in the direction of the spiral galaxy IC1263, located N of IC1262 (see Fig. 1), prompted us to consider it as a suitable observable candidate for ram pressure stripping in a cool cluster. Several arguments are in favour of this scenario:
the amount of cooler X-ray gas is comparable to the ISM mass in IC1263. Not much is known about this galaxy, except that it is of type SBab and that it has a semimajor axis of arcmin diameter, translating into a physical size of 68 kpc. The HI content of this spiral is not measured: the galaxy was included in a 21-cm line survey (Theureau et al., 2005), but no information is given on this object. We therefore assume that it has features of a large spiral with a baryonic mass of , and of HI gas, comfortably larger than the masses derived for the X-ray gas (cf. Sect. 3).
The conditions for stripping a large amount of gas are favourable. Using the Gunn & Gott (1972) criterion supplemented by a relation for the stellar surface density with rotational velocity, (Binney & Tremaine, 1987), we obtain (see Vollmer et al., 2001) for the ram pressure, :
| (1) |
where , , and are the mean ICM density, the velocity of the galaxy relative to the ICM, the surface density of the galaxy’s ISM, and the minimum stripping radius of the galaxy (all material at will be bound to the galaxy), respectively. Using observed quantities such as , km s-1, and assuming (for pc, and ), km s-1, we find cm. This means that all the gas down to a radius of 2 kpc will be stripped by the ram pressure, implying that the galaxy would lose more than 99% of its gas, if were constant. Even if we consider outer orbits, where is more than three times lower, or partial replenishment of the ISM from winds and supernovae (at a rate of ) if the galaxy is actively forming stars, we still expect that gas outside of 10 kpc will be stripped.
As the gas streaming behind the bow shock is supersonic with respect to the Hi gas, it should heat up the stripped gas to X-ray temperatures as observed. However, the gas in the tail will have a tendency to be cooler than the ambient ICM if stripping is substantial (cf. Stevens et al., 1999), which is indeed seen in case of the X-ray ridge in the IC1262 group.
The estimated radiative cooling time of the X-ray ridge of yr, and a relative velocity of km s-1 indicate that the X-ray bright tail might be observable over a distance of Mpc. This is comfortably larger than the length of the ridge, and therefore it is likely that the galaxy is for the first time plunging through the centre of the group.
In conclusion, there seems to be circumstantial evidence that the conspicuous X-ray ridge could be the result of ram pressure stripping of a member galaxy that is crossing the centre of the group on a nearly radial orbit, as expected from a late type galaxy (Biviano & Katgert, 2004, and references therein). However, we cannot easily explain the full perturbation with just a trail of the orbital motion of IC 1263, which will require a deeper understanding of the detailed dynamics of the system.
4 Conclusions
Sensitive Chandra and XMM-Newton observations of the IC1262 group have been used to characterize the perturbation at the center of an otherwise extended, regular emission from the hot gas in a seemingly relaxed, massive group of galaxies. The sharp and narrow filamentary structure that runs in a NS direction, east of the central galaxy, plus the loop closer to IC1262, are cooler than the surrounding medium, with steep drops on either side, and discontinuities of in surface brightness. The total length of this apparently coherent structure reaches up to a few hundred kpc. The nature of this complex feature is still elusive, possibly for lack of supporting evidence at different wavelengths, that would highlight for example the dust content, ionized gas distribution and detailed radio morphology of the system. We have considered possible interpretations, in light of similar structures observed and studied in other groups or clusters of galaxies, but all analogies are coupled with significant differences, mostly in the size of the structure also relative to the sources of perturbation, that make the understanding of this system far from exhaustive. Its cooler temperature and the lack of evidence of a significant bulk motion rule out the possibility that this is a shock front. We have found two possible processes that could explain part of the observed properties and might both be present:
Ram pressure stripping of the bright spiral IC1263, located N of IC1262, is a promising process, and would explain the length of the filament and its temperature. With the current data it is hard to understand whether IC1263 is bound to the group or is a newcomer. In the former case, the galaxy is most likely on a radial orbit, possibly approaching the central dense core, where stripping is more efficient (see also Pryor & Geller, 1984), for the first time.
A radio source is likely to significantly affect and modify the morphology and characteristics of the hot ambient gas. Although the current data are of limited quality, they indicate a low luminosity radio source, that cannot compete in strength with the more spectacular examples in the literature. Nonetheless, we cannot discard the possibility that the source was more powerful in the past, and that the current perturbation is but a relic of a since faded outburst. A more thorough investigation of the radio properties of this system, with deeper and higher resolution observations, are needed to investigate this matter further.
Acknowledgements.
This research has made use of SAOImage DS9, developed by Smithsonian Astrophysical Observatory and of the NASA/IPAC Extragalactic Database (NED) which is operated by the Jet Propulsion Laboratory, California Institute of Technology, under contract with the National Aeronautics and Space Administration. GT thanks the Max-Planck-Institut für extraterrestrische Physik for the kind hospitality and the stimulating environment during the paper preparation. GT and AW acknowledge partial financial support from the Agenzia Spaziale Italiana under contract ASI-INAF I/023/05/0.References
- Andreon et al. (2006) Andreon, S., Quintana, H., Tajer, M., Galaz, G., & Surdej, J. 2006, MNRAS, 365, 915
- Beers et al. (1990) Beers, T. C., Flynn, K., Gebhardt, K. 1990 AJ100, 32B
- Becker et al. (1995) Becker, Robert H., White, Richard L., Helfand, David J. 1995 ApJ, 450, 559
- Bialek et al. (2002) Bialek, J. J., Evrard, A. E., & Mohr, J. J. 2002, ApJ, 578, L9
- Binney & Tremaine (1987) Binney, J., & Tremaine, S. 1987, Princeton, NJ, Princeton University Press, 1987, 747 p.
- Birkinshaw & Davies (1985) Birkinshaw, M. & Davies R.L. 1985 ApJ 291 32
- Biviano & Katgert (2004) Biviano, A. & Katgert., P. 2004 A&A 424 779
- Blanton et al. (2001) Blanton, E. L., Sarazin, C. L., McNamara, B. 2003 ApJ 585 227
- Condon et al. (1998) Condon, J. J., Cotton, W. D., Greisen, E. W., Yin, Q. F., Perley, R. A., Taylor, G. B., & Broderick, J. J. 1998, AJ, 115, 1693.
- Crawford et al. (2005) Crawford et al. 2005 Crawford, C. S., Sanders, J. S., Fabian, A. C. 2005 MNRAS, 361 17
- Fabian et al. (2000) Fabian, A. C., et al. 2000, MNRAS, 318, L65
- Fabian et al. (2006) Fabian, A. C., Sanders, J. S., Taylor, G. B., Allen, S. W., Crawford, C. S., Johnstone, R. M., Iwasawa, K. 2006 MNRAS 366 417
- Gunn & Gott (1972) Gunn, J.E., Gott, J.R. 1972, ApJ 176, 1
- Heinz et al. (1998) Heinz, S., Reynolds, C. S., Begelman, M.C. 1998 ApJ 501 126
- Heinz et al. (2002) Heinz, S., Choi, Y-Y., Reynolds, C. S., Begelman, M. C. 2002, ApJ, 569, 79
- Heinz et al. (2003) Heinz, S., Churazov, E., Forman, W., Jones, C., Briel, U. G. 2003 MNRAS, 346 13
- Helsdon & Ponman (2000) Helsdon S.F. & Ponman, T.J. 2000 MNRAS 315 356
- Huang & Sarazin (1998) Huang, Zhenping, Sarazin, Craig L. 1998 ApJ 496 728
- Hudson & Henriksen (2003) Hudson, D. S., Henriksen, M. J. 2003 ApJ 595 1
- Hudson et al. (2003) Hudson, D. S., Henriksen, M. J. & Colafrancesco, S., 2003 ApJ 583, 706
- Jansen et al. (2001) Jansen, F., et al. 2001, A&A, 365, L1
- Jones et al. (2002) Jones, C., Forman, W., Vikhlinin, A., Markevitch, M., David, L., Warmflash, A., Murray, S., Nulsen, P. E. J. 2002 ApJ 567 115
- Markevitch et al. (2000) Markevitch, M., Ponman, T. J., Nulsen, P. E. J., et al. 2000 ApJ 541 542
- Markevitch et al. (2002) Markevitch, M., Gonzalez, A. H., David, L., Vikhlinin, A., Murray, S., Forman, W., Jones, C., Tucker, W. 2002 ApJ 567 27
- Markevitch et al. (2003) Markevitch, M., Bautz, M. W., Biller, B. et al. 2003 ApJ 583 70
- Mathis et al. (2005) Mathis, H., Lavaux, G., Diego, J. M., Silk, J. 2005 MNRAS 357 801
- Mazzotta et al. (2002) Mazzotta, P., Fusco-Femiano, R., & Vikhlinin, A. 2002, ApJ, 569, L31
- McNamara et al. (2000) McNamara, B. R., Wise, M., Nulsen, P. E. J., et al. 2000 ApJ 534 135
- McNamara (2001) McNamara, B. R., Wise, M. W., Nulsen, P. E. J. et al 2001 ApJ 562 149
- Mulchaey (2000) Mulchaey, J.S. 2000 ARA&A 38 289
- Mulchaey & Zabludoff (1998) Mulchaey, J.S. & Zabludoff, A.I. 1998, ApJ 496, 73
- Mulchaey et al. (2003) Mulchaey, J. S., Davis, D. S., Mushotzky, R. F., & Burstein, D. 2003, ApJS, 145, 39
- Nagai & Kravtsov (2003) Nagai D. & Kravtsov, A. 2003 ApJ 587 514
- Osmond & Ponman (2004) Osmond, J.P.F. & Ponman, T.J. 2004 2004 MNRAS, 350, 1511O
- O’Sullivan et al. (2005) O’Sullivan E., Vrtilek, J. M., Kempner, J. C. 2005 ApJ 624 77
- Pryor & Geller (1984) Pryor, C., & Geller, M. J. 1984, ApJ, 278, 457
- Rengelink et al. (1997) Rengelink R.B., et al., 1997, A&A 124, 259
- Schindler & Prieto (1997) Schindler, S. & Prieto, M.A. 1997 A&A 327 37
- Smith et al. (2004) Smith, R. J., et al. 2004, AJ, 128, 1558
- Stanger & Warwick (1986) Stanger, V. & Warwick, R.S. 1986 MNRAS 220, 363
- Stevens et al. (1999) Stevens, I.R., Acreman, D.M., Ponman, T.J. 1999, MNRAS 310, 663
- Strüder et al. (2001) Strüder, L., et al. 2001, A&A, 365, L18
- Sun et al. (2006) Sun, M., Jones, C., Forman, W., Nulsen, P. E. J., Donahue, M., Voit, G. M. 2006 ApJ 637 81
- Theureau et al. (2005) Theureau, G., et al. 2005, A&A, 430, 373
- Trinchieri (2004) Trinchieri, G. 2004, Ap&SS, 289, 367
- Trinchieri & Saporiti (2004) Trinchieri, G., & Saporiti, C. 2004, The Riddle of Cooling Flows in Galaxies and Clusters of galaxies, 107
- Trinchieri & Pietsch (2000) Trinchieri, G. & Pietsch, W. 2000, A&A 353, 487
- Trinchieri et al. (2003) Trinchieri, G., Sulentic, J., Breitschwerdt, D., & Pietsch, W. 2003, A&A, 401, 173
- Trinchieri et al. (2005) Trinchieri, G. and Sulentic, J. and Pietsch, W. and Breitschwerdt, D. , 2005 A&A, 444, 697
- Turner et al. (2001) Turner, M. J. L., et al. 2001, A&A, 365, L27
- Vikhlinin et al. (2001) Vikhlinin, A., Markevitch, M., & Murray, S. S. 2001, ApJ, 551, 160
- Vollmer et al. (2001) Vollmer, B., Cayatte, V., Balkowski, C., Duschl, W.J. 2001, ApJ 5 61, 708
- Weisskopf et al. (2000) Weisskopf, M. C., Tananbaum, H. D., Van Speybroeck, L. P., & O’Dell, S. L. 2000, Proc. SPIE, 4012, 2
- Wilms et al. (2000) Wilms, J., Allen, A., & McCray, R. 2000, ApJ, 542, 914
- Wilson et al. (2006) Wilson, A.S., Smith, D.A. & Young, A. J. 2006, ApJL 644, L9