IRAS 13197–1627 has them all: Compton–thin absorption, photo–ionized gas, thermal plasmas, and a broad Fe line
Abstract
We report results from the XMM–Newton observation of IRAS 13197–1627, a luminous IR galaxy with a Seyfert 1.8 nucleus. The hard X–ray spectrum is steep () and is absorbed by Compton–thin (N cm-2) neutral gas. We detect an Fe K emission line at 6.4 keV, consistent with transmission through the absorber. The most striking result of our spectral analysis is the detection of a dominant X–ray reflection component and broad Fe line from the inner accretion disc. The reflection–dominated hard X–ray spectrum is confirmed by the strong Compton hump seen in a previous BeppoSAX observation and could be the sign that most of the primary X–rays are radiated from a compact corona (or base of the jet) within a few gravitational radii from the black hole. We also detect a relatively strong absorption line at 6.81 keV which, if interpreted as Fexxv resonant absorption intrinsic to the source, implies an outflow with velocity km s-1. In the soft energy band, the high–resolution RGS and the CCD–resolution data show the presence of both photo–ionized gas and thermal plasma emission, the latter being most likely associated with a recent starburst of 15–20 yr-1.
keywords:
galaxies: active – X-rays: galaxies – X-rays – galaxies: individual: IRAS 13197–1627 – galaxies: individual: MCG–03-34-641 Introduction
IRAS 13197–1627 (also MCG–03-34-064, z=0.01654) is a “warm” () and luminous IR–galaxy with LIR=L(8–1000 )= (Sanders et al. 2003). It was first classified as a moderately reddened Seyfert 2 by Osterbrock and de Robertis (1985) & de Robertis, Hutchings & Pitts (1998). However, as pointed out by these authors, the source has peculiar emission–line properties: in particular its H, [OI], [NII], and [SII] are both exceptionally broad for Seyfert 2s (with FWHMs from 480 km s-1 to 860 km s-1) and asymmetric, with excess flux blue–wards of their centres. In the UV, most of the lines are broad at the level seen in the Optical, and CIV as a width comparable to those typically measured in Seyfert 1 galaxies. Aguero et al (1994) were able to disentangle broad and narrow components of the H and H lines which led to a Seyfert 1.8 classification. A broad component to H was also detected by Young et al (1996) in polarised light. Signatures of the presence of Wolf–Rayet stars have been reported by Cid Fernandes et al (2004) who also estimate that about 25 per cent of the stellar population is relatively young (less than 25 Myr). Extended Radio emission is also detected with a linear extension of about 280 pc, almost aligned with the host galaxy major axis (Schmitt et al. 2001a; 2001b) while the 1.4 GHz luminosity is erg s-1 Hz-1 (Condon et al. 1996).
In the X–rays, the source was first observed with ASCA in 1995 revealing a very steep spectral shape (photon index ), a large absorbing column density cm-2, a narrow Fe emission line at 6.4 keV, and a “soft excess” component emerging below about 2 keV (Ueno 1997). A BeppoSAX observation was obtained in 1998 and was first published by Risaliti (2002) in a statistical study of 20 bright Seyfert 2 galaxies. A variation in the absorbing column density between the ASCA and the BeppoSAX observations was later suggested by Risaliti, Elvis & Nicastro (2002). A more detailed analysis of the BeppoSAX data was presented by Dadina & Cappi (2004). The absorbing column was found to be dependent on the adopted spectral model so that the column density variation could not be confirmed (we shall discuss this point in our analysis below). The better quality, broadband BeppoSAX data also revealed spectral complexity that could be modelled in terms of a partial covering scenario or of a reflection–dominated model in which X–ray reflection from the accretion disc dominates the hard spectral shape. In both cases, Dadina & Cappi estimated an intrinsic 2–10 keV luminosity of erg s-1, making IRAS 13197–1627 the nearest and brightest type–1.8 quasar known to date. An absorption line at keV was also detected and, if interpreted as He–like Fe resonant absorption, the line energy implies an outflow with a velocity of the order of 0.1 c.
Here we report on results from a new XMM–Newton observation of IRAS 13197–1627 and we present detailed spectral analysis at both CCD and gratings resolution allowing us to better understand the nature of the hard and soft X–ray emission components in this luminous IR galaxy.
2 The XMM–Newton observation and first–look analysis
IRAS 13197–1627 was observed by XMM–Newton on 2005 January 24 for a total exposure of 45 ks. The data have been processed starting from the ODF files with the XMM–Newton SAS software (version 6.5.0). Source spectra and light curves of the EPIC cameras were extracted from circular regions centred on the source, while background products were extracted from off–set regions close to the source. We remind here that the background region of the pn camera has to be taken as close to the centre as possible to avoid contamination from the strong spatially dependent fluorescent Cu K emission line originating from the electronics board mounted below the pn CCD which would result in a spurious absorption line around 8 keV in the (background subtracted) source spectrum. With our choice of the background extraction region, such contamination is negligible. After filtering for periods of high background the net exposure is 37 ks in the pn camera and 39 ks (43 ks) in the MOS 1 (MOS 2) detectors. The EPIC spectra were grouped to have at least 20 counts per bin to ensure the validity of statistical analysis. The RGS were operated in the standard spectroscopy mode and standard data reduction was performed resulting in a net exposure of about 43 ks in the RGS detectors.

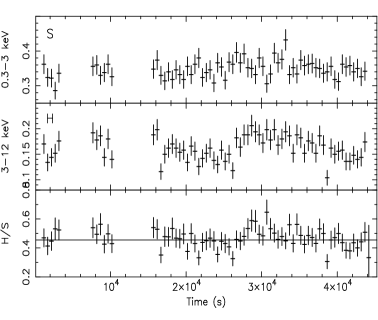
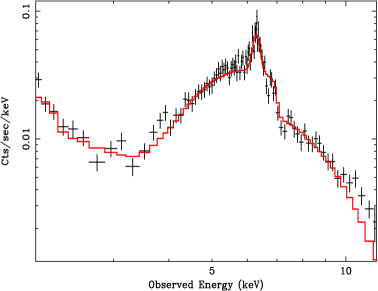
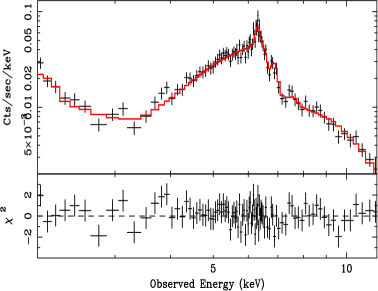
In Fig. 1 we show the background–subtracted source light curve in a soft (S: 0.3–3 keV) and a hard (H: 3–12 keV) energy band after removal of residual background flares. No strong variability is seen in the soft band and a fit with a constant is very satisfactory ( for 67 dof). More fluctuations are present in the hard band (). In the bottom panel, we plot the hardness ratio and compare it with the best–fitting constant value producing an acceptable fit with . Given the limited evidence for spectral variability, in the following we consider the time–averaged spectrum of the source only. The broadband EPIC–pn spectrum of IRAS 13197–1627 is shown in Fig. 2. The MOS data are not shown for visual clarity and agree very well with the pn. The main features of the spectrum are i) strong curvature in the hard band with a 3–4 keV low–energy cut–off and a deep spectral drop around 7 keV where the Fe absorption edge is expected; ii) a clear narrow Fe emission feature at 6.4 keV (vertical dotted line in Fig. 2); iii) a soft excess emerging below 2–3 keV which seems structured rather than smooth, especially around 0.9–1 keV. In this paper we adopt standard cosmology parameters ( km s-1, , and ).
3 The 2–12 keV spectrum of IRAS 13197–1627
In our analysis, we consider joint fits to the EPIC–pn and MOS (1 and 2) cameras. The pn data are considered up to 12 keV, while for the MOS we limit our analysis up to 9.5 keV due to the lack of signal–to–noise above that energy. As a first attempt to describe the hard spectrum above 2 keV, we consider a simple model in which a power law is absorbed by neutral matter at the redshift of the source (the ZWABS model in XSPEC ). We also include a second power law component emerging at soft energies to account for the soft excess. The two power law slopes ( and respectively) are allowed to be different. The observed Fe line at 6.4 keV is modelled with a Gaussian emission line with width, energy, and normalisation free to vary. All subsequent fits include Galactic absorption with column density fixed at its nominal value ( cm-2, Dickey & Lockman 1990).
With this simple model, we obtain an acceptable fit to the 2–12 keV data with for 447 degrees of freedom (dof). The hard power law has a slope , marginally consistent with the soft one (). The ratio of the soft to the hard power law normalisations is of about 1–2 per cent only. The neutral absorber affects the hard band above 3 keV and is Compton–thin with a column density of cm-2.
The Fe emission line is clearly detected ( for 2 more free parameters) and has an energy of keV indicating an origin in neutral matter. The line has an observed equivalent width (EW) of eV when computed with respect to the unabsorbed continuum, to be compared with the theoretical prediction of 80 eV for a line transmitted through the observed column density (e.g. Matt 2002).
We measure an Fe line width eV, significantly broader than the EPIC cameras spectral resolution (40 eV in ). The measured Fe line width corresponds to a FWHM km/s. Under the assumption that the line emitting gas is gravitationally bound and that gas motion occurs in randomly oriented circular orbits, the line width places the emitting gas within gravitational radii () from the central black hole (Krolik 2001). If the line, as is likely, is transmitted through the Compton–thin absorber, the line width would place the absorber much closer to the nucleus than often thought (e.g. Galactic discs, Maiolino & Rieke 1995; dust lanes, Malkan, Gorijn & Tam 1998; Guainazzi, Matt & Perola 2005; starburst clouds, Weaver 2001; see also Lamastra, Perola & Matt 2006). However, a much closer location of the absorbing gas, consistent with the measured line width, has been proposed by e.g. Elvis (2000; 2004). The case for an absorber located close to the nucleus is particularly compelling in NCG 1365 (Risaliti et al. 2005) in which rapid transitions between Compton–thin and Compton–thick absorption have been observed. On the other hand, as we shall discuss below, the observed Fe line width could be due to an unmodelled broader component to the Fe line profile.
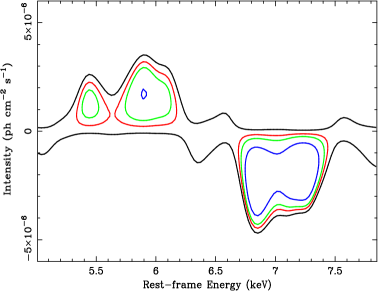
Although our simple spectral model (hereafter the “baseline model”) provides a reasonable description of the hard spectrum, several residuals are present as shown in Fig. 3. Two absorption features are seen around 6.8 keV and 7.1 keV, while positive residuals are left at high energy (above 10 keV) and in the 5–6 keV band where the model seems to systematically underestimate the data. As a first check for the significance of the residuals, we add an unresolved Gaussian line to the baseline model, vary its energy in the 4–8 keV range, its normalisation in the ph cm-1 s-1 range, and record the improvement (see Miniutti & Fabian 2006 for more details). The results are presented in the top panel of Fig. 4 where we show the 68, 90, and 99 per cent confidence contour levels for the additional Gaussian line rest-frame energy and intensity in the most relevant band around the Fe K complex. The outermost line shows the contour as reference.
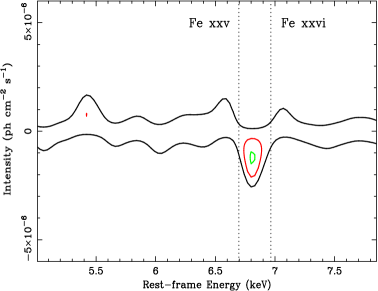
Although the contours should not be taken as a precise significance test, they indicate the relative importance of the residuals. Fig. 4 clearly reveals both positive and negative residuals on the red and blue side respectively of the Fe K line (6.4 keV). If the Fe K emission line in the best–fitting model is forced to be narrow (i.e. unresolved, as in most Compton–thin sources), the bottom panel figure is obtained, where the positive residuals are very reminiscent of X–ray reflection from the accretion disc resulting in a skewed and broad Fe emission line and Fe absorption edge. With the caveats mentioned above, the significance of the whole structure seem to be higher than 99 per cent. A more detailed spectral modelling of these absorption and emission features is presented below.
3.1 X–ray reflection from the accretion disc and Fexxv resonant absorption
| Parameter | Value | F–test |
| Continuum | ||
| [ ph cm-2 s-1] | ||
| [ ph cm-2 s-1] | ||
| Absorption | ||
| [ cm-2] | ||
| Fe abundance | ||
| [solar] | ||
| Transmitted Fe K line | ||
| [keV] | ||
| [eV] | ||
| [eV] | ||
| Disc reflection | ||
| [erg cm s-1] | ||
| [keV] | ||
| [eV] | ||
| [] | ||
| [degrees] | ||
| Fexxv absorption line | ||
| [keV] | ||
| [eV] | ||
| Flux and Luminosity | ||
| [ erg cm-2 s-1] | ||
| [ erg s-1] | ||
| [ erg s-1] | ||
The EW of the Fe K emission line is computed with respect to the unabsorbed continuum assuming it is transmitted and not absorbed. If the line is assumed to be absorbed by the same column as the continuum its EW is eV. The F–test results are obtained by removing the relevant component from the model and by re–fitting the data. The F–test corresponding to in the Disc reflection section is relative to the relativistic blurring kernel, i.e. it provides the significance of the relativistic effects.
The shape of the residuals in Fig. 4 strongly suggests that both the positive and negative residuals could be accounted for by a reflection component from the accretion disc. We then add a relativistically blurred reflection spectrum in which reflection continuum and emission lines are computed self–consistently (from Ross & Fabian 2005). The model free parameters are the ionization parameter , the illuminating power law slope, the normalisation, and the Fe abundance. To test whether the Fe abundance is different from solar, we let it free to vary, replace the Compton–thin absorber model with one which allows to vary the Fe abundance (ZVFEABS) and forced the Fe abundance in the two models to be the same. The illuminating power law slope is forced to have the same photon index as the hard power law continuum. The relativistic blurring is obtained by using a LAOR kernel in which the emissivity profile is fixed at its standard value (), the outer disc radius at , while the inner disc radius and observer inclination are free parameters. The reflection spectrum is absorbed by the same column density as the continuum.
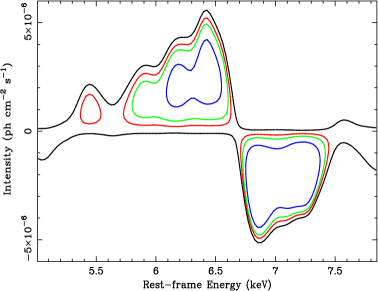
We obtain a very significant improvement with respect to the previous model, with for 5 more free parameters ( for 442 dof). Since the reflection model does not include emission from Ni (see Ross & Fabian 2005), we add a Gaussian emission line with energy between 7.4 keV and 7.6 keV and apply to it the same relativistic blurring as for the reflection spectrum. We obtain a marginal improvement of for 2 more free parameters. Before discussing the best–fit parameters, we consider again the procedure used to produce Fig. 4 on this best–fitting model to search for any other possible residual (see Fig. 5). The X–ray reflection from the disc accounted for all positive and negative residuals (compare Fig. 5 with Fig. 4) except what appears to be an absorption line at 6.8 keV whose significance can be roughly estimated to be between 90 and 99 per cent.
We then add a further narrow Gaussian absorption line to our spectral model and find a marginal improvement of for 2 more free parameters (98.1 per cent significance level according to the F–test) for a line energy of keV with equivalent width of eV and a final statistics of for 438 dof. The absorption line energy suggests an origin in resonant absorption due to Fexxv or Fexxvi (see e.g. Bianchi et al. 2005b) but is inconsistent with the expected rest–frame energies (weighted mean of 6.697 keV and 6.966 keV respectively). If Fexxv is assumed, the line energy indicates an outflow velocity of km s-1. It should be stressed that the inferred outflow velocity is remarkably similar to the systemic velocity of the galaxy. IRAS 13197–1627 is at redshift z=0.016541 which corresponds to a receding velocity of 4959 km s-1. Such a coincidence raises the possibility that the line has a local origin (i.e. Galactic) as it was recently suggested by McKernan, Yaqoob & Reynolds (2004; 2005) for the cases of extreme relativistic outflows inferred from X–ray spectroscopy in several AGNs (see e.g. Pounds et al 2003; Reeves, O’Brien, & Ward 2003).
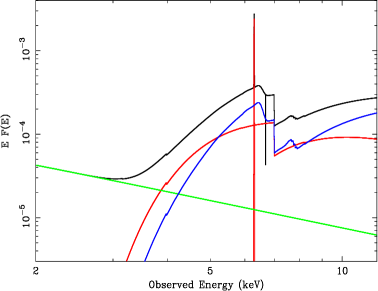
The data, residuals, and best–fitting model are shown in the two panels of Fig. 6. We include the Ni emission line from the disc and the 6.8 keV absorption line in the final model, but we stress again that they are respectively detected at about the 95 and 98 per cent level only. The best–fitting parameters are reported in Table 1 where we also compute the F–test significance for the most important spectral components obtained by re–fitting the data after having excluded the relevant component. In the case of the disc reflection component, the F–test is computed for the overall blurred reflection (), for the addition of the Ni emission line (), and for the relativistic blurring only () separately.
The most important result is that we infer a very strong (and nearly neutral) reflection component from the accretion disc which dominates the hard spectrum. Notice also that the transmitted Fe line width is now only an upper limit, consistent with an absorber far away from the nucleus. The transmitted Fe line equivalent width is also slightly reduced because of the broad Fe line associated with the disc reflection component. Part of the hard curvature is now due to the disc reflection component which results in a slightly smaller column density of the absorber. As for the disc parameters, the inner disc radius is consistent with both a spinning and a non–spinning black hole, while the inclination is relatively poorly constrained.
The large value of the reflection fraction (where and is the solid angle subtended by the reflector) is unusual and the resulting reflection–dominated spectrum has consequences on luminosity estimates of the nuclear emission. If the spectrum is indeed reflection–dominated, the intrinsic AGN luminosity is much higher than the observed one. For this reason, in Table 1 we report two different measures of the 2–10 keV luminosity, with two different meanings. The first one is the absorption–corrected observed luminosity (), while the second is the estimated intrinsic luminosity of the AGN (): this is the absorption–corrected luminosity of the direct AGN emission (the hard power law continuum) multiplied by the reflection fraction i.e. the observed AGN luminosity plus the luminosity needed to produce the reflection spectrum we observe. It is clearly a model–dependent, but in our opinion meaningful, estimate.
3.2 A partial covering alternative
In their analysis of the previous BeppoSAX observation, Dadina & Cappi (2004) pointed out that, besides the Compton–thin absorber, the BeppoSAX hard spectrum could be described either in terms of a strong and dominant X–ray reflection component from the disc or in terms of a partial covering model. Their partial–covering solution was an attempt to describe the 5–6 keV and 10 keV positive residuals seen in Fig 4 (and visible in the BeppoSAX data as well) with the curvature produced by a high–column ( cm-2) absorber. Motivated by their study, we also considered a similar model and allowed the Fe abundance of the Compton–thin absorber and of the partial coverer to vary, but forcing it of course to be the same. We also include the 6.8 keV absorption line. However, the partial covering best–fit is statistically worse than our best–fit model with for 442 dof (to be compared with for 438 dof). The partial–coverer has cm-2 and a covering fraction of about 97 per cent, while the Compton–thin absorber parameters are consistent with those reported in Table 1. The partial coverer accounts for the residuals above 10 keV (see Fig. 3) but not for the positive residuals in the 5–6 keV band and the absorption structure around 7 keV is only poorly modelled (see Fig. 4). Therefore, we do not consider the partial covering model any further.
4 The previous ASCA and BeppoSAX observations
IRAS 13197–1627 has been observed twice previously in X–rays, in July 1995 by ASCA in the 0.5–10 keV band for 37 ks (Ueno 1997), and in July 1998 by BeppoSAX in the 0.5–100 keV band for 44 ks, reduced to 20 ks above 10 keV (Risaliti 2002; Dadina & Cappi 2004). The ASCA data were retrieved from the Tartarus database and the event files were processed as standard and verified to give consistent results with the products obtained by Tartarus team. We used data from the SIS 0 and 1 and from the GIS 2 and 3 detectors and performed joint fit to the X–ray spectra in the 2–10 keV band. The BeppoSAX data were retrieved from the BeppoSAX Science Data Centre and event files were processed as standard. The final MECS and PDS spectra were found to be in excellent agreement with those from the automated pipeline (available on–line).
4.1 Confirming the reflection–dominated spectrum with BeppoSAX
Besides the broad Fe line and edge, the X–ray reflection model predicts the presence of a strong Compton hump around 20–30 keV. The previous BeppoSAX observation can thus be used to confirm the detection of the Compton hump in the high–energy PDS detector. We first apply to the 2–80 keV BeppoSAX data our baseline model (no disc reflection). As already reported by Dadina & Cappi (2004) an absorption line is tentatively detected at keV, while none is seen at 6.8 keV. If related to resonant absorption from Fexxv (Fexxvi), the energy of the line implies an outflow of at least 27000 (13000) km s-1. We confirm their result and add that the line is detected only marginally (at the 98 per cent level) but if true, its presence could indicate that an outflow with variable velocity on long timescales is indeed present in IRAS 13197–1627.
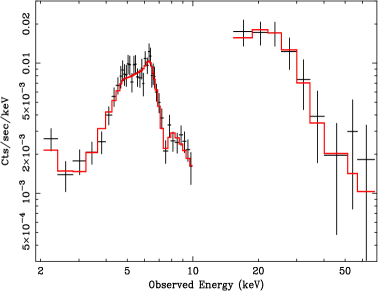
The BeppoSAX data and baseline (plus absorption line) best–fitting model are shown in the top panel of Fig. 7. The fit is acceptable ( for 69 dof), but clear residuals are left around 20–30 keV, where reflection is expected to dominate. We thus consider our XMM–Newton best–fitting model comprising the X–ray reflection component from the disc. Given the poorer quality of the data, we fix the Fe abundance, inner disc radius, inclination and Ni emission line energy to the best–fitting XMM–Newton values and fit the BeppoSAX data with the other parameters free to vary. The result is shown in the bottom panel of Fig. 7 and shows that the X–ray reflection component is required by the PDS data. We obtain a final fit of for 66 dof, significantly better than the baseline model one. BeppoSAX measures a reflection fraction of , consistent with the XMM–Newton one ().
| Parameter. | ASCA | BeppoSAX | XMM–Newton |
|---|---|---|---|
| (1995) | (1998) | (2005) | |
| Best Fit | 156/150 | 52/66 | 442/438 |
| Baseline | 165/153 | 76/69 | 505/445 |
The column density of the absorber () is in units of cm-2 and the Fe line energy () is in keV. The Fe line normalisation () is in units of ph cm-2 s-1. The continuum and reflection fluxes ( and ) are unabsorbed and given in the 2–10 keV band in units of erg cm-2 s-1.
4.2 Long–term spectral variability
We have studied the long–term spectral variability of IRAS 13197–1627 by using the three available X–ray observations with the goal of determining i) changes in the continuum slope, column density of the absorber, and narrow Fe line flux, and ii) variability of the two main spectral components, namely the continuum power law and the disc reflection. We mention here that, based on literature results from ASCA (Ueno 1997) and on the Risaliti (2002) analysis of the BeppoSAX data, Risaliti, Elvis & Nicastro (2002) have pointed out that a long–term variability in the absorbing column density could be claimed in IRAS 13197–1627, which would be consistent with a clumpy absorbing medium close to the central engine.
We applied our best–fit model to the ASCA spectrum as well and our results are reported in Table 2 for the three observations. The source observed (i.e. absorbed) 2–10 keV flux was low during the XMM–Newton observation ( erg cm-2 s-1), about a factor 2 higher during the BeppoSAX one ( erg cm-2 s-1), and intermediate during the ASCA pointing ( erg cm-2 s-1). Table 2 shows that the hard power law photon index, the column density of the Compton–thin absorber, and the transmitted Fe line normalisation are all consistent with being the same in the three observations. We conclude that the data collected so far are consistent with the flux variability occurring at constant spectral slope and absorption, meaning that we have no observational evidence to support the conclusion that the absorber is located relatively close to the central engine (although we cannot exclude it).
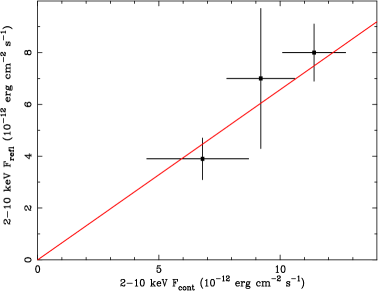
As for the variability of the continuum and reflection components, we find that they are consistent with being correlated. This is shown in Fig. 8 where the 2–10 keV flux of the reflection component is plotted against the 2–10 keV flux of the continuum (both unabsorbed). The origin of the reflection–dominated spectrum and of its variability are discussed below
5 Origin of the reflection–dominated spectrum
The most remarkable result of our analysis is the presence of a dominant reflection component from the accretion disc with a reflection fraction of . In other words, the hard X–ray spectrum of IRAS 13197–1627 is largely reflection–dominated. Since reflection comes from the inner accretion disc, and since most of the accretion power has to be radiated from there (or in a corona above it), it is very difficult to imagine a situation in which the spectrum is reflection–dominated because absorption covers the direct continuum X–ray source and not the inner disc. We tried anyway a spectral model in which the hard power law and the reflection component are absorbed by different column densities to check whether this could help explaining the large reflection fraction. However, we did not find any statistical improvement and, more importantly, the two column densities turned out to be consistent with each other and with the value reported in Table 1.
One possibility is that the large observed reflection fraction is due to strong gravity effects. If the primary emitting source of X–rays is located only a few from the black hole, light bending focus the continuum towards the accretion disc (and black hole) dramatically reducing the primary continuum at infinity and enhancing the reflection fraction up to the very large observed values (see the light bending model proposed by Miniutti et al. 2003; Miniutti & Fabian 2004; see also Fabian et al 2005; Ponti et al 2006; Miniutti et al 2006 for recent applications). As for the variability, the model was devised to reproduce large continuum variation with no or little reflection variability (as observed e.g. in MCG–6-30-15, see Fabian & Vaughan 2003; Miniutti et al 2006). The model successfully reproduces this behaviour for sources with between and (such as MCG–6-30-15), while it predicts a correlated variability for reflection–dominated sources with . Thus, in the present case, the continuum/reflection correlated variability (see Fig. 8) is consistent with the model (since ). However, a correlation between disc reflection and continuum is expected in any simple disc reflection model and is not specific of the light bending one. The main advantage of the model is that the large reflection fraction is naturally explained.
As recently pointed out by Merloni et al. (2006), reflection–dominated spectra could also be produced from discs which are subject to instabilities making both density and heating rate in the inner disc inhomogeneous. If the clouds generated by the inhomogeneous flow have high effective optical depth, steep spectra () emerge and they are associated with a dominant reflection component, in good agreement with our analysis. It is a natural consequence of this model that some of the inner–disc clouds responsible for the X–ray reflection would be seen in absorption with a range of column densities (say cm-2). Given the location of the clouds (few innermost ) short–timescale variability in absorption has to be expected and could be used to disentangle between the two models in future longer observations. At the present time, we have no evidence for absorption variability (notice that the Compton–thin absorber we detect has nothing to do with this scenario since the transmitted Fe line is too narrow to be produced in the inner–disc).
6 The rich soft X–ray spectrum
Since the source primary emission is relatively heavily obscured by a cm-2 column density, the AGN emission does not contribute directly in the soft band. This is typical of Seyfert 2 galaxies in which the soft emission is mainly due to a blend of emission lines for He–like and H–like K transitions of light elements and L transitions of Fe (e.g. Kinkhabwala et al. 2002; Bianchi et al. 2005a). The emission lines are most likely from gas photo–ionized by the AGN and located on large scales (possibly coincident with the Narrow–Line region, see e.g. Bianchi, Guainazzi & Chiaberge 2006) and/or collisionally ionized plasmas (e.g. associated with star–forming regions or gas shocked by a jet). In both cases a residual weak continuum due to electron–scattering of the primary AGN radiation by extended gas or to part of the nuclear emission leaking through the absorber can be present. We first concentrate on the high–resolution RGS spectrum and search for signatures of emission lines related to photo–ionized gas and/or thermal plasmas emission.
6.1 The high–resolution RGS data
6.1.1 Photo–Ionized plasma
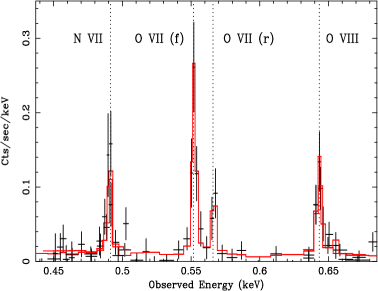
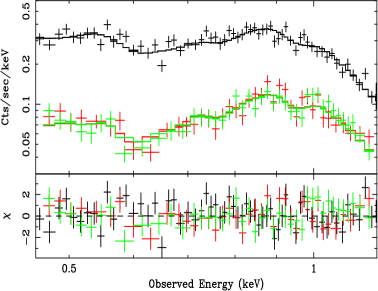
The first order 0.45–0.7 keV RGS spectrum is shown in the top panel of Fig. 9 where clear K emission lines from N vii, O vii, and O viii are seen (the O vii line is actually a He–like multiplet comprising forbidden, intercombination, and resonance lines). In all subsequent fits, a phenomenological power law continuum absorbed by the Galactic column density is considered and its properties will be discussed in detail in the subsequent sections.
We detect K emission lines from N vii at keV and O viii at keV, while the O viii k line is only an upper limit. As for the O vii He–like multiplet, we clearly detect a strong forbidden (f) line at keV and a fainter resonance (r) one at keV. All observed energies are consistent with the rest–frame theoretical energies and are reported together with the corresponding fluxes in Table 2. The O vii forbidden/resonance flux ratio is . The dominance of the O vii forbidden line relative to the resonance is generally taken as a signature of emission predominantly from photo–ionized rather than collisional plasmas (e.g. Porquet & Dubau 2000 and references therein) and we conclude that such a component is indeed present in the soft X–ray spectrum of IRAS 13197–1627. We also modelled the data with the photo–ionized emission code XSTAR and find a good fit ( for 46 dof) with a column density of cm-2 and ionization erg cm s-1 (both loosely constrained). The power law continuum is (although marginally) required by the data at the 96 per cent level (F–test), but its slope and normalisation are largely unconstrained because most of the RGS photons are in the emission lines rather than in the continuum. The issue will be re–examined when the soft EPIC spectrum is discussed below.
6.1.2 Collisionally–ionized plasma emission?
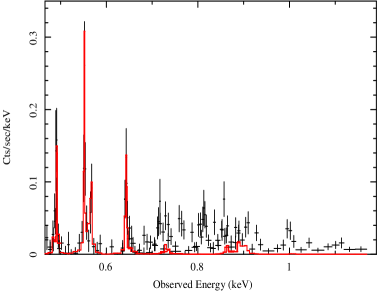
When higher energy data up to 1.2 keV are considered, large residuals are seen and several additional emission lines are required above 0.7 keV (see Fig. 9, bottom). Re–fitting the XSTAR model discussed above in the 0.45–1.2 keV band produces an unacceptable fit with for 127 dof. We then add further Gaussian emission lines as required in order to account for the residuals seen above 0.7 keV. The lines we detect are reported in Table 2 together with their most likely identification and with the properties of the power law continuum (see caption). We clearly detect Ne ix and Ne x K lines and a plethora of other emission features from Fe L. The Fe L emission complex (mostly from Fe xvi and Fe xvii) is generally interpreted as a sign of collisionally–ionized plasma emission. However, as pointed out e.g. by Kinkhabwala et al. 2002 (and many others) ambiguities between photo–ionized gas and thermal plasma emission are difficult to disentangle. One possibility is represented by the detection of radiative recombination continua (RRC) or higher order series transitions for O vii () which would rule out a very strong contribution from a thermal plasma (e.g. Kinkhabwala et al. 2002). In the present case, however, the statistics in the RGS is limited and we cannot easily disentangle between the two possibilities. In the following we present a possible solution in terms of photo–ionized plus collisionally–ionized emission, but firm conclusions must await better quality high–resolution spectra.
| Eobs(keV) | Fluxa | Likely Id. | Etheo (keV) |
| UL | LL | ||
| N vii K | 0.500 | ||
| O vii K | 0.561 (f) | ||
| O vii K | 0.569 (i); 0.574 (r) | ||
| O viii K | 0.654 | ||
| O vii K | 0.666 | ||
| Fe xvi | 0.727 | ||
| Fe xvi | 0.739 | ||
| Fe xvii | 0.775 | ||
| Fe xvi | 0.826 | ||
| Fe xvii | 0.851 | ||
| Fe xvii | 0.867 | ||
| Ne ix K | 0.905 (f) | ||
| Ne ix K | 0.915 (i); 0.922 (r) | ||
| Ne x K | 1.022 | ||
| Fe xvi | 1.112 | ||
a Fluxes in units of ph cm-2 s-1.
∗ Indicates that the parameter has been fixed.
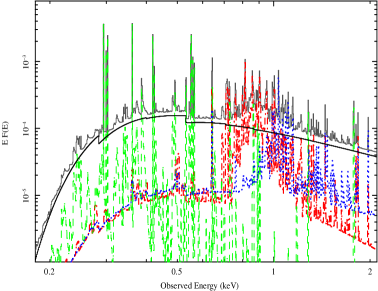
6.1.3 A global model to the RGS data
A good quality global fit to the 0.45–1.2 keV RGS data can be obtained by considering a composite model comprising the X–ray continuum (power law absorbed by the Galactic column), a photo–ionized gas emission component as obtained with the XSTAR code, and a thermal plasma component modelled through the VMEKAL model to account for the Fe L complex. Given that the 2–12 keV spectrum provides indication that Fe is overabundant, we let the Fe abundance in the VMEKAL and XSTAR models free to vary and tied to each other, while all the other elements have fixed solar abundances. We obtain a good global fit ( for 125 degrees of freedom). The higher energy lines (see Fig. 9) are well accounted for by the thermal model and we measure a temperature of keV, while the Fe abundance is times solar. The VMEKAL model improves the fit by for 3 dof with respect to the power law plus XSTAR spectral model. We point out that we were not able to obtain a similar improvement by considering two photo–ionized components with different ionization parameters and column densities suggesting that a non photo–ionized component is indeed required by the data. Some positive residuals are still left around 1 keV and they can be modelled by adding a second higher–temperature thermal component. Its temperature is only poorly constrained in the range of 1.5–4 keV but the additional model improves further the statistics with for 2 more free parameters. According to our best–fitting model extrapolated to 2 keV, the photo–ionized component has a 0.5–2 keV luminosity of erg s-1, while the two thermal components dominate the soft band with a luminosity of erg s-1. The soft power law contribution is much more uncertain ( erg s-1) and will be better constrained with the higher statistics EPIC spectrum as discussed below.
6.2 The CCD–resolution EPIC data
We have applied our best–fit RGS model to the pn and MOS data in the same 0.45–1.2 keV energy band. This allows us to i) check the consistency between the high–resolution and CCD–resolution spectra, and ii) explore whether the soft power law continuum is truly required by the data. We obtain a good description of the EPIC data with a final result of for 233 dof with a two–temperature model with keV and keV plus photo–ionized gas emission. The Fe abundance is measured from the XSTAR and VMEKAL models as times solar which is fully consistent with the Fe overabundance we found modelling the 2–12 keV hard spectrum (see Table 1). However, if the Fe abundance is forced to be solar, the worsening of the statistics is marginal and a super–solar abundance is required at the 95 per cent level only. Finally, the power law continuum is very significantly required by the data: if it is excluded from the model, the statistics is worse by (2 dof). We measure a slope and a normalisation of ph cm-2 s-1. Our results are summarised in Table 4 and remain unchanged in the broadband analysis discussed below. The EPIC spectra, best–fit model and data to model ratio are shown in the top panel of Fig. 10, while the best–fitting model components are shown in the bottom panel.
| Parameter | Value | F–test |
| Continuum | ||
| [ erg s-1] | ||
| VMEKAL 1 | ||
| [keV] | ||
| [ erg s-1] | ||
| VMEKAL 2 | ||
| [keV] | ||
| [ erg s-1] | ||
| XSTAR | ||
| [ cm-2] | ||
| [erg cm s-1] | ||
| [ erg s-1] | ||
| Fe abundance | ||
| [solar] | ||
7 The broadband 0.45–12 keV spectrum
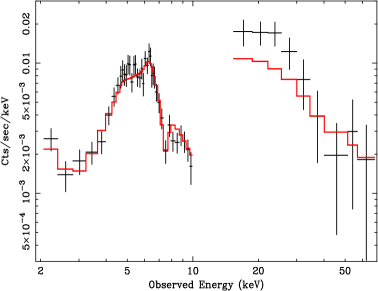
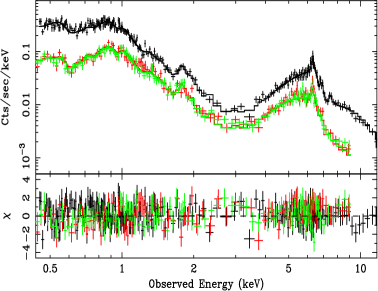
After having analysed the X–ray spectrum of IRAS 13197–1627 by looking separately at the different energy bands and available energy resolutions, the task of describing the broadband EPIC spectrum of the source is greatly simplified. We consider here the best–fit reflection–dominated model to the hard spectrum (Table 1) and add to it the soft model we just discussed above. The Fe abundance in the Compton–thin absorber, the reflection component, the two thermal models, and the photo–ionized gas one is forced to be the same for consistency. We find an excellent description of the broadband 0.45–12 keV EPIC data with for 820 dof. The spectra, best–fit model, and residuals are shown in Fig. 11. The model components are indistinguishable from those shown in the bottom panels of Fig 6 (hard band) and Fig. 10 (soft band).
The best–fitting parameters for the reflection component, relativistic blurring, 6.8 keV absorption line, photo–ionized and collisional plasma emission are consistent with Table 1 (hard band) and with the soft X–rays modelling (Table 4). The Fe abundance is only slightly super–solar ( times solar). By including the hard band however, a super–solar Fe abundance is required at the 97 per cent level (see results in Table 1 and 4 for the hard and soft band respectively). The soft and hard power law slopes are consistent with each other with and , and the soft power law is required at more than the 99.99 per cent level. The hard power law has a normalisation of ph cm-2 s-1, while the soft one has ph cm-2 s-1. It should be stressed that the soft power law contributes by only 36 per cent to the 0.5–2 keV flux, the remaining 64 per cent being due to photo–ionized gas (14 per cent) and thermal plasma emission (50 per cent). The possible origins for the soft power law–like continuum component are i) scattered nuclear continuum e.g. from the same photo–ionized/collisionally–ionized gas seen in emission in the RGS data, or ii) transmitted nuclear continuum (plus reflection) through a partial covering absorber (see e.g. Levenson et al. 2006 and references therein for a discussion). In both cases, we expect less fractional variability in the soft than in the hard band because i) the scattering medium is most likely extended or ii) the transmitted continuum represents 36 per cent only of the soft flux which is dominated by extended emission. In both cases the variability would be washed out in the soft band much more than in the hard, as observed (see Fig 1 and relative discussion). Strictly speaking the first scenario would not allow for any short timescale variability in the soft X–ray band (and none is detected, see Fig. 1).
To explore the second solution, we allow the Compton–thin absorber to be a partial coverer. The soft power law is removed from the spectral model in the attempt of reproducing it with the fraction of nuclear emission (hard power law plus reflection) leaking through the absorber. We find a solution with the same statistical quality as with the soft power law model ( for 820 dof). The absorber has cm-2 and covering fraction per cent. However, we also need a further column of cm-2 (in excess of the Galactic value) covering totally the nucleus. We conclude that the soft X–ray band is dominated by emission lines from both photo–ionized gas and thermal plasmas and that the nature of the remaining 36 per cent continuum cannot be constrained: a power law continuum is statistically equivalent to a 1–2 per cent AGN emission (direct continuum plus reflection) leaking through the absorber.
The observed 0.5–2 keV (2–10 keV) flux is erg cm-2 s-1 ( erg cm-2 s-1). Our best–fitting global model also allows us to compute the absorption–corrected luminosity of the different spectral components (see also Table 1 and 4). The 2–10 keV observed luminosity is erg s-1 only but, if our interpretation of the hard X–ray spectrum is correct, the estimated AGN luminosity in the 2–10 keV band turns out to be erg s-1 (see Table 1 and text). As reported in Table 4, the total 0.5–2 keV luminosity of the two thermal components is erg s-1, while the photo–ionized gas contributes with erg s-1 in the same band. Finally, the soft X–ray continuum (scattered or leaking through the absorber) has a luminosity of erg s-1 in the 0.5–2 keV band.
8 Discussion
IRAS 13197–1627 hosts a Compton–thin AGN in which the primary X–ray nuclear emission is steep () and is absorbed by a column density of cm-2 of neutral gas. A neutral Fe K emission line is also clearly detected at 6.4 keV and is consistent with being transmitted through the absorber which probably has a slightly super–solar Fe abundance. The column density inferred from the X–rays is at odds with previous optical studies. From the work by Aguero et al (1994) we infer E(B-V), while Cid Fernandes et al (2004) measure A (note that the two values do not satisfy the standard conversion factor AV/E(B-V)). As already pointed out by Maiolino et al (2001a; 2001b) E(B-V)/, about two orders of magnitude smaller than the typical Galactic value (). This huge discrepancy is not uncommon in AGNs (Maiolino et al 2001a) and could be explained by the presence of large dust grains in the circum–nuclear region of AGNs (e.g. due to grain coagulation in dense clouds), which results in a featureless extinction curve with reduced E(B-V)/. The large grain/coagulation scenario would also significantly reduce the A ratio, as observed here. Other possibilities include dust sublimation if the X–ray absorber is sufficiently close to the luminous nucleus, the idea that most of the X–ray absorption is due to the same clouds responsible for the broad line region emission, and/or a very low dust–to–gas mass ratio for the absorber. Long and short term variability of the X–ray absorbing column density would favour explanations based on an inner location for the absorber (see e.g. Risaliti et al 2005 and also Lamer, Uttley & McHardy 2003). However, previous ASCA and BeppoSAX observations show that the flux variability most likely occurs at constant spectral slope and absorption.
The XMM–Newton data also reveal the presence (in both pn and MOS detectors) of an absorption line with rest–frame energy of keV, if the redshift of IRAS 13197–1627 is assumed (z=0.01654). The absorption line energy points towards an identification in terms of an Fexxv K line which implies an outflow of km s-1. However, the outflow velocity is consistent within the errors with the systemic receding velocity of the galaxy (4959 km s-1) raising the possibility that the gas responsible for the absorption is instead local to our own Galaxy or its immediate surroundings.
We find that the most satisfactory description of the hard XMM–Newton X–ray spectrum can be obtained by considering an additional reflection component from the accretion disc which dominates the hard band and also accounts for the 15–30 keV Compton hump seen in a previous BeppoSAX observation. The reflection–dominated hard X–ray spectrum could be the sign that strong gravitational effects are at work in IRAS 13197–1627 (see Miniutti & Fabian 2004). Moreover, the disc reflection component is correlated with the long–term continuum variability studied by using also previous ASCA and BeppoSAX data over 10 years. This behaviour is consistent with the light bending model which predicts a good correlation between reflection and continuum only for reflection–dominated sources, as it appears to be the case here but the same prediction holds for any simple reflection model. The main advantage of the light bending one is that the large observed reflection fraction is automatically explained. It is worth mentioning that, if the extreme observed reflection fraction () is due to light bending effects, the variability behaviour and the value of itself imply that the primary AGN power law continuum is produced within 4–5 gravitational radii from the black hole in a compact and centrally concentrated active region (Miniutti & Fabian 2004).
As mentioned by Dadina & Cappi (2004) IRAS 13197–1627 shares a few properties with the class of Narrow Line Seyfert 1 (NLS1) galaxies and could represent their obscured counterpart. Here we also mention that strong disc reflection components are more often seen (or claimed) in NLS1 than in other type of X–ray sources and that the light bending model seems to apply preferentially to NLS1s, thought to be characterised by high mass–accretion rate (e.g. Fabian & Miniutti 2006 for a review). This is not surprising given that disc reflection is expected to occur preferentially in sources accreting in a radiatively efficient manner, likely to be associated with a relatively high accretion rate and with an accretion flow extending down close to central black hole where most of the accretion power is released. The steep hard X–ray spectra of NLS1s (and IRAS 13197–1627) may indeed be an indication of a particularly high accretion rate in this class (e.g. Shemmer et al 2006). As shown in the next Section, a radiatively efficient accretion flow seems to be indeed at work in IRAS 13197–1627. In the optical, narrow plus broad Balmer lines are detected in IRAS 13197–1627 with the broad components having a width of km s-1, slightly wider than the forbidden lines ( km s-1), suggesting a Seyfert 1.8 classification but leaving some room for a NLS1 interpretation (Aguero et al 1994). In this respect it is also very interesting to consider that de Robertis et al (1988) reported a number of low signal–to–noise broad features in the optical spectrum which could be interpreted as Fe ii emission, typical of NLS1 optical spectra.
In the soft band below 2 keV the high–resolution RGS data indicate the presence of emission from photo–ionized gas in the form of N, O, and Ne emission lines as generally seen in absorbed type 2 objects. However, the soft spectrum of IRAS 13197–1627 is more complex and we detect a plethora of emission lines due to a rich Fe L complex from Fexvi and Fexvii, that we interpret as due to thermal plasma emission. Both the RGS and pn data can be described by considering a two–temperature thermal model in which the Fe L emission lines are due to plasmas at keV and keV. A power law–like continuum contributes by about 36 per cent to the soft X–rays and could be due to i) scattering of the nuclear emission in the gas/dust revealed in emission/absorption or to ii) direct (and reflected) nuclear emission leaking through the absorber. The soft X–rays are instead dominated by the thermal components (50 per cent), while the photo–ionized gas emission represents about 14 per cent of the soft flux.
8.1 Bolometric luminosity and Eddington ratio
If the hard X–ray spectrum of IRAS 13197–1627 is indeed dominated by disc reflection, computing the bolometric luminosity of the AGN from the 2–10 keV one is a more difficult and ambiguous task than usual. The bolometric luminosity of AGNs can obviously be computed from the spectral energy distribution and usually compares well with the 8–1000 IR luminosity (). In the present case, erg s-1 (Sanders et al. 2003). However about half of it is likely to be associated with a starburst (see discussion in next Section) and the AGN IR luminosity can be estimated to be erg s-1. is most likely produced by dust which intercepts the AGN emission and re–radiates it in the IR. In our case, what is the X–ray luminosity that will be intercepted by dust and re–radiated in the IR? This is not the estimated AGN X–ray luminosity (, see Table 1 and relative discussion) because most of it is bent towards the inner accretion disc and never escapes the immediate black hole surroundings. What matters here is the (unabsorbed) observed luminosity , i.e. the hard X–ray luminosity that can escape the gravitational sphere of influence of the black hole and makes it to the outermost nuclear regions irradiating the dust responsible for the IR re–emission. Indeed, if one applies standard bolometric corrections (Elvis et al 1994) to (see Table 1), one finds a bolometric luminosity of erg s-1 which is in good agreement with , considering the likely large uncertainties in disentangling the AGN–starburst contribution to (see next section).
However, if our spectral modelling and interpretation of the hard X–ray spectrum are correct, the above estimate of the bolometric luminosity has little to do with the real AGN power. Most of the power is unobservable directly and is inferred because it produces the strong reflection component. This means that is the quantity that represents the X–ray luminosity extracted from the accretion process. Thus, by applying bolometric corrections to , we can infer the “true” (or better the “estimated”) bolometric luminosity of the AGN, i.e. the luminosity that would be observed in absence of strong gravity and light bending effects: for consistency, we shall call this quantity . It turns out that erg s-1. We stress again that this is not the observed bolometric luminosity, but represents instead the luminosity that would be observed f the primary X–ray emission was isotropic and not gravitationally focused away from the observer. Taking our interpretation to the extreme, we then infer that, in absence of light bending effects, IRAS 13197–1627 would be seen as an ultra–luminous IR galaxy with because a much higher AGN luminosity would irradiate the dust responsible for the AGN IR emission.
can also be used to compute the Eddington ratio of IRAS 13197–1627 if the black hole mass can be estimated. To our knowledge there is no black hole mass measurement for IRAS 13197–1627. However, the velocity dispersion is km s-1 (Cid Fernandes et al. 2004) and, by using the MBH– relation (Gebhardt et al. 2000; Ferrarese & Merritt 2000) as derived by Greene & Ho (2006) for local AGN, we estimate a black hole mass of corresponding to an Eddington luminosity L erg s-1. If our interpretation is correct and the AGN power is best estimated through , IRAS 13197–1627 is radiating between 28 and 100 per cent of its Eddington luminosity, although only a fraction of it is actually observed at infinity and re–radiated e.g. in the IR. A high Eddington ratio is consistent with the detection of a broad Fe line which requires the accretion disc to extend down close to the black hole (as likely in high Eddington rate sources), with the steep hard X–ray spectrum which is a possible indicator of high mass–accretion rate (Shemmer et al 2006), and with a NLS1 association (at least from the X–ray point of view). For completeness, we also give the result based on the observed 2–10 keV luminosity which is between 4.5 and 16 per cent of the Eddington luminosity. All estimates given above should be multiplied by about a factor 2 if the highest flux BeppoSAX observation is considered. As already mentioned by Dadina & Cappi (2004), the BeppoSAX data imply a 2–10 keV AGN estimated luminosity of erg s-1, making IRAS 13197–1627 a type 1.8 border–line Seyfert/quasar from the X–ray point of view.
8.2 IRAS 13197–1627: a composite Seyfert/starburst galaxy?
Besides emission from gas photo–ionized by the nucleus and residual/scattered AGN emission, the soft X–ray spectrum is characterised, and even dominated, by the presence of two thermal components which could be the X–ray signature of star–formation. Cid Fernandes et al (2004) estimate that a relatively young ( Myr and possibly Myr) population of stars represent about the 25 per cent of the whole population in IRAS 13197–1627. The authors also point out the detection of the 4680Å bump associated with Wolf–Rayet stars, an additional indication of star–formation activity.
If the soft X–ray thermal component is indeed due to star–formation, its luminosity in the 0.5–2 keV band ( erg s-1) can be used to infer the star–formation rate (SFR) through the relation SFR yr-1 (Ranalli, Comastri & Setti 2003). We do not consider the luminosity of the photo–ionized gas emission and continuum since these are due to AGN emission and we obtain SFR yr-1. However, some contribution from X–ray binaries may be masked in the soft X–ray continuum: we assessed this possibility by forcing a power law to be present in the X–ray spectrum (representing the unresolved high mass X–ray binaries contribution, see e.g. White et al 1983; Persic et al 2004) obtaining an upper limit on any possible additional contribution of yr-1, i.e. SFR yr-1.
On the other hand, IRAS 13197–1627 is a luminous infrared (LIR) galaxy with erg s-1 (Sanders et al. 2003). The IR luminosity is generally considered as a good indicator of the star–formation rate (SFR) in AGN–free galaxies, but the reprocessing of the AGN emission in dust can dominate the IR luminosity. Rowan–Robinson & Crawford (1989) deconvolved the IR spectral energy distribution of IRAS galaxies into a disc, Seyfert, and starburst component finding that a 45 per cent Seyfert and a 54 per cent starburst component reproduce well the data of IRAS 13197–1627 (with only a marginal disc contribution). Although the above numbers are probably affected by large uncertainties, one can estimate a starburst IR luminosity of erg s-1. By assuming this is correct, and by using SFR yr-1 (Kennicutt 1989), we derive SFR yr-1, slightly lower than the SFRX estimate given above.
As mentioned, IRAS 13197–1627 is also a radio source with a Radio luminosity erg s-1 Hz-1 (Condon et al. 1996). Most of the radio emission is probably due to the AGN and, if so, it is not a useful indicator of SFR. At 2.3 GHz, the radio core contribution to the total radio flux is about 15 per cent (Roy et al 1998). However, even accounting for the radio core, IRAS 13197–1627 is still a member of the “radio–excess class” among IRAS galaxies (Yun et al 2001), meaning that its radio luminosity is in excess from that expected from the well known tight radio–IR correlation for normal and starburst galaxies. If we assume that IRAS 13197–1627 would lie on the correlation if the AGN was removed, the fractional AGN contribution in the radio band must be higher than its contribution in the IR. It seams reasonable to assume that the AGN contributes by at least 50 per cent at 1.4 GHz. If so, the AGN–free radio luminosity is erg s-1 Hz-1 and, by applying the relation SFR(e.g. Ranalli et al 2003) we thus obtain SFR yr-1.
Summarising, we obtain SFR yr-1, SFR yr-1, and SFR yr-1. At face value, the X–ray estimate seems to overestimate the SFR obtained from IR and radio. This could be easily explained if a fraction of the thermal emission we detect in the soft X–rays was due to gas shocked by the radio jet and not to star–forming regions. In the prototypical starburst galaxy M82, the plasma is observed to have a multi–temperature distribution around 0.4–0.9 keV (Stevens, Read & Bravo–Guerrero 2003), similar to the lower–temperature component we detect in IRAS 13197–1627. It is thus possible that the high–temperature 1.4 keV component we detect is not associated with the starburst. In this respect, it is interesting to note that if the high–temperature X–ray plasma is associated with gas shocked by the radio jet and is excluded from the SFRX estimate, we obtain SFR, more in line with the IR and radio estimates. A SFR of yr-1 probably represents a reasonable value which can reconcile the multi–wavelength data. The presence of a starburst could be the sign that the nuclear region is gas rich, thus providing a large gas supply for the accreting black hole which is consistent with the high Eddington ratio inferred above.
Acknowledgements
Based on observations obtained with XMM-Newton, an ESA science mission with instruments and contributions directly funded by ESA Member States and NASA. This research has made use of the Tartarus (Version 3.1) database, created by Paul O’Neill and Kirpal Nandra at Imperial College London, and Jane Turner at NASA/GSFC. Tartarus is supported by funding from PPARC, and NASA grants NAG5-7385 and NAG5-7067. G. Miniutti thanks the PPARC for support. GP, MD, MC and G. Malaguti thank ASI financial support under contract I/023/05/0. GP also thanks the European Commission under the Marie Curie Early Stage Research Training Programme for supporting part of this research at the Institute of Astronomy. G. Miniutti. thanks Kazushi Iwasawa, Stefano Bianchi, Andy Fabian and Poshak Gandhi for useful discussions.We also would like to thank the anonymous referee for a very useful report.
References
- Aguero et al. (1994) Aguero E.L., Calderon J.H., Paolantonio S., Suarez–Boedo E., 1994, PASP, 106, 978
- Bianchi et al. (2005) Bianchi S., Miniutti G., Fabian A.C., Iwasawa K., 2005a, MNRAS, 360, 380
- Bianchi et al. (2005) Bianchi S., Matt G., Nicastro F., Porquet D., Dubau J., 2005b, MNRAS, 357, 599
- Bianchi, Guainazzi & Chiaberge (2006) Bianchi S., Guainazzi M., Chiaberge M., 2006, A&A, 448, 499
- Cid Fernandes et al. (2004) Cid Fernandes R., Gu Q., Melnick J., Terlevich E., Terlevich R., Kunth D., Rodrigues Lacerda R., Joguet B., 2004, MNRAS, 355, 273
- Condon et al. (1996) Condon J.J., Helou G., Sanders D.B., Soifer B.T., 1996, ApJS, 103, 81
- Dadina & Cappi (2004) Dadina M., Cappi M., 2004, A&A, 413, 921
- de Robertis, Hutchings & Pitts (1988) de Robertis M.M., Hutchings J.B., Pitts R.E., 1988, AJ, 95, 1371
- Dickey & Lockman (1990) Dickey J.M., Lockman F.J.,1990, ARAA, 28, 215
- Elvis et al (1994) Elvis M. et al, 1994, ApJS, 95, 1
- Elvis (2000) Elvis M., 2000, ApJ, 545, 63
- Elvis et al. (2004) Elvis M., Risaliti G., Nicastro F., Miller J.M., Fiore F., Puccetti S., 2004, ApJ, 615, L25
- Fabian & Vaughan (2003) Fabian A.C., Vaughan S., 2003, MNRAS, 340, L28
- Fabian et al. (2005) Fabian A.C., Miniutti G., Gallo L., Boller Th., Tanaka Y., Vaughan S., Ross R.R., 2005, MNRAS, 353, 1071
- Fabian & Miniutti (2006) Fabian A.C., Miniutti G., 2006, to appear in “Kerr Spacetime: Rotating Black Holes in General Relativity” eds. D.L. Wiltshire, M. Visser and S.M. Scott Cambridge Univ. Press (preprint astro-ph/0507409)
- Ferrarese & Merritt (2000) Ferrarese L., Merritt D. 2000, ApJ, 539, L9
- Gebhardt et al. (2000) Gebhardt K. et al., 2000, ApJ, 539, L13
- Greene & Ho (2006) Greene J.E., Ho L.C., 2006, ApJ, 641, L21
- Guainazzi, Matt & Perola (2005) Guainazzi M., Matt G., Perola G.C., 2005, A&A, 444, 119
- Kennicutt (1998) Kennicutt R.C., 1998, ARA&A, 36, 189
- Kinkhabwala et al. (2002) Kinkhabwala A. et al., 2002, ApJ, 575, 732
- Kinkhabwala et al. (2003) Kinkhabwala A., Behar E., Sako M., Gu M.F., Kahn S.M., Paerels F.B.S., 2003, unpublished (preprint astro-ph/0304332)
- Krolik (2001) Krolik J.H., 2001, ApJ, 551, 72
- Lamastra et al. (2006) Lamastra A., Perola G.C., Matt G., 2006, A&A, 449, 551
- Lamer, Uttley & McHardy (2003) Lamer G., Yttley P., McHardy I.M., 2003, MNRAS, 342, L41
- Levenson et al. (2006) Levenson N.A., Heckman T.M., Krolik J.H., Weaver K.A., Zycki P.T., 2006, ApJ, 648, 111
- Maiolino & Rieke (1995) Maiolino R., Rieke G.H., 1995, ApJ, 454, 95
- Maiolino et al (2001a) Maiolino R., Marconi A., Salvati M., Risaliti G., Severgnini P., Oliva E., la Franca F., Vanzi L., 2001a, A&A, 365, 28
- Maiolino, Marconi & Oliva (2001b) Maiolino R., Marconi A., Oliva E., 2001b, A&A, 365, 37
- Malkan, Gorijn & Tam (1995) Malkan M.A., Gorijn V, Tam R., 1998, ApJS, 117, 25
- Matt (2002) Matt G., 2002, MNRAS, 337, 147
- McKernan, Yaqoob & Reynolds (2004) McKernan B., Yaqoob T., Reynolds C.S., 2004, ApJ, 617, 232
- McKernan, Yaqoob & Reynolds (2005) McKernan B., Yaqoob T., Reynolds C.S., 2005, MNRAS, 361, 1337
- Merloni et al (2006) Merloni A., Malzac J., Fabian A.C., Ross R.R., 2006, MNRAS, 370, 1699
- Miniutti et al. (2003) Miniutti G., Fabian A.C., Goyder R., Lasenby A.N., 2003, MNRAS, 344, L22
- Miniutti & Fabian (2004) Miniutti G., Fabian A.C., 2004, MNRAS, 349, 1435
- Miniutti & Fabian (2006) Miniutti G., Fabian A.C., 2006, MNRAS, 366, 115
- Miniutti et al (2006) Miniutti G. et al, 2006, PASJ Suzaku Special Issue in press (preprint astro-ph/0609521)
- Osterbrock & de Robertis (1985) Osterbrock D.E., de Robertis M.M., 1985, PASP, 97, 1129
- Ponti et al. (2006) Ponti G., Miniutti G., Cappi M., Marashi L., Fabian A.C., Iwasawa K., 2006, MNRAS, 368, 903
- Porquet & Dubau (2000) Porquet D., Dubau J., 2000, A&A S., 143, 495
- Pounds et al. (2003) Pounds K.A., Reeves J.N., King A.R., Pahe K.L., O’Brien P.T., Turner M.J.L., 2003, MNRAS, 345, 705
- Ranalli, Comastri & Setti (2003) Ranalli P., Comastri A., Setti G., 2003, A&A, 399, 39
- Reeves, O’Brien & Ward (2003) Reeves J.N., O’Brien P.T., Ward M.J., 2003, ApJ, 593, L65
- Risaliti (2002) Risaliti G., 2002, A&A, 386, 379
- Risaliti, Elvis & Nicastro (2002) Risaliti G., Elvis M., Nicastro F., 2002, ApJ, 571, 234
- Risaliti et al. (2005) Risaliti G., Elvis M., Fabbiano G., Baldi A., Zezas A., 2005, ApJ, 623, L93
- Ross & Fabian (2005) Ross R.R., Fabian A.C., 2005, MNRAS, 358, 211
- Rowan–Robinson & Crawford (1989) Rowan–Robinson M., Crawford J., 1989, MNRAS, 238, 523
- Sanders et al. (2003) Sanders D.B., Mazzarella J.M., Kim D.–C., Surace J.A., Soifer B.T., 2003, ApJ, 126, 1607
- Schmitt et al. (2001a) Schmitt H.R., Antonucci R.R.J., Ulvestad J.S., Kinney A.L., Clarke C.J., Pringle J.E., 2001a, ApJ, 555, 663
- Schmitt et al. (2001b) Schmitt H.R., Ulvestad J.S., Antonucci R.R.J., Kinney A.L., 2001b, ApJS, 132, 199
- Shemmer et al (2006) Shemmer O., Brandt W.N., Netzer H., Maiolino R., Kaspi S., 2006, ApJ, 646, L29
- Stevens, Read & Bravo–Guerrero (2003) Stevens I.R., Read A.M., Bravo–Guerrero J., 2003, MNRAS, 343, L47
- Ueno (1997) Ueno S., 1997, Ph.D. Thesis, Kyoto University, Japan
- Weaver (2001) Weaver K.A., 2001, in “The central kpc of starburst and AGN: the La Palma connection”, eds. J.H. Knapen, J.E. Beckman, I. Shlosman, T.J. Mahoney, ASP Conf, Ser., 249, 389
- White, Swank & Holt (1983) White N.E., Swank J.H., Holt S.S., 1983, ApJ, 270, 711
- Young et al. (1996) Young S., Hough J.H., Efstathiou A., Wills B.J., Bailey J.A., Ward M.J., Axon D.J., 1996, MNRAS, 281, 1206