MODELING OF THE SUPER-EDDINGTON PHASE FOR CLASSICAL NOVAE: FIVE IUE NOVAE
Abstract
We present a light curve model for the super-Eddington luminosity phase of five classical novae observed with IUE. Optical and UV light curves are calculated based on the optically thick wind theory with a reduced effective opacity for a porous atmosphere. Fitting a model light curve with the UV 1455 Å light curve, we determine the white dwarf mass and distance to be , 4.4 kpc) for V693 CrA (catalog ), , 1.8 kpc) for V1974 Cyg (catalog ), , 4.1 kpc) for V1668 Cyg (catalog ), , 2.1 kpc) for V351 Pup (catalog ), and , 4.3 kpc) for OS And (catalog ).
Subject headings:
novae, cataclysmic variables — stars: individual (V693 Coronae Australis, V1974 Cygni, V1668 Cygni, V351 Puppis, OS Andromedae)1. INTRODUCTION
The super-Eddington luminosity is one of the long standing problems in the theoretical study of classical novae (e.g., Friedjung, 2004, for recent summary). Super-Eddington phases last more than a few to several days, and their peak luminosities often exceed the Eddington limit by a factor of a few to several (e.g., Della Valle & Livio, 1995, and references therein).
It is difficult to reproduce such a super-Eddington luminosity in evolutional calculations of nova outbursts. Dynamical calculations show that the super-Eddington phase appears only in a very short time, or does not appear at all, apart from numerical difficulties that often prevent accurate calculation of the photospheric luminosity and visual magnitude (e.g., Sparks et al, 1978; Prialnik et al, 1978; Nariai et al., 1980; Starrfield et al., 1985, 1986; Politano et al, 1995).
Recently, Shaviv (2001, 2002) presented an idea on the mechanism of the super-Eddington luminosity. Shortly after hydrogen ignites on a white dwarf, the envelope becomes unstable to develop a porous structure in which the effective opacity becomes much smaller than the normal opacity for uniform medium. Corresponding to the reduced effective opacity, the effective Eddington luminosity becomes larger. Therefore, the diffusive energy flux can exceed the Eddington value for uniform medium, even though it does not exceed the effective Eddington luminosity.
Based on this idea, Kato & Hachisu (2005) presented a light curve model for the super-Eddington phase of classical novae. They assumed a reduced opacity in early phases of nova outbursts and reproduced the optical light curve of V1974 Cyg. This is the first theoretical model for the super-Eddington light curves. In the present paper, we apply the same method to other classical novae to examine whether or not this idea is applicable to the different speed class of novae.
The International Ultraviolet Explorer (IUE) satellite observed a number of nova outbursts (e.g., Cassatella et al., 1979, 2002, 2004a, 2005; Stickland et al., 1981). Cassatella et al. (2002) presented 1455 Å continuum light curves for twelve novae and showed that the duration of the UV outburst is a good indicator of the speed class of novae, i.e., a faster nova shows a shorter duration of the UV outburst. This 1455 Å light curve is an important clue in modeling the super-Eddington phase (Kato & Hachisu, 2005) and also a useful tool in estimating the white dwarf mass and distance to the star (Hachisu & Kato, 2005, 2006). Here, we make a model of the super-Eddington phase for five Galactic novae, V693 CrA, V1974 Cyg, V1668 Cyg, V351 Pup, and OS And, because their 1455 Å light curves are available from the beginning of the super-Eddington phase to the UV decay.
2. LIGHT CURVE MODEL
2.1. Optically Thick Wind Model
After a thermonuclear runaway sets in on an accreting white dwarf (WD), the photosphere greatly expands to . The optical luminosity reaches a maximum value, which often exceeds the Eddington limit. After that, the photosphere moves inward whereas the envelope matter goes outward. The wind mass-loss begins in the very early phase of the outburst and continues until the photospheric temperature rises to . The envelope mass decreases owing to the wind and nuclear burning (Kato & Hachisu, 1994).
The decay phase of novae can be well represented with a sequence of steady state solutions as described by Kato & Hachisu (1994). We have solved a set of equations, i.e., the equations of motion, mass continuity, radiative diffusion, and conservation of energy, from the bottom of the hydrogen-rich envelope through the photosphere. The winds are accelerated deep inside the photosphere, so they are called “optically thick winds.”
2.2. The Reduced Opacity
We assume that the opacity is effectively reduced by a factor ,
| (1) |
in the super-Eddington phase, where is the OPAL opacity (Iglesias & Rogers, 1996) and is the opacity reduction factor that represents the reduced ratio of the effective opacity in a porous envelope.
Kato & Hachisu (2005) assumed that is a function of the temperature and time, i.e., is unity in the outer region of the envelope (), but takes a certain constant value at the inner region , and it changes linearly between these values. Here is a function of time that has the maximum value at the optical peak and then gradually decreases to unity. Choosing an appropriate , Kato & Hachisu reproduced the light curve of V1974 Cyg in the super-Eddington phase. Once the temperature dependence of is given, is uniquely determined by fitting with both the optical and UV light curves. In the present paper, we first adopt the same temperature dependence of as in Kato & Hachisu (2005). We call it Model 1.
We adopt another type of function for . We call it Model 2, in which changes in a more inner region of the envelope, i.e., at but at and changes linearly between these values.
The function of should be closely linked with radiation instabilities against a porous structure of the atmosphere. However, we do not know how and when the porous structure develops in a nova envelope and how much the opacity is reduced. Therefore, in the present paper, we assume the two functions of , i.e., Model 1 and Model 2. Model 1 corresponds to the case that the porous structure develops from the bottom of the envelope to a lower temperature region beyond the peak of the OPAL opacity at . Therefore, the peak value of the opacity is reduced by a factor of . Model 2 corresponds to the case that the porous structure does not extend to the opacity peak at .
2.3. Optical Light Curve
In V1500 Cyg, which is one of the brightest novae, the temporal evolution of the spectrum and the fluxes are well understood as blackbody emission during the first three days and as free-free emission after that (Gallagher & Ney, 1976; Ennis et al., 1977; Duerbeck & Seitter, 1979). In the modeling of the super-Eddington phase we divide the optical light curve into three phases (Kato & Hachisu, 2005). The first is the super-Eddington phase, in which we simply assume that photons are emitted at the photosphere as a blackbody with a photospheric temperature of . In the next phase, the optical flux is dominated by free-free emission of the optically thin ejecta outside the photosphere. The flux of free-free emission can be roughly estimated as
| (2) |
where is the flux at the wavelength , and are the number densities of electrons and ions, is the volume of the ejecta, is the wind mass-loss rate, and is the velocity at the photosphere. Here, we use the relation of , and and are the density and velocity of the wind, respectively. We substitute , and from our best fit model. We cannot uniquely specify the proportional constant in equation (2) because radiative transfer is not calculated outside the photosphere. Instead, we choose the constant to fit the light curve (Hachisu & Kato, 2005, 2006).
When the nova enters a nebular phase, strong emission lines such as [O III] dominantly contribute to the visual light curve. Then the visual light curve gradually deviates from our free-free light curve of equation (2). This is the third phase.
2.4. UV 1455 Å Light Curve
After the optical maximum, the photospheric radius of the envelope gradually decreases while the photospheric temperature () increases with time. As the temperature increases, the main emitting wavelength of radiation shifts from optical to UV. The UV 1455 Å flux reaches a maximum at . After the UV flux decays, the supersoft X-ray flux finally increases.
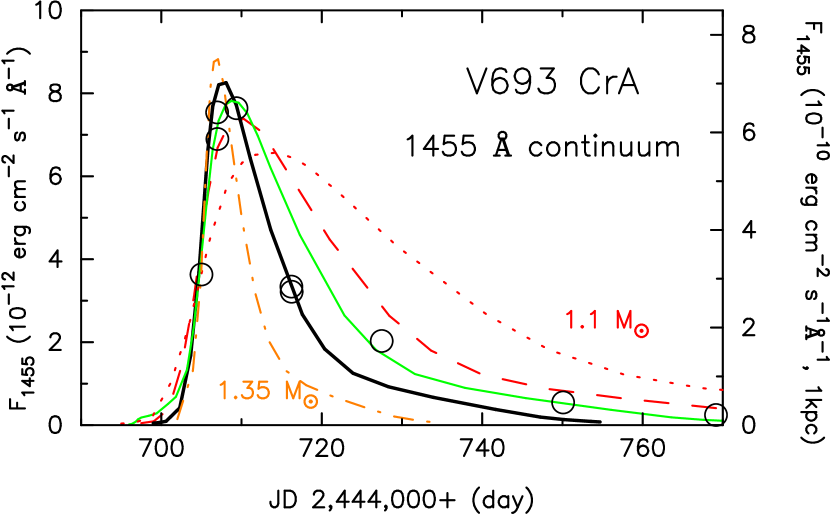
Figure 1 shows the theoretical 1455 Å light-curves of various WD masses with an envelope chemical composition of and . The evolutional timescale depends strongly on the WD mass. More massive WDs evolve faster than less massive WDs. The evolution speed also depends on the chemical composition because enrichment of heavy elements drives more massive winds through the opacity enhancement, which accelerate nova evolutions. Therefore, the duration of 1455 Å burst depends on the WD mass and chemical composition of the envelope.
Figure 2 depicts the dependence of such duration of the 1455 Å outburst for various WD masses and chemical compositions. Here, the duration is defined by the full width at the half maximum of the 1455 Å light curve (Hachisu & Kato, 2006). Once the chemical composition is determined, we can estimate the WD mass from this figure.
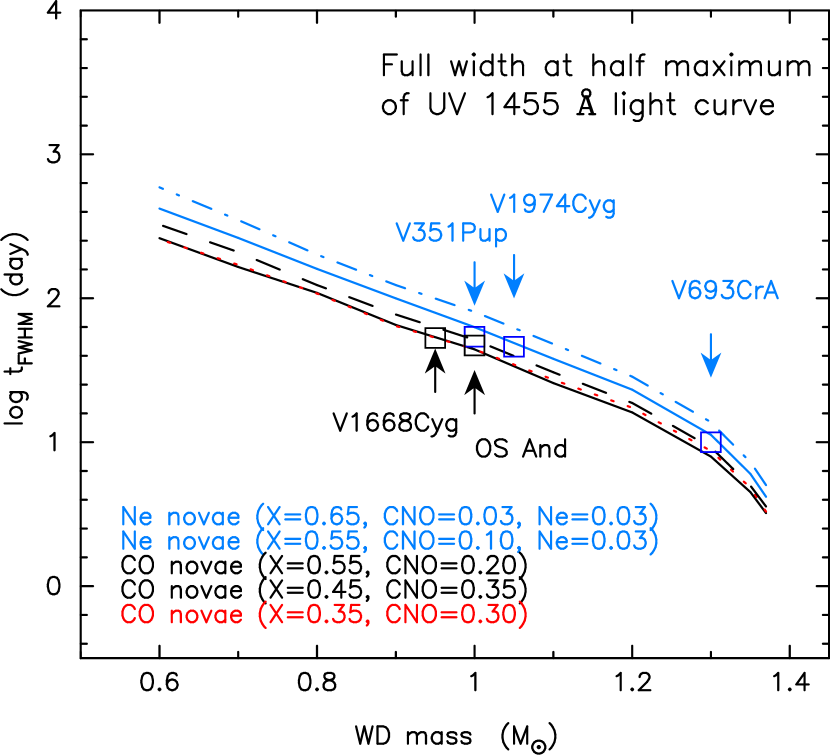
Hachisu & Kato (2006) fitted theoretical light curves with the 1455 Å observation and determined the WD masses for V1668 Cyg and V1974 Cyg. They find that their WD masses show good agreement in the light-curve fittings of optical, infrared, and X-ray for the entire period of the outburst. In this sense, the 1455 Å light curve is a good indicator of the WD mass. In the present paper, we estimate the WD mass from the 1455 Å light-curve fitting and use it in modeling of the super-Eddington phase.
| object | V693 CrA | V1974 Cyg | V1668 Cyg | V351 Pup | OS And | ||
|---|---|---|---|---|---|---|---|
| outburst year | 1981 | 1992 | 1978 | 1991 | 1986 | ||
| opacity Model (1 or 2) | 1 | 2 | 1 | 2 | 2 | 2 | 2 |
| (M⊙) | 1.3 | 1.05 | 0.95 | 1.0 | 1.0 | ||
| 0.35 | 0.46 | 0.45 | 0.35 | 0.45 | |||
| 0.33 | 0.32 | 0.18 | 0.23 | 0.18 | |||
| 0.2 | 0.15 | 0.35 | 0.3 | 0.35 | |||
| 0.1 | 0.05 | 0 | 0.1 | 0 | |||
| 0.02 | 0.02 | 0.02 | 0.02 | 0.02 | |||
| 0.2 | 0.32 | ||||||
| at peakb | 2.2 | 2.7 | 5.0 | 7.2 | 9.0 | 5.5 | 6.0 |
| Distance (kpc) | 4.4 | 4.4 | 1.8 | 1.8 | 4.1 | 2.1 | 4.3 |
| UV FWHMc (days) | 10 | 10 | 46 | 46 | 53 | 54 | 47 |
| erg | 2.68 | 2.65 | 4.4 | 4.2 | 4.0 | 3.3 | 3.2 |
| (mag) | |||||||
| (mag)d | 6.5 | 6.5 | 4.6 | 4.6 | 6.6 | 6.4 | 6.4 |
| excess of super-Edd (mag) | 0.84 | 0.84 | 1.7 | 1.7 | 1.9 | 1.5 | 1.6 |
| duration of super-Edd (days) | 6 | 6 | 18e | 16e | 16 | 9 | 12 |
| time (days) | 13 | 13 | 34e | 32e | 25 | 23 | 25 |
| () | 2.0 | 2.7 | 3.9 | 4.8 | 5.8 | 3.1 | 3.9 |
3. V693 CrA (NOVA CORONAE AUSTRALIS 1981)
Nova V693 CrA (catalog ) was discovered by Honda (Kozai & Kosai, 1981; Caldwell, 1982) on 1981 April 2 near maximum at an apparent magnitude of . The discovery magnitude was once reported to be 7.0 but was later corrected to be 6.5 (Kozai, private communication in Caldwell, 1982). Sion et al. (1986) suggested a white dwarf as massive as those in O-Ne-Mg novae from the broad emission line widths, high ejection velocities, large mass-loss rates, and the presence of strong neon lines (Vanlandingham et al., 1997).
The abundance of V693 CrA was estimated from the IUE spectra to be , , and (Vanlandingham et al., 1997), , and (Williams et al., 1985, taken from Table 6 in Valandingham et al. 1997), or , and (Andreä et al., 1994). Considering these scattered values, we adopt , and in our model calculation. The theoretical light curve hardly changes if we increase the neon abundance from 0.1 to 0.2 and decrease the helium from 0.23 to 0.13. This is because the exchange of neon with helium does not affect either the hydrogen burning rate or the opacity.
3.1. UV Light Curve and Distance
Figure 1 depicts the IUE continuum UV fluxes obtained by Cassatella et al. (2002) for the Å band with a Å width (centered on Å). The corresponding theoretical light curves are also plotted for five WD masses of 1.1, 1.2, 1.25, 1.3, and 1.35 . Here, we assume the OPAL opacity (i.e., throughout the envelope). For more massive WDs the evolution is faster and the UV flux decays more quickly. Both the 1.25 and 1.3 WDs are consistent with the observation. We may exclude and . In the present paper,we adopt the 1.3 model for later calculation.
Vanlandingham et al. (1997) obtained the reddening of V693 CrA to be mainly from the comparison with nova LMC 1990 No. 1 and also the comparison with the reddening of globular clusters within 10 degrees from the nova. They also suggested that the reddening is small because no interstellar absorption feature was seen in their spectrum. In the present paper, we assume .
Using this reddening, we estimate the distance to the star. The absorption at Å is calculated to be (e.g., Seaton, 1979). The observed peak flux is erg cm-2 s-1Å-1 whereas the theoretical peak value is erg cm-2 s-1Å-1 for the 1.3 star for a distance of 1 kpc. Therefore, the distance is calculated to be kpc.
In previous works, the distance to V693 CrA has been estimated to be as large as 8-12 kpc (Caldwell, 1981, 1982; Brosch, 1981, 1982), mainly because they assumed large absolute magnitudes of to from the absolute magnitude-rate of decline relations. This relation, however, is not very accurate for a single nova (Vanlandingham et al., 1997) and may overestimate the absolute magnitude. We will see that the peak magnitude is as faint as in both Models 1 and 2 for the obtained distance of 4.4 kpc. We summarize our fitting results in Table 1.
3.2. Optical Light Curve
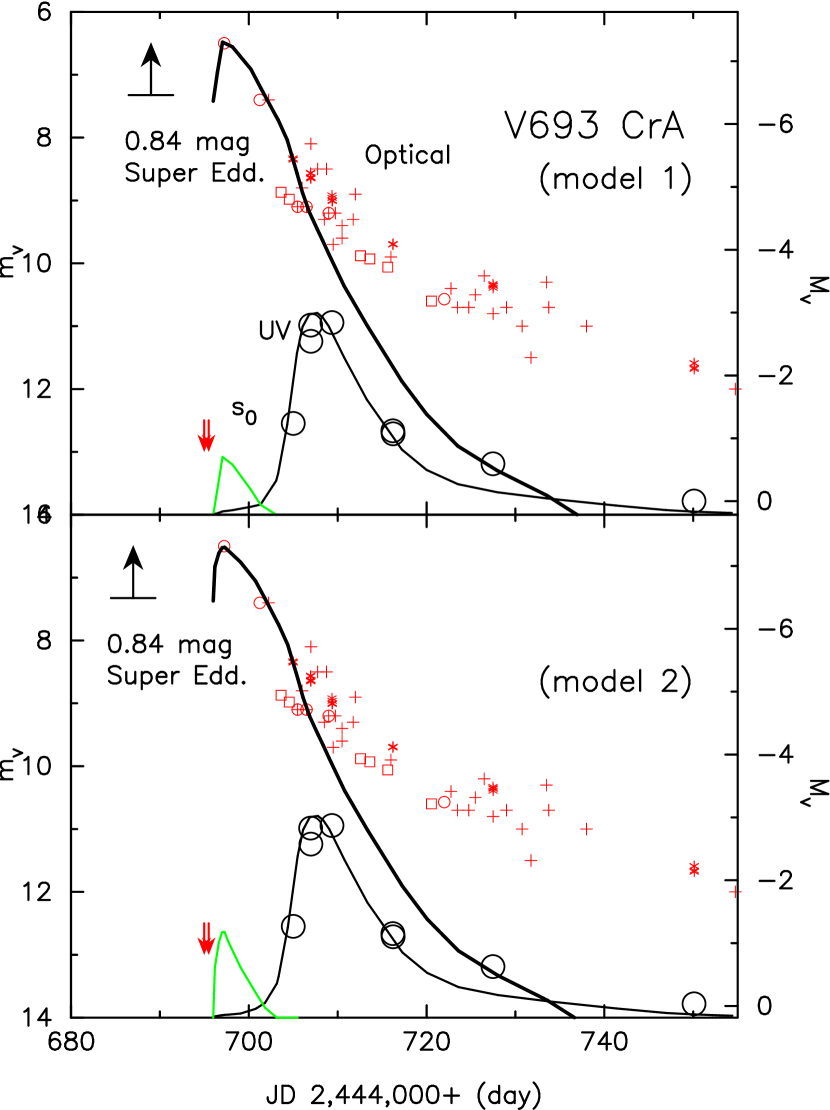
Figure 3 shows the theoretical light curves as well as the observational data in optical. Because of few data points around the maximum and of scattered data after that, it is difficult to identify a shape of the optical light curve. Our best fit model for each opacity reduction factor shows good agreement with both the UV and optical light curves. These two models have similar properties as shown in Table 1.
In Figure 3 the thick solid curve denotes the visual light curve for the blackbody photosphere. The super-Eddington phase lasts 6 days in both models. Free-free emission gradually becomes dominant as the photospheric temperature rises to and our theoretical curve for blackbody emission deviates from the observation. Here, we do not plot the light curve of free-free emission phase, because we cannot exactly determine the constant in equation (2) for such large scattering data.
In the case of V693 CrA the super-Eddington phase almost ends before the 1455 Å flux rises. Therefore, our estimates of the WD mass and distance, which are determined from the UV flux fitting, are probably independent of our modeling of the super-Eddington phase.
4. V1974 Cyg (NOVA CYGNI 1992)
Kato & Hachisu (2005) presented a light curve model of the super-Eddington phase for a 1.05 WD with a chemical composition of , , and . This is the prototype of Model 1. Here, we have calculated light curves for Model 2 with the same other parameters as in Kato & Hachisu. Our best fit model in Figure 4 is very similar to that for Model 1. This means that we cannot determine which opacity reduction factor is preferable for V1974 Cyg from the light-curve fitting.
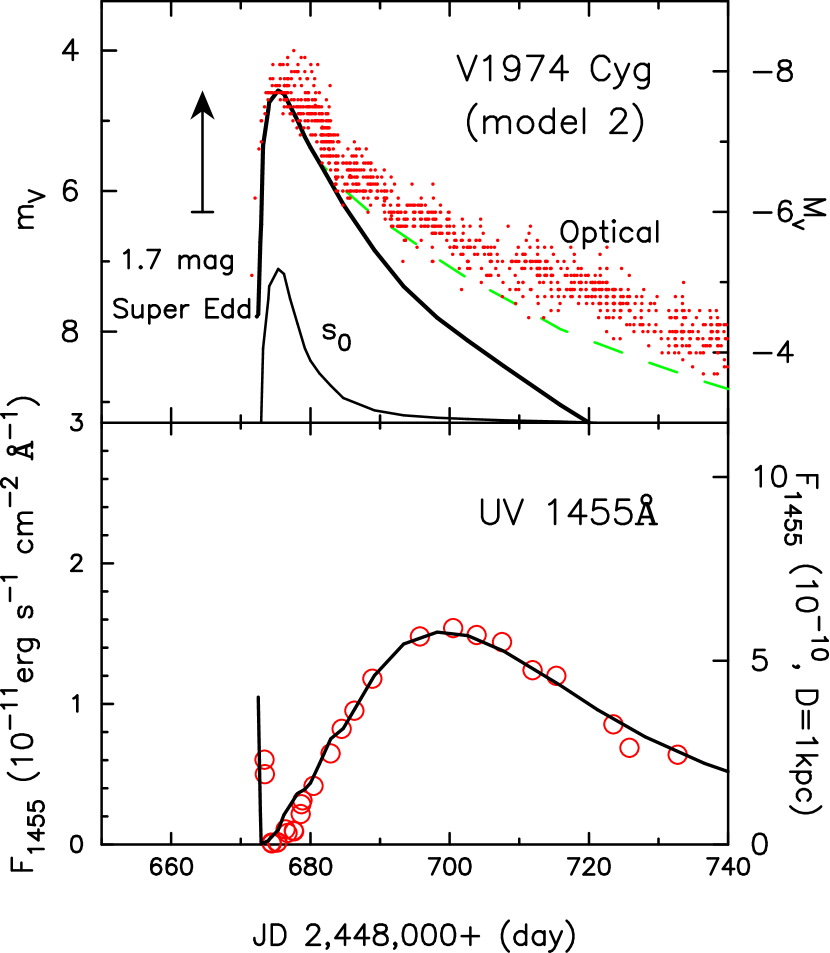
The distance is calculated from the UV light-curve fitting. We obtained 1.8 kpc with an extinction of (Chochol et al., 1997), the same value as in Model 1. Our distance is slightly larger than the estimate of 1.7 kpc by Hachisu & Kato (2005) obtained from the UV light-curve fitting using the normal opacity () models, because the luminosity at the UV peak is still super-Eddington ( in Model 1 and in Model 2 at the UV peak), and the UV flux is larger than that in the normal opacity models. Our distance is consistent with those discussed in Chochol et al. (1997), a most probable value of 1.8 kpc.
5. V1668 CYG (NOVA CYGNI 1978)
V1668 Cyg was discovered on 1978 September 10.24 UT (Morrison, 1978), two days before its optical maximum of . This object was also well observed with IUE satellite. Hachisu & Kato (2006) presented a light curve model from shortly after the optical peak until the end of the outburst. Their best fit model is a WD mass of with a chemical composition of , , and . In the present paper, we adopt their parameters and reproduce the super-Eddington phase.
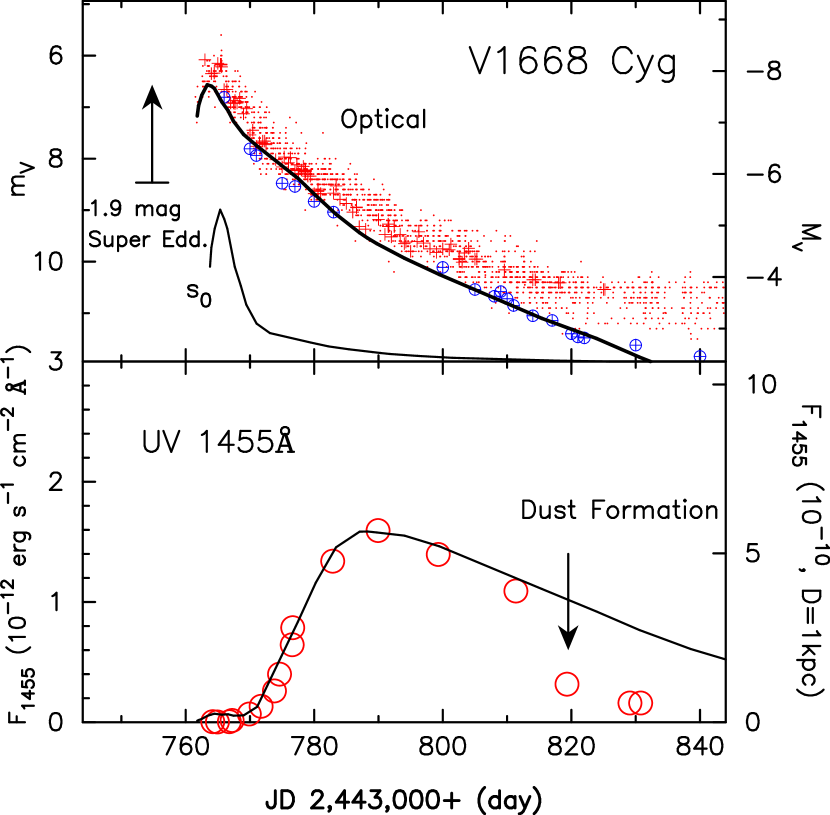
V1668 Cyg shows a similar but slightly steeper light curve around the peak compared with V1974 Cyg. As shown in Figures 4 and 5, there is a remarkable difference in the 1455 Å fluxes. In V1668 Cyg the 1455 Å flux remains low in several days before rising up, whereas in V1974 Cyg it once decreases before the optical maximum and rises again. This means that the photospheric temperature in V1668 Cyg remains low in a relatively long time around the optical peak. This difference led us to find no best fit solutions for Model 1. Figure 5 shows our best fit light curve for Model 2, where the WD mass and the chemical composition is assumed to be the same as in Hachisu & Kato (2006). This model represents well both the UV and magnitude light curves.
5.1. Distance from UV Light-Curve Fitting
Figure 5 shows that the 1455 Å flux decays quickly around JD 2,443,820, which can be attributed to the formation of an optically thin dust shell. Gehrz et al. (1980) reported an excess of the infrared flux that peaks at JD 2,443,815 whereas no significant drop in the visual magnitude is observed. Even if the dust shell is optically thin, the grain condensation leads to a redistribution of UV flux into infrared. Considering this effect, which is not included in our theory, our WD model shows good agreement with the 1455 Å observation.
It is difficult to estimate the interstellar absorption in the direction of V1668 Cyg because there are only a few star well photometrically observed. Hachisu & Kato (2006) re-examined the distance-reddening law in the direction of V1668 Cyg and estimated the reddening to be and obtained the distance of 3.6 kpc. Stickland et al. (1981) estimated from 2200 Å feature. We adopt .
The distance is derived to be 4.1 kpc with . This value is somewhat larger than 3.6 kpc estimated by Hachisu & Kato (2006) with the normal opacity. In our model, the opacity reduction factor is still larger than unity ( at the 1455 Å peak) as shown in the upper panel of Figure 5. Both the bolometric and UV fluxes are enhanced compared with those in the model of Hachisu & Kato (2006). Therefore, we obtain a larger distance.
Slovak & Vogt (1979) estimated the distance to be 3.3 kpc. Duerbeck et al. (1980) obtained a much smaller distance of kpc based on the same stars. It is very difficult to estimate the distance because of the small number of stars and the very patchy relation in the direction of the nova (see Hachisu & Kato, 2006). Gallagher et al. (1980) derived the distance to be 4.4 kpc adopting for . However, Gallagher et al. (1980) preferred a smaller distance of kpc, which was derived assuming that the peak luminosity is equal to the Eddington luminosity because a star with the super-Eddington luminosity may be dynamically unstable. This argument cannot be applied to our model, however, because the envelope is settled down into a steady-state even in the super-Eddington phase. Stickland et al. (1981) suggested the distance to be 2.2 kpc by equating the maximum luminosity and the Eddington luminosity. They also obtained a distance of 3.6 kpc from the relation between the maximum magnitude and the rate of decline. They did not take this larger distance because the large acceleration of matter cannot be expected in the optically thin region. However, this is not the case of our optically thick wind. Considering these arguments, we conclude that our distance of 4.1 kpc is reasonable.
Using the distance of 4.1 kpc obtained from the 1455 Å light-curve fitting, we derive the peak magnitude of , i.e., super-Eddington by 1.9 mag.
5.2. Optical Light Curve
Our theoretical -magnitudes are shown in the upper panel of Figure 5. This curve is placed so as to satisfy the distance modulus of .
There are rich observational data of visual magnitude. However, we focus on the Strömgren band light curve (taken from Gallagher et al., 1980, denoted by the crosses with a circle), which lies along the bottom edge of the visual data, because the filter is designed to avoid strong emission lines in the nebular phase and reasonably represents the continuum fluxes of novae. We regard that our light curve follows the magnitude because our model ignores such line contributions.
The nova enters a coronal phase 53 days after the optical maximum (Klare et al., 1980) and the spectrum shows strong nebular emission lines (Kaler, 1980). After that, the difference between visual and magnitudes becomes significant as shown in Figure 5.
The spectral development of V1668 Cyg can be understood with our model as follows. The spectrum near the optical maximum was reported to be similar to that of an intermediate F star (Ortolani et al., 1978), and also be consistent with the principal spectrum which is characterized by weak hydrogen emission lines and absorption lines of neutral and singly ionized metals (Klare & Wolf, 1978). In our model, the photospheric temperature is as low as , most of hydrogen is recombined in the region around the photosphere. Therefore, these properties are consistent with the observed features. When the magnitude declined by about 0.8 mag (three days after the maximum), Klare et al. (1980) reported that the nova shows the diffuse enhanced spectrum in which strong emission features dominate. In our model the photospheric temperature rises to at this time and the ionization degree of hydrogen is quickly increasing with time. This is consistent with the appearance of strong H emission. The nova enters a coronal phase 53 days after the optical maximum (Klare et al., 1980). In our model the temperature rises to at this time and the photon flux is dominated by UV.
6. V351 PUP (NOVA PUPPIS 1991)
V351 Pup was discovered on 1991 December 27 by Camillieri (1992) near maximum. The light curve shown in Figure 6 resembles that of V1668 Cyg in Figure 5. In our modeling we adopt , , , and after Saizar et al.’s (1996) estimate from the IUE spectra, i.e., , , , and . The reddening is obtained to be from emission-line ratios (Williams, 1994) and from ratios of recombination lines (Saizar et al., 1996). Here we take .
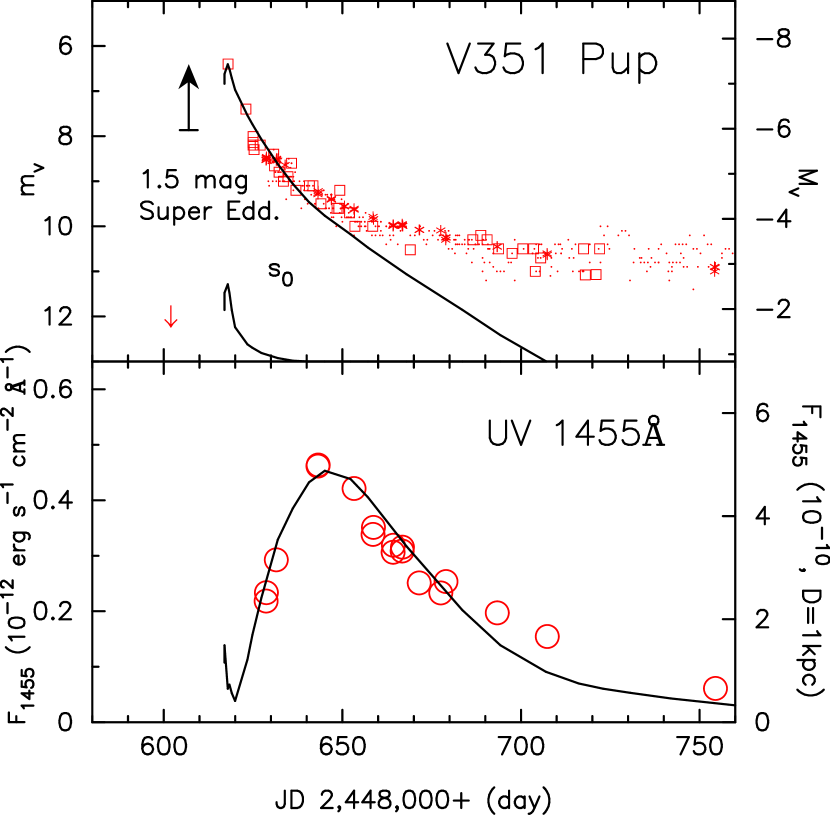
As optical data are poor around the maximum and no magnitude data were reported, we assume Model 2 as in V1668 Cyg and a slightly larger WD mass of . The resultant light curve is shown in Figure 6 which shows good agreement with both the 1455 Å and optical light curves. The distance is estimated to be 2.1 kpc from the UV light-curve fitting.
7. OS AND (NOVA ANDROMEDAE 1986)
OS And was discovered by Suzuki on 1986 December 5 (Kosai, 1986). The optical light curve in Figure 7 shows a 1.5 mag dip that lasts about 30 days owing to dust formation. Corresponding to this dip, the 1455 Å light curve shows a quick decrease at JD 2,446,800 (Cassatella et al., 2002). Apart from the deep dip, the optical and 1455 Å light curves resemble to those of V1668 Cyg and V351 Pup in the first 20 days. Moreover, the UV spectrum is very similar to that of V351 Pup in the first two weeks (Sonneborn et al., 1992).
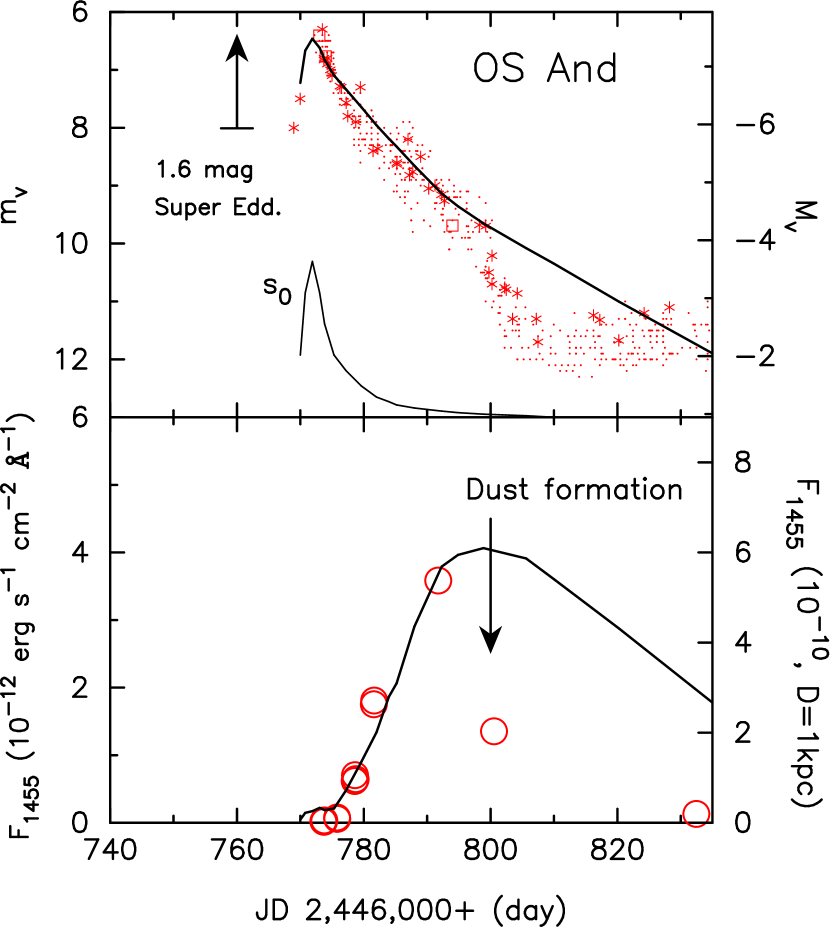
With such a strongly absorbed UV light curve, it is difficult to search for a best fit model. Therefore, we assume the same WD mass and the same function as those in V351 Pup. The chemical composition is assumed to be the same as in V1668 Cyg, regarding OS And as a CO nova. Note that the difference in the composition does not make large difference as shown in the two light curves of V1668 Cyg and V351 Pup. The blackbody light curve in Figure 7 shows good agreement with both the visual and UV data in the first 20 days.
The distance is estimated to be 4.3 kpc from the 1455 Å light curve fitting in the lower panel for a reddening of (Schwarz et al., 1997). Our value of 4.3 kpc is roughly consistent with kpc obtained from a comparison of UV fluxes between OS And (catalog ) and Nova LMC 1992 (catalog ) (Schwarz et al., 1997).
8. DISCUSSION AND SUMMARY
Table 1 summarizes the model parameters and our main results, i.e., from top to bottom row, (1) object name, (2) outburst year, (3) adopted function of the opacity reduction factor, (4) WD mass, (5)–(9) adopted chemical composition, (10) reddening, (11) opacity reduction factor at the optical maximum, (12) distance estimated from the peak of the 1455 Å light-curve, (13) duration of the 1455 Å outburst defined by the full width at the half maximum (FWHM), (14) peak bolometric luminosity, (15) absolute and (16) apparent -magnitudes corresponding to the peak luminosity, (17) excess of the super-Eddington in -magnitude, i.e., the difference between the peak magnitude of our model () and the peak magnitude of a light curve model with the normal opacity () for the same WD mass and the same envelope composition, (18) duration of the super-Eddington phase, (19) time in which drops by 3 magnitude from the peak in our theoretical model, (20) mass ejected during the period from the first point of each light curve until the wind stops.
8.1. Opacity Reduction Factor
There are no time-dependent calculations of nova outbursts in which porous instabilities widely develop. So, it is difficult for us to estimate how much the opacity is reduced in the nova envelopes. Here, we have simply assumed to be a function of the temperature and time. Then, we have determined so as to reproduce the observed light curve of each object.
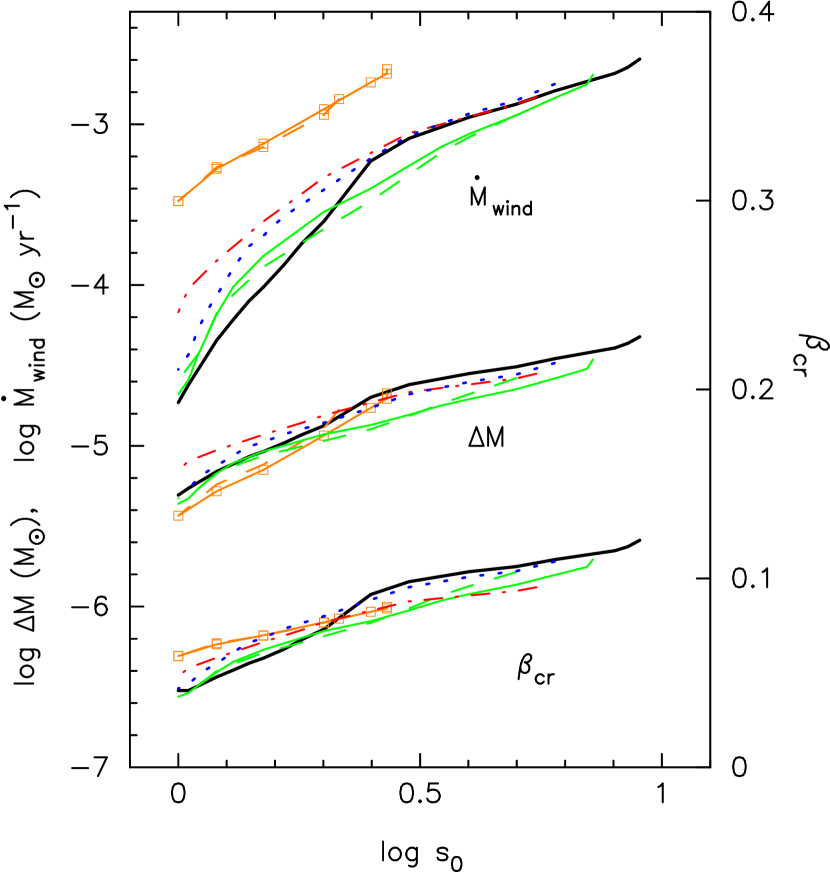
The referee kindly pointed out that the opacity reduction factor would be expressed as a function of the current state of the envelope which is independent of time. After a porous instability widely develops in the envelope, it may settle into an equilibrium state. If our opacity reduction factor represents such an envelope state, it may be a function of a small number of physical parameters/variables that represent the current state of the envelope.
In order to search for such parameters/variables, we plot the wind mass-loss rate (), envelope mass (), and ratio of the gas pressure to the total pressure at the critical point of each steady wind solution () against in Figure 8. We plot seven light-curve models for five objects in Table 1. These seven models are different from each other in their characteristic properties such as the WD mass, chemical composition, and opacity model.
First of all, we can easily see that the difference between Model 1 and Model 2 hardly makes large difference on these three variables; the curves for Model 1 and Model 2 are very close to each other in V693 CrA and V1974 Cyg.
Next, we see that the two models of V693 CrA are separated from the others in the wind mass-loss rate. This is because the WD of V693 CrA is as massive as 1.3 whereas the other WDs are . The wind mass-loss rate is much larger on a massive WD than on a less massive one if we compare them at the same envelope mass, as shown in our previous work (Kato & Hachisu, 1994). Therefore, the difference in the wind mass-loss rates of V693 CrA in Figure 8 can be attributed to the difference in the WD masses. So we may conclude that the mass-loss rate itself is not a main factor that determines the opacity reduction factor .
In the envelope mass, all the curves are almost similar to each other. This suggests that is closely related to the envelope mass. In other words, the porous instability involves at least a wide area of the envelope, and decreases as the envelope mass decreases with time due to wind mass-loss.
In the ratio of the gas pressure to the total pressure at the critical point of steady-state wind solutions, where the wind is accelerated (Kato & Hachisu, 1994), we see that all the curves are also very similar to each other. The ratio is almost constant in a region below the critical point. Therefore, represents a mean value of in the region where the opacity is reduced.
We have checked other physical variables such as the luminosity, photospheric radius, temperature, and radius at the critical point, but we found that all these variables are largely scattered from each other, i.e., not bunched like in and of Figure 8.
We may conclude that the envelope mass and are the key parameters that represent the current state of envelopes with a porous structure. Probably, should be closely linked with the property that the porous instability is a kind of radiation instability and the envelope mass may be related with the property that the porous instability involves a large part of the envelope, although we do still not know the accurate condition for the porous instability.
8.2. White Dwarf Mass and Chemical Composition
Both the WD mass and chemical composition are fixed in the present work. If we choose a different set of these parameters, we have different time scales of theoretical light curves not only in the very early phases but also in the later phases of the outbursts including the epochs when the wind mass-loss stops and hydrogen burning ends. For V1974 Cyg and V1668 Cyg, multiwavelength observations are available until the very late phase of the outburst and their WD masses are determined consistently with these observations (see, e.g., Hachisu & Kato, 2005, 2006, for V1974 Cyg and V1668 Cyg). Therefore, we adopt their estimates.
The decline rates of nova light-curve depend strongly on the WD mass and weakly on , very weakly on , but hardly on . Therefore, the largest ambiguity in the estimation of WD masses comes from the accuracy of hydrogen content . The dependency of the WD mass on is roughly estimated as
| (3) |
when and , using the “universal decline law” of nova light curves (Hachisu & Kato, 2006) that nova light curves are almost homologous except for the very early phase (i.e., the super-Eddington phase discussed here). Here, means the WD mass estimated for and the original value of can be replaced with any other value, for example, .
For the other three objects, i.e., V693 CrA, V351 Pup, and OS And, there is no observational data in the late phase, i.e., when the wind stopped and when the hydrogen burning ended. Then we determined the WD mass only from the UV light curve fitting with a fixed chemical composition as shown in Figure 1. If we adopt a different set of the chemical composition, we have a slightly different WD mass as can be estimated from equation (3) or Figure 2.
8.3. Distance
Nova distances are determined from the comparison between observed UV fluxes and calculated fluxes at the UV peak. In case of V693 CrA and V351 Pup, the super-Eddington phase ended, i.e., , at the UV peak as shown in Figures 3 and 6. So, the distance can be determined independently of the reduced factor of . In case of V1974 Cyg, the super-Eddington phase still continues at the UV peak. The distances derived for Model 1 and Model 2 are the same within the accuracy of two digits as shown in Table 1, although these values themselves are somewhat larger than the values derived without the super-Eddington phase () as already mentioned in §5.1. From these results, it may be concluded that the opacity reduction factor does not affect so much the distance estimate. This is because, in all the five objects, their super-Eddington phases had already or almost ended () at the UV peak.
8.4. Summary
Our main results are summarized as follows;
1. We present light-curve models of the super-Eddington phases for five IUE classical novae based on the optically thick wind theory, with an assumption that the opacity is reduced in a porous envelope (Shaviv, 2002). Our models reasonably reproduce the optical and 1455 Å light curves.
2. The duration of the 1455 Å light curve is a useful indicator of the WD mass, especially when the chemical composition is known.
3. The distance is derived from the comparison between the observed peak value of the 1455 Å flux and the corresponding calculated value unless a dust shell absorbs the UV flux at its maximum. The derived distances of the five IUE novae are consistent with the previous estimates.
References
- Andreä et al. (1994) Andreä, J., Drechsel, H., & Starrfield, S. 1994, A&A, 291, 869
- Brosch (1981) Brosch, N. 1981, Inf. Bul. Variable Stars, 2003
- Brosch (1982) Brosch, N. 1982, A&A, 107, 300
- Camillieri (1992) Camillieri, P. 1992, IAU Circ., 5422
- Caldwell (1981) Caldwell, J. A. R. 1981, Inf. Bul. Variable Stars, 1981
- Caldwell (1982) Caldwell, J. A. R. 1982, Inf. Bul. Variable Stars, 2147
- Cassatella et al. (2002) Cassatella, A., Altamore, A., & González-Riestra, R. 2002, A&A, 384, 1023
- Cassatella et al. (2005) Cassatella, A., Altamore, A., & González-Riestra, R. 2004, A&A, 420, 571
- Cassatella et al. (1979) Cassatella, A., Benvenuti, P., Clavel, J., Heck, A., Penston, M., Macchetto, F., & Selvelli, P. L. 1979, A&A, 74, L18
- Cassatella et al. (2004a) Cassatella, A., González-Riestra, R., & Selvelli, P. 2004a, INES Access Guide No.3 Classical Novae (ESA: Netherlands)
- Cassatella et al. (2004b) Cassatella, A., Lamers, H. J. G. L. M., Rossi, C., Altamore, A., & González-Riestra, R. 2004b, A&A, 420, 571
- Chochol et al. (1997) Chochol, D., Grygar, J., Pribulla, T., Komzik,R., Hric, L., & Elkin, V. 1997, A&A, 318, 908
- Della Valle & Livio (1995) Della Valle, M., & Livio, M. 1995, ApJ, 452, 704
- Duerbeck & Seitter (1979) Duerbeck, H. W., & Seitter, W. C. 1979, A&A, 75, 297
- Duerbeck et al. (1980) Duerbeck, H. W., Rindermann, K., & Seitter, W. C. 1980, A&A, 81, 157
- Ennis et al. (1977) Ennis, D., Becklin, E. E., Beckwith,J., Elias, J., Gatley, I., Matthews, K., Neugebauer, G., & Willner, S. P. 1977, ApJ, 214, 478
- Friedjung (2004) Friedjung, M. 2004, Baltic Astronomy, 13, 116
- Gallagher & Ney (1976) Gallagher, J. S., & Ney, E. P. 1976, ApJ, 204, L35
- Gallagher et al. (1980) Gallagher, J. S., Kaler, J. B., Olson, E. C., Hartkopf, W. I., & Hunter, D. A. 1980, PASP, 92, 46
- Gehrz et al. (1980) Gehrz, R. D., Hackwell, J. A., Grasdalen, G. L., Ney, E. P., Neugebauer, G., & Sellgren, K. 1980, ApJ, 239, 570
- Hachisu & Kato (2005) Hachisu, I., & Kato, M. 2005, ApJ, 631, 1094
- Hachisu & Kato (2006) Hachisu, I., & Kato, M. 2006, ApJS, in press (astro-ph/0607609)
- Iglesias & Rogers (1996) Iglesias, C. A., & Rogers, F. J. 1996, ApJ, 464, 943
- Kaler (1980) Kaler, J. B. 1986 PASP, 98, 243
- Kato & Hachisu (1994) Kato, M., & Hachisu, I., 1994, ApJ, 437, 802
- Kato & Hachisu (2005) Kato, M., & Hachisu, I., 2005 ApJ, 633, L117
- Kikuchi et al. (1988) Kikuchi, S., Kondo, M., & Mikami, Y. 1988, PASJ, 40, 491
- Klare & Wolf (1978) Klare, G., & Wolf, B. 1978, IAU Circ., 3270
- Klare et al. (1980) Klare, G., Wolf, B., & Krautter, J. 1980, A&A, 89, 282
- Kosai (1986) Kosai, H. 1986, IAU Circ., 4281
- Kozai & Kosai (1981) Kozai, Y., & Kosai, H., 1981, IAU Circ., 3590
- Mallama & Skillman (1979) Mallama, A. D., & Skillman, D. R. 1979, PASP, 91, 99
- Morrison (1978) Morrison, W. 1978, IAU Circ., 3264
- Nariai et al. (1980) Nariai, K., Nomoto, K., & Sugimoto, D. 1980, PASJ, 32, 473
- Ortolani et al. (1978) Ortolani, S., Rafanelli, P., Rosino L. & Vittone, A. 1978, IAU Circ., 3276
- Politano et al (1995) Politano, M., Starrfield, S., Truran, J. W., Weiss, A., & Sparks, W. M. 1995, ApJ, 448, 807
- Prialnik et al (1978) Prialnik, D., Shara, M. M., & Shaviv, G. 1978, A&A, 62, 339
- Saizar et al. (1996) Saizar,P., Pachoulakis, I., Shore, S. N., Starrfield, S., Williams, R. E., Rothschild, E., & Sonneborn, G. 1996, MNRAS, 279, 280
- Schwarz et al. (1997) Schwarz, G. J, Hauschildt, P. H., Starrfield, S., Baron, E., Allard, F., Shore, S. N., & Sonneborn, G. 1997, MNRAS, 284, 669
- Seaton (1979) Seaton, M. J. 1979, MNRAS, 187, 73
- Shaviv (2001) Shaviv, N. J. 2001, MNRAS, 326, 126
- Shaviv (2002) Shaviv, N. J. 2002, in Classical Nova Explosions, eds. M. Hernanz & J. José (New York: AIP conference proceedings 637), 259
- Sion et al. (1986) Sion, E. M., Starrfield, S., Van Steenberg, M. E., Sparks, W., Truran J. W., Williams, R. E. 1986, AJ, 92, 1145
- Slovak & Vogt (1979) Slovak, M. H., & Vogt, S. S. 1979, Nature, 277, 114
- Sonneborn et al. (1992) Sonneborn, G., Shore, S. N., & Starrfield, S. 1992, IAU Circ., 5428
- Sparks et al (1978) Sparks, W. N., Starrfield, S., & Truran J. W. 1978, ApJ, 220, 1063
- Starrfield et al. (1985) Starrfield, S., Sparks, W. M., & Truran, J. W. 1985, ApJ, 291, 136
- Starrfield et al. (1986) Starrfield, S., Sparks, W. M., & Truran, J. W. 1986, ApJ, 303, L5
- Stickland et al. (1981) Stickland, D. J., Penn, C. J., Seaton, M. J., Snijders, M. A. J., & Storey, P. J. 1981, MNRAS, 197, 107
- Vanlandingham et al. (1997) Vanlandingham, K. M, Starrfield, S., & Shore, S. N. 1997, MNRAS, 290, 87
- Williams et al. (1985) Williams, R. E., Ney, E. P., Sparks, W. M., Starrfield, S., Wyckoff, S., & Truran, J. 1985, MNRAS, 212, 753
- Williams (1994) Williams, R. E., 1994, ApJ, 426, 279