THE STAR-FORMATION EFFICIENCY AND DENSITY OF THE DISKS OF SPIRAL GALAXIES
Abstract
For four well studied spiral galaxies (M33, M81, M100 and M101) we consider the dependencies of star formation rate () and star formation efficiency () both on the radial distance and on some kinematic parameters of galactic discs. To estimate we used a combined method based on the UV profiles corrected for the interstellar extinction presented by Boissier et al main . It is demonstrated that the most tight correlation, similar for all galaxies we considered, exists between the local and the surface brightness (density) of discs at a given (beyond their central regions). To account for the observed surface densities of discs in the frame of a simple conservative model of evolution of gas content (a toy model) it is necessary for the local parameter in the Schmidt law for a disc () not to exceed unit. Only in this case it is possible to reconcile the observed dependencies and assuming a gas accretion, more intense for the inner regions of galaxies.
pacs:
98.52.Nr, 98.62.Ai, 98.62.HrI INTRODUCTION
The properties of spiral galaxies determining the star-formation rate (SFR) at present and in the past are essential for our understanding of their evolution.
Spiral galaxies are characterized by a very wide range of both the total SFR and the star-formation efficiency, (star-formation rate per unit mass of gas). Since the active formation of the stellar population started at the same epoch in most galaxies (about 10 Gyr ago), we expect a close relation between these parameters and such galactic parameters as the total or relative mass of gas in the galaxy disk. Surprisingly, no such close relations are observed. Like the relative mass of gas in the disk, the SFE varies over more than an order of magnitude among galaxies of the same morphological type or the same color index Verhetal01 ; BBPG01 , while the average surface densities of (both atomic and molecular) gas , display a fairly small scatter for various types of spiral galaxies (see, e.g., ZasSmir05 and references therein). Galaxies containing large masses of gas can be found among spiral galaxies of all morphological subtypes, although with different occurrence rates. This reflects the complex nature of the evolution of galactic disks, which precludes a unique dependence of the SFR on the morphological features of a galaxy or the amount of interstellar gas it contains.
Nevertheless, observations of relatively nearby galaxies show the local gas density to be a crucial factor in star formation. Indeed, regions of active star formation are always associated with enhanced gas densities (on scale lengths of several hundred parsecs and more), whereas star formation is virtually absent in galaxies with low gas contents (such as lenticular galaxies), or is restricted in isolated regions where the gas is concentrated. The relationship between the SFR and the local gas volume density, , is often presented in the form proposed by Schmidt Schmidt59 for our own Galaxy: , where . In other galaxies, we directly measure the surface (and not volume) gas density, , which we compare to the “surface” SFR, and the above relation is usually written in the form (we refer to this as the Schmidt law for the disk, since it is by no means the same as the “volume” Schmidt law; see, e.g., the discussion of this issue by Tutukov Tutukov06 ).
A constant SFR per unit mass of gas corresponds to . However, estimates for local regions may differ from those for entire galaxies, since the SFR depends not only on the gas density, but also on other parameters that vary with distance from the disk center or from galaxy to galaxy. Therefore, parameter in the integrated Schmidt law reflects the effect of a great variety of factors that affect star formation, and it is essentially purely empirical.
According to the estimates of Kennicutt Kennicutt98 , this parameter is 0.15 for the integrated gas masses and SFRs in galaxies derived from the H line intensity. SFR estimates inferred from UV observations near 2000 Å yield Buatetal89 (the large range of possible values is due to uncertainties in the amount of UV absorption). However, these estimates were obtained by comparing integrated quantities for galaxies with obviously different star-formation conditions. Comparisons of local (azimuthally averaged) SFRs and gas densities along the galactocentric radii of particular spiral galaxies are of considerable interest. In their analysis for several galaxies, Wong and Blitz WB02 found this parameter to be or , depending on the method employed to calculate the H absorption. Heyer et al. HCSY04 found the record high value of for M33. However, is close to unity if we associate the SFR exclusively with the dense molecular component of the interstellar gas in galaxies WB02 ; GC04 ; KS05 .
It is evident that the coefficient of proportionality between the SFR and is not constant, and may, in turn, depend on other factors that vary with or time. In simulations of the evolution of star formation, these factors are usually taken into account either by including “young stars–gas” feedback, which regulates the SFR Tutukov06 ; FT94 , or by introducing simple analytical relations between the SFR and other local parameters that depend on the radial coordinate . Various authors have adopted for such parameters the surface density of the stellar and gaseous disks, angular velocity of the disk, velocity of gas entering the spiral arms, which depends on the difference of the tangential velocities of the disk rotation and the spiral pattern, the ratio of the gas density to the critical density for gravitational instability, and the rate of accretion of gas onto the galactic disk (see Kennicutt98 ; WB02 ; BP00 ; MK01 ; Bois03 and references in these papers). Our understanding of which factors actually play the most crucial roles in star formation is still poor.
Another unsolved problem related to the star-formation history is associated with the ages of the disks, or the time elapsed since the epoch of most intense star formation, which may be several billion years less than the ages of spherical stellar components. The comparison of the dependence between the central surface brightness of the disk and the relative mass of gas with models for the evolution of galaxy disks with monotonically varying SFRs led McGaugh and de Blok MB97 to conclude that the range of ages of galactic disks may reach several billion years. Boissier et al. BBPG01 concluded that low-mass galaxies have lower ages, since massive galaxies have lower relative amounts of gas and higher heavy-element abundances for the same SFEs. However, this conclusion was based on a simple model using the integrated parameters of galaxies averaged over the entire disk, and the fairly arbitrary assumption that the SFR is proportional to the product of and the angular velocity of rotation . It would be more correct here to consider that we are dealing with differences in the star-formation histories in the disks, rather than difference in the disk ages. Current SFRs combined with broadband color indices are quite consistent with the hypothesis that most galaxies of various luminosities have similar ages (10–15 Gyr; see, e.g., KNC94 ; buzzoni05 ).
Comparisons of the amount of observed gas in galaxies, SFRs, and the surface densities of stellar disks that have formed from the gas provide important information that can be used to associate the current SFE with the average SFE for the entire period of star formation, and estimate the possible contribution of accretion to the evolution of the gaseous medium. To this end, it is expedient to analyze the distribution of gas and the star-formation intensity in the disks of well-studied galaxies at various galactocentric distances.
In this paper, we analyze the four relatively nearby spiral galaxies with fairly active star formation: M33, M81, M100, and M101. Our adopted parameters for these galaxies are listed in Table 1, whose columns give (1) the name of the galaxy; (2) the adopted distance to the galaxy, ; (3) the disk inclination, ; (4) the semi-major axis of the /arcsec2 isophote; (5) the maximum galactocentric distance for which data are available for estimating the SFR; and (6) the morphological type of the galaxy. The galaxies considered do not have massive companions (although the shape of the spiral pattern of M101 may bear signs of the interaction of this galaxy with the surroundings) and have large angular sizes, enabling the use of IRAS brightness profiles despite the low resolution of the 100 m IRAS profile. It is also known the azimuthally averaged distributions of the atomic and molecular gas, the brightness distributions in various wavelength intervals, and the variations of the rotational velocity with galactocentric radius for all four galaxies.
| Galaxy | , Mpc | Type | |||
|---|---|---|---|---|---|
| 1 | 2 | 3 | 4 | 5 | 6 |
| M33 | 0.70 | SAcd | |||
| M81 | 3.63 | 59 | 13.45 | 11 | SAab |
| M100 | 17.00 | 27 | 3.7 | 4.2 | SABbc |
| M101 | 7.48 | 21 | 14.4 | 8.4 | SABcd |
The initial data for the galactic disks are listed in Table 2, whose columns give (1) the number of the galaxy; (2) and (4) the color index and central brightness used to calculate the mass of the disk; (3) the radial scale length of the brightness of the photometric disk; (5) the velocity of the spiral pattern for the adopted distances and inclination angles from Table 1; and (6) references for the galactic rotation curves employed.
| Galaxy | Color index | Brightness scale length | Central brightness | , km s-1 kpc | Rotation curves |
|---|---|---|---|---|---|
| 1 | 2 | 3 | 4 | 5 | 6 |
| M33 | Lauer | RegVog | RegVog | 17.7 Newton | Corb |
| M81 | Leda | Baggett | Baggett | 24.5 Westpfahl | STHTTKT99 |
| M100 | Beckman | de Jong | de Jong | 22.5 Hernandez | STHTTKT99 |
| M101 | Leda | Knapen | Knapen | 17.4 Elmegreen | STHTTKT99 |
Below we analyze the dependence of the SFRs on gas density and the kinematic parameters of the gaseous disk, in order to identify the conditions under which the mass of the disk, observed SFRs, and local values of the azimuthally averaged gas density can be compatible with each other for about the same (cosmological) age of the galaxies111Radial SFR profiles for the galaxies considered can also be found in earlier papers (see, e.g., HCSY04 for M33, Bois03 ; Buat89 for M81, WB02 ; Bois03 for M100, and WB02 for M101). The SFRs in these papers were estimated from data in a single wavelength interval: either H, UV, or far-IR data..
II ESTIMATION OF THE STAR-FORMATION RATES
Various methods have been used to estimate the SFR, all based on analyzing observational manifestations of young stars and comparing observational data with models for the stellar population (for a comparison of various methods, see, e.g., Kenn98 ; IgP04 . The most commonly used methods are those where the initial data are either surface brightnesses or luminosities of galaxies measured in emission lines (usually H), or the nonionizing part of the UV spectrum, or in the far infrared: FIR (40–120 m) or TIR (3–1100 m), since short-lived young stars in galaxies with ongoing star formation contribute most of their radiative energy in these spectral intervals222We performed the FIR to TIR translation using the bolometric correction adopted in DHCSK01 ..
The galaxy brightnesses in emission lines, the UV, and the far IR used as diagnostics of the SFR should not yield identical results, because the main contributions to the luminosities in these spectral intervals are provided by young stars of different ages (several million years for emission-line regions, several tens of million years for UV data, and yr for the far IR). However, this should not be important in the case of a smoothly varying SFR averaged over a sufficiently large region of the disk. The fact that all these methods are to some extent model dependent is a more important source of discrepancies in the results. However, the most serious problem is taking into account extinction at optical and UV wavelengths (especially given the concentration of the absorbing medium in star-formation regions) and the contribution of old stars to the TIR radiation. The extinction in H is usually determined from the relative intensities of the hydrogen lines (the Balmer decrement), but such estimates can be inaccurate, since they depend on both the optical properties of the absorbing dust and its distribution along the line of sight. Moreover, we have no prior knowledge of the fractions of the ionizing radiation that are absorbed by dust or escape from the disk, thereby not participating in the formation of lines. As a consequence, systematic differences can arise between SFR estimates obtained using different methods, as has been pointed out repeatedly by various authors STEBMD00 ; TM98 ; GBELC99 . Note also that SFR estimates based on emission-line intensities are very sensitive to the adopted form of the initial mass function (IMF) in the domain of the most massive gas-ionizing stars.
Allowing for extinction and the clumpiness of the brightness distribution is not likely to be a problem for the FIR (or TIR) radiation, however the radiation of cool dust whose heating is not due to young stars is difficult to take into account. The contribution of this radiation is small for galaxies with high or moderate star-formation rate, but can be important in galaxies containing almost no young stars. Finally, the accuracy with which of SFRs can be compared with the current amount of gas is limited by our (poor) knowledge of the IMF for low-mass stars, which provide the main contribution to the mass of the stellar disk. However, this is true of all methods used to estimate SFRs.
Nevertheless, correcting for extinction based on the FIR/UV ratio, independent estimates of the SFR using H and UV emission data yield results that are consistent to within a factor of three for galaxies with luminosities values differing by several orders of magnitude BBGB02 .
Following main ; BBGB02 ; HBI03 , we preferred for the galaxies considered here to use SFR estimates obtained from both UV and far-IR brightness measurements. This combined method assumes that all the energy absorbed in the UV is radiated in the far IR, so that the the UV/FIR ratio provides a quantitative criterion for this absorption. The results depend only slightly on the optical properties of dust or the spatial distributions of the dust and stars, making it stable with regard to details of the model (see IgP04 for a discussion of this issue). We used smoothed (up to ) UV brightness profiles and UV absorption estimates derived from the observed FIR/UV brightness ratios taken from Boissier et al. main , who adopted UV profiles based on measurements with a stratospheric telescope (FOCA). We adopted the radial gas-surface density profiles of Corb for M33, Rots (HI) and main (H2) for M81, main for M100, and WB02 for M101. Boissier et al. main determined the mass of molecular gas including the dependence of the conversion factor on the heavy-element abundance .
Following BBGB02 ; HBI03 , we write the SFR in the form
| (1) |
Here, is the fraction of UV photons that are not absorbed, based on the FIR/UV ratio, is the SFR derived from the intensity of UV radiation (near 2000 Å) in the absence of absorption, the coefficient of proportionality determined from the stellar-population model, and [erg s-1Å-1pc-2] the monochromatic luminosity in the 2000 Å line. The coefficient is equal to (/yr)/(erg s-1Å-1) BBGB02 for a model stellar population with a normal heavy-element abundance and Salpeter IMF in the interval 0.1–100 .
The resulting SFR estimates depend on the adopted IMF. One direct way to refine the IMF is to compare the observed and model mass-to-luminosity ratios for the stellar population. Comparing this ratio to the broadband color indices of galaxies, Bell and de Jong BdeJ01 concluded that the Salpeter IMF overestimates the mass by at least 30 due to overestimation of the number of low-mass stars. We take this into account when comparing the observed and calculated disk densities below.

Figure 1a shows radial profiles of the SFR per unit disk area. In all the galaxies, the SFR decreases with galactocentric distance. M33 and M100 exhibit the sharpest and smoothest decreases, respectively, consistent with the different radial scale lengths of their disks (Table 2). The star-formation intensity is highest in the central regions of M33 and M101 and the lowest in those of M81 and M100. Column 5 of Table 3 lists the SFRs integrated over the disk areas corresponding to (Table 1). (The other columns of Table 3 list the (1) galaxy number, (2) central density of the exponential disk estimated by modeling the rotation curve, and (3)–(4) integrated accretion rates inferred for the photometric and kinematic disk masses, respectively.)
| Galaxy | SFR | |||
|---|---|---|---|---|
| 1 | 2 | 3 | 4 | 5 |
| M33 | Corb | 0.3 | 0.3 | 0.4 |
| M81 | 660⋆ | 1.1 | 0.9 | 1.3 |
| M100 | 1070⋆ | 5.3 | 5.0 | 6.9 |
| M101 | 710⋆ | 3.6 | 3.54 | 4.6 |
⋆ Estimate obtained in this paper.
Our comparison of the SFR profiles with profiles calculated from the H-line brightness distribution MK01 using the relation HBI03
| (2) |
and allowing for the line absorption as a function of in accordance with main showed a satisfactory agreement (to within a factor of 1.5) between the two profiles, except for the 1–2 kpc central region and peripheral disk regions, where this method (UV FIR) always yields higher estimates.
Part of the far-IR flux is due not to young stars, but to older stars whose ages exceed yr. Like Hirashita et al. HBI03 , we use the radial profile of the fraction of the UV brightness absorbed, , to calculate the factor , equal to the fraction of the TIR flux due to heating of dust by old stars of the disk (Fig. 1b). As expected, the contribution of old stars is minimal in the galaxies with the highest star-formation intensities (M33 and M100). The factor lies in the range 0.3—0.7 for most regions in all four galaxies. For comparison, note that the average value estimated by Hirashita et al. HBI03 for galaxies with moderate SFRs is 0.40.
III STAR-FORMATION EFFICIENCY: RELATION TO OTHER PARAMETERS
The star-formation efficiency SFE (SFR per unit mass of gas) is determined by the relation
| (3) |
where the factor of 1.4 accounts for elements heavier than hydrogen.

The inverse of the SFE corresponds to the time scale for gas depletion (without allowance for gas returned to the interstellar medium)333This process can lengthen the gas-depletion time scale by a factor of two to three for galaxies with low fractions of remaining gas KNC94 .:
| (4) |
Figure 2 shows the distribution of SFE. The crosses indicate the adopted boundaries for the inner regions of galaxies, where the estimates are more uncertain. We define these inner (central) regions to have no clear spiral pattern and/or a size smaller than the smoothing scale, equal to RegVog , Westpfahl ; Schweizer , Hernandez , and Kenney for M33, M81, M100, and M101, respectively.
The SFR decreases with galactocentric distance throughout most of the disks in all the galaxies except M101. In this last galaxy, the monotonic decrease of the SFR begins only at kpc, where the brightest and most extended HII regions in the spiral arms are observed. M33 has the lowest SFE (except for its central region).
The SFR reflects the efficiency of various factors stimulating ongoing star formation. In generally accepted picture of star formation in galaxy disks, the following factors should be most important for the enhancement of this process:
– a high surface gas density at a given , which also means the opacity to ionizing radiation and UV radiation that destroys molecules;
– a high angular velocity of rotation of the disk HEB98 ;
– high velocity of gas relative to the spiral density wave that leads to gas compessing(far from the corotation);
– a high ratio of the surface gas density to the critical surface density for gravitational instability of the rotating gaseous layer;
– a high density of the stellar disk, which determines (for a given dispersion of velocities of the gas) the thickness and, consequently, the volume density of the gaseous disk, and also the density of the interstellar medium (see, e.g., Elm87 ).
We now use these four galaxies to analyze the dependence of the SFE on the factors counted above.
III.1 Dependence of SFE on Gas Surface Density

It follows from Fig. 3 that there is no single dependence between theese parameters for all four galaxies and, moreover on the whole, the quantities considered exhibit no clear correlations. However, M100 and M33 show an essentially monotonic increase of the SFE with the gas density over a wide range of ; i.e., the exponent of the Schmidt law for the disk exceeds unity, 444The increase of the SFE with in M33 can be seen only after smoothing of the curve. The almost vertical portion on the plot corresponds to the inner region of the galaxy with a radius of kpc..
The overall picture remains unchanged if we estimate the SFE using only the mass of molecular gas instead of the total mass of gas: all four galaxies show different behavior. Note that only one of the four galaxies (M100) contains a large amount of molecular gas. The SFR ratio in this galaxy systematically decreases with increasing surface density of H2, from the peripheral regions of the galaxy to the central molecular disk, which has a very high gas surface density. A similar conclusion about the decrease of the integrated value of this ratio with increasing fractional mass of molecular gas was obtained earlier in KasZas06 .
III.2 Dependence of the SFE on the Angular Rotational Velocity
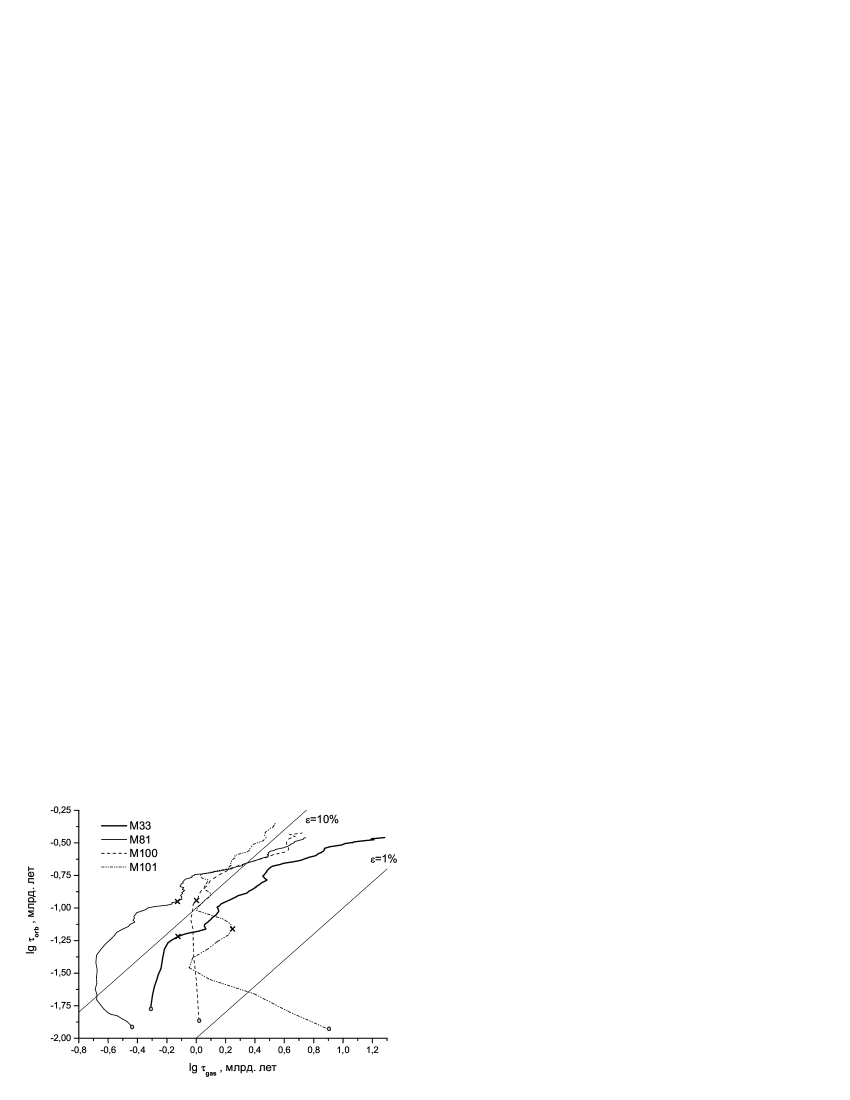
Arguments in the favor of such a relation can be found in the papers by Hunter et al. HEB98 and Kennicutt Kennicutt98 . According to the latter estimates, about 10 of the total gas mass is converted into stars during one revolution of the galaxy. For the sake of illustration, Fig. 4 compares quantities having the same dimensions: the rotational period, , and the gas-depletion time scale, . The gas-depletion time scales differ widely in different galaxies with the same rotational period. M33, M81, and M100 seem to show a monotonic increase in the gas-depletion time scale with increasing rotational period beyond their central regions (indicated by the crosses in the figures). However, this increase is nonlinear and nonmonotonic. The relationship between these two quantities in the inner region of M101 ( yr) shows instead the opposite behavior. On the whole, about 1–10 of the gas is converted into stars during each revolution of the galaxy at these galactocentric distances. The gas depletion is most rapid in M81 and M101, amounting to 15 of the gas per revolution at the galaxy periphery. Wong and Blitz WB02 , who, unlike us, estimated the SFRs from H brightness measurements, drew similar conclusions.
III.3 Dependence of the SFE on the Relative Linear Velocity of the Disk and the Spiral Pattern
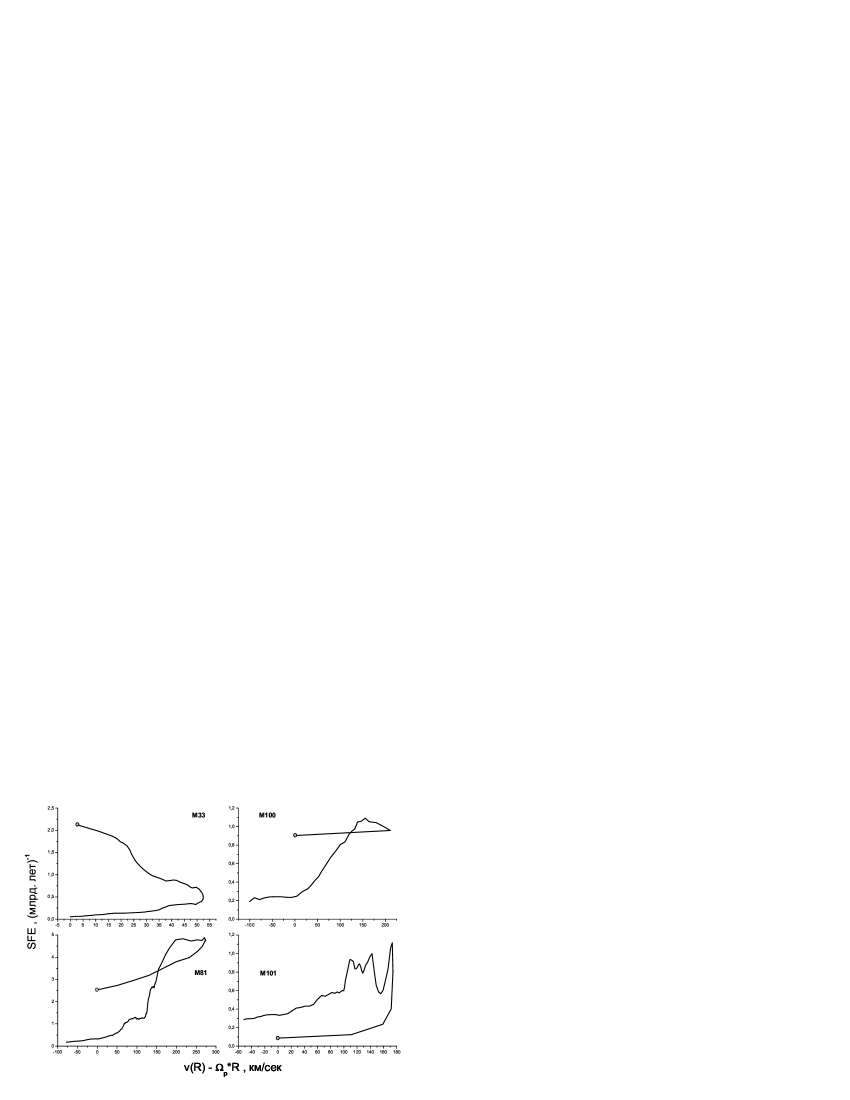
We determined this relative velocity as , where is the pattern speed of the density wave, so vanishes at the corotation radius , where . The pattern speeds for the four galaxies were measured by various authors; the values used below and the corresponding references can be found in Table 2. If the relative velocity were the key factor for star formation, the minimum SFE would be located at the corotation radius, and the SFE would increase on either side of the corotation radius, passing through a maximum in the inner region at , where the relative velocity of the pattern and the disk is maximum. In three of the four galaxies (M81, M100, and M101), the measurements cover regions beyond , and the SFE dependence does not fit the expectations (Fig. 5). This clearly demonstrates that the density wave imposes order on rather than triggers star formation: the increase in the SFE in the spiral arms, which can be important (see, e.g., LY90 ), is compensated by its decrease in inter-arm regions.
The situation in M33 supports this conclusion. In this galaxy, the SFE increases with distance from the corotation radius to the very center, despite the fact that should decrease in the central region due to the decrease of the linear rotational velocities of both the disk and spiral pattern.
III.4 The Role of Gravitational Instability of the Gaseous Layer
At a certain surface density, , which depends on the kinematic parameters of the disk, the gaseous layer, becomes gravitationally unstable on scale lengths of several kpc. The growth of instability can result in the formation of gas complexes, with subsequent star formation. We have for a thin gaseous layer:
| (5) |
where km/s is the one-dimensional velocity dispersion for the gaseous clouds and is the Toomre dimensionless stability parameter. According to the estimates of Martin and Kennicutt MK01 , the observed sharp decrease of the SFR at a definite galactocentric distance corresponds to km/s.
Weak star formation is known to occur even in regions where the average gas surface density is certainly lower than the critical surface density (in low surface brightness galaxies, lenticular galaxies, and at the peripheries of spiral galaxies). Therefore, the condition (or approximate equality of these quantities) is not required for star formation. A role for gravitational instability is, nevertheless, supported by the observational data: despite the approximate nature of estimates, the gas surface densities at different galactocentric distances in spiral galaxies usually differ from the critical density by no more than a factor of two in either sense, and star formation almost ceases in regions where the gaseous disk is certainly stable, say, at the periphery of the disk (see ZasSmir05 ; WB02 ; MK01 for a discussion).
Figure 6 shows the dependence of the SFE on the ratio . Note, however, that regions with that are far from the center remain uncovered by the data. None of the four galaxies shows a systematic increase in the SFE with increasing azimuthally averaged . We conclude that, in the range of considered, this ratio has only a weak effect on the SFE. Moreover, regions with low can be characterized by a high SFE, but this is due not to intense star formation, but instead due to low gas density. In this regions the birth of stars is triggered by other factors that are not associated with large-scale gravitational instability. However, a quantitative analysis of the role of instability requires a more refined approach and, in particular, allowance for the inhomogeneity of the gaseous disk and the presence of the stellar disk, which also affects the stability Bois03 .
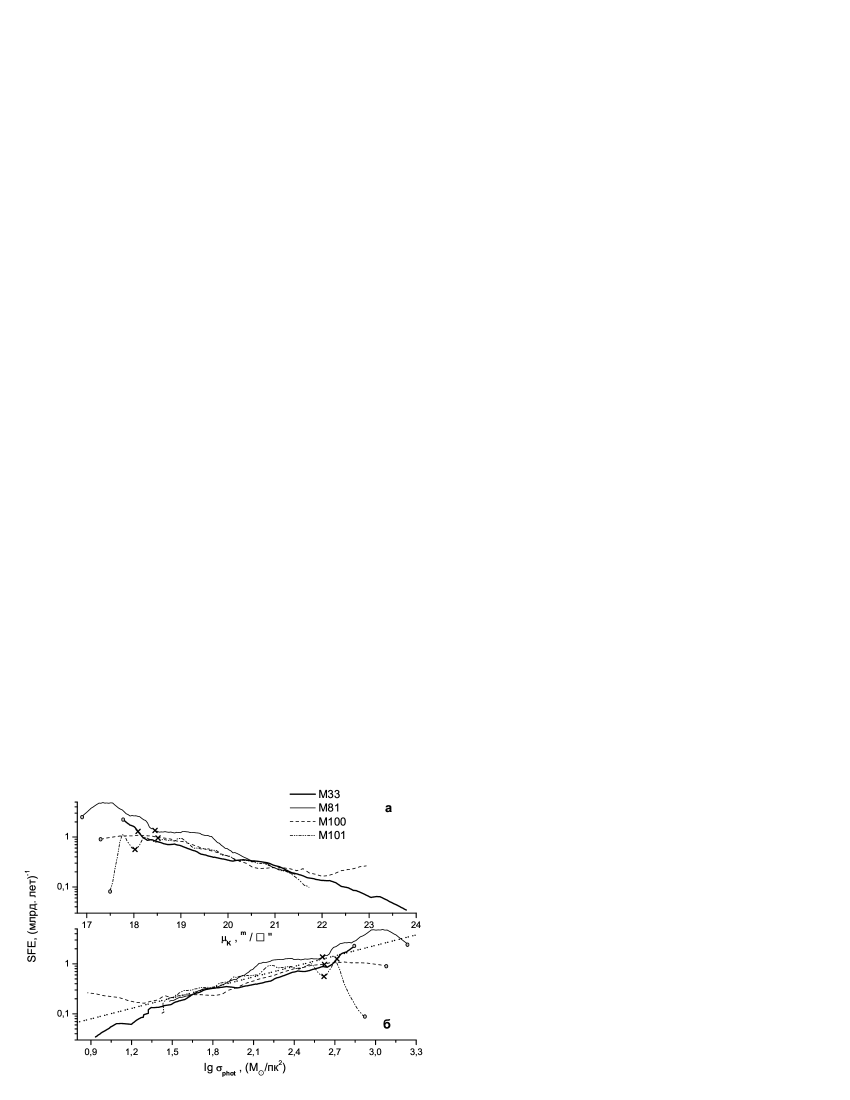
III.5 Dependence of the SFE on the Azimuthally Averaged Brightness (Density) of the Stellar Disk
Figure 7a compares the SFEs and the smoothed surface brightnesses of the disks, described by a simple exponential dependence on (in mag/arsec2). Apart from in their central regions, all the galaxies show a decrease in the SFE with decreasing surface brightness and, obviously, with decreasing density of the stellar disk, . Figure 7b compares the SFE and the surface density of the disk estimated from the -band brightness distribution and the ratio , which depends on the color indices of the galaxies (Table 2) in accordance with the models for the evolution of the stellar systems BdeJ01 555We calculated the radial -band brightness profile for 81 from the radial profile for ..
It is striking that the SFE() dependence outside the central regions is virtually the same for all four galaxies over a wide range of surface densities, . In other words, the SFE there is determined by the surface density of the disk, and is higher the denser the stellar disk666Earlier, Bell and de Jong BdeJ00 also analyzed the relationship between the star-formation history and the brightness (density) of the disk. Sea also Dopita and Ryder DR94 and Boisier et al. Bois03 who used the empirical dependence of the SFR on the product of the surface densities of the gas and disk to appropriate powers..
The outer, more tenuous regions of disks rotate more slowly, suggesting that the gas-depletion time scale, which is inversely proportional to the SFE, should increase with the rotational period, , as we can see from the observations (Fig. 4). The straight line in Fig. 7b corresponds to the relation
| (6) |
The average deviation of from this relation is about 0.3 in the interval of mentioned above.
We believe that characterizes the surface density of the stellar disk, , so that the equation (6) is equivalent to the dependence , which reflects the influence of the disk density on the ongoing star formation.
The decrease of the SFE with decreasing surface density of the disk, especially in the outer regions of the galaxies, may be associated with two factors. First, the decrease in the density of the stellar disk results in an increase in the thickness of the gaseous layer in it, since the potential well produced by the disk becomes increasingly “shallower”. As a consequence, the volume density and pressure of the gas decrease. The growth of the thickness of the gaseous layer is most rapid in the outer regions of the Milky Way, in accordance with the expected balance of forces determining the equilibrium of this layer NJ02 . The second, fairly obvious, factor is the decrease in the inflow of gas ejected by evolved stars, which compensates at least partially for the consumption of gas by star formation, especially if the surface density of gas is much lower than that of the stellar disk.
Note that the similarity of the dependences of the SFE and disk surface brightness is lost completely if we use the density of the molecular component of the gas instead of the total gas density.
IV THE STAR-FORMATION HISTORY
IN THE DISK
If the SFE is primarily determined by the surface density of the disk, this raises the question of how the observations fit the simplest model, in which both the total surface density of the disk and the SFE are time independent and vary only with radius. The low accuracy of SFE estimates even for well-studied galaxies (no better than within a factor of two) prevents reliable estimation of the masses of stars born during past epochs based on the current amount of gas, but this does not remove the need to test the consistency of SFE estimates with the kinematically or photometrically determined disk densities.

We first use an extremely simplified (“toy”) model with no accretion and no radial motion of gas, with most of the gas ejected by previous generations of stars being returned to the interstellar medium before the mass of the remaining gas changes significantly (the approximation of instanteneous gas return). This assumption is based on model estimates, which indicate that most of the gas lost by stars of a single generation returns to the interstellar medium during the first one to two billion years KNC94 ; NO06 , but may not be applicable if the fraction of gas in the disk is too small KNC94 .
Note that the gas in galaxy disks usually exhibits no systematic radial motions (disregarding galaxies with massive bars or interacting galaxies): measurements made for several nearby galaxies yielded only lower limits of several km/s for the radial velocities WBB04 .
If we specify to be the time when the disk was entirely gaseous (the beginning of the evolution) and neglect variations of the SFE with time, the decrease in the relative gas content at a given can be described by the simple law
| (7) |
where is the total density of the stellar and gaseous disk and is the fraction of gas returned by stars to the interstellar medium. The available estimates usually yield , depending on the stellar IMF employed KNC94 ; NO06 ; JCP01 . At , where yr is the age of the disk (see the Introduction), the model must explain the current disk density at a given starting from the observed density of gas and estimated SFEs.
In the general case, the total surface density of the disk is
| (8) |
We determined the observed surface densities of the stellar disks using both modeling of the rotation curve and the photometric parameters of the disk, as described in the previous section.
For M33 we adopted the density distribution inferred from the rotation curve taken from Corb , and used the best-fit model including the stellar and gaseous disks and a dark halo, with the component masses scaled to the adopted distance (0.7 Mpc). For the three remaining galaxies, we constructed three-component kinematic models, each including a King bulge, thin disk with an exponential density decrease and the radial scale set equal to the photometric radial scale to within 10–15 (Table 2), and a dark halo with a quasi-isothermal volume-density profile. We determined the disk parameters from the best fit to the rotation curve, and although these are not completely free from the effects of ambiguity in the component masses, a fixing of the radial scale for the density variations considerably narrows the interval of possible component masses.
Figure 8 compares the expected disk density, , derived for the simplified model with the given (R) and SFE and with , and the density distributions derived photometrically and kinematically from the observations. Here, we set the fraction of mass ejected by stars to , although a quick check showed that changing this fraction to has no significant effect on the overall picture obtained. As an example, Fig. 8 shows the radial profile of the disk density for M33 calculated with . Given the approximate nature of the estimates, we conclude that, with , the estimated disk densities for the simplified model are consistent with the density measurements in the outer regions, but yield unacceptably overestimated densities for the inner parts of the disks. We show below that this discrepancy disappears in the case of moderate gas accretion rates. If we, nevertheless, assume that the exponent in the Schmidt law exceeds unity, , then the disk density extrapolated back to 10 Gyr is too high (Fig. 8, the “dash double-dot” line for each of the galaxies), since in this case the SFR in the past must be significantly higher than for . Therefore, the condition is incompatible with this simple model for the evolution, and requires the SFE to be significantly lower in the past than at the present epoch for the bulk of the disk stars777Gallagher et al.gallagher84 were the first to deduce the slow variation of the integrated SFR, which is difficult to reconcile with the Schmidt law..
It is easy to verify that, even if we assume that the SFE in the four galaxies is overestimated by a factor of two, the resulting estimates for the disk density in the inner regions of the galaxies remain unrealistically high.
This discrepancy can be removed if we introduce into our model the accretion of gas onto the disk, which slows the decrease in the amount of gas with time. Accretion certainly played an important role in the initial stages of formation of the galactic disks, but its role in the subsequent evolution is poorly studied. We have both direct and indirect evidence for ongoing accretion onto the galactic disks (see, e.g., the discussion of this issue in NO06 ; BBCPB02 ). It is important that even low accretion rates of yr can appreciably compensate the loss of gas to star formation. Of the four galaxies considered, the effect of accretion is most obvious in the inner region of M81, where the high SFE (Fig. 2), due to the low gas density, implies a gas-depletion time scale of only 200–500 Myr if no gas is fed back to the disk.

The accretion of interagalactic gas plays the same role as the accretion of gas ejected by long-living stars of the disk or bulge. The latter accretion enables the gas-depletion time scale in galaxies with low gas contents to appreciably exceed KNC94 . Despite the overall similarity of the two accretion processes, accretion “from outside”, unlike “internal accretion”, increases the total mass of the disk and constrains the growth of the heavy-element abundance in the gas.
Let us now estimate the maximum accretion rates for the four galaxies that make the model disk surface density close to the observational disk density estimates.
Let the SFR per unit disk area at a given galactocentric distance be equal to SFR , where is the coefficient of proportionality, which, in general, varies with . The equation relating the SFR, gas density, and accretion rate has the form
| (9) |
Here, as above, is the fraction of gas returned by stars and Accr is the accretion rate. The variables in this equation can be separated:
| (10) |
This equation has a simple analytical solution only when . In this case, is equal to the star-formation efficiency.
The solution for the total mass of stars born has the form
| (11) |
where is the age of the disk and the accretion rate is assumed to be time independent. It follows that
| (12) |
The expression inside the modulus signs can be either positive or negative, although the two solutions differ little in the case in which we are interested, when the model estimate of the disk density obtained neglecting accretion significantly exceeds the observed density. The maximum accretion rate corresponding to negative values of the expression inside the modulus signs is
| (13) |
We will now use this equation to estimate for all four galaxies the accretion rate for which the model disk density at any radius is equal to the observed density derived from photrometric data or the rotation curve. Figure 9 shows a comparison of this accretion rate and SFR.
Table 3 lists the corresponding integrated rates of gas accretion onto the galaxy within (Table. 1). It follows from (9) that, when the accretion rates are close to the SFRs, the observed disk densities can be explained by a simple model. Note that the need for accretion is not obvious for the outer regions of the galaxies.
The fact that integrated accretion rate and SFR are close to each other (Table 3) is not just a coincidence: this follows from the adopted model with . The observed disk densities and the condition , or equivalently the increase in the SFR with increasing gas density, are more difficult to reconcile. In this case, we must assume that either the SFE was significantly lower in the past than at present, despite the higher gas density (i.e., the condition was not satisfied during the epoch of formation of the bulk of the disk), or the age of the inner regions is appreciably lower than the cosmological age. At the same time, our overall picture of the evolution of the gas content in the disk becomes self-consistent if we suppose that the exponent in the Schmidt law does not exceed unity at all galactocentric distances. In this case, the surface densities in the outer regions of galaxies can be satisfactorily explained using a simple conservative model. The integral estimates obtained for the current star formation appear to result from comparing the SFR and gas density at different galactocentric distances, where other factors affecting the SFR apart from the gas density come into play, so that can no longer be considered to be local.
To summarize, we emphasize that in none of the galaxies considered did the Schmidt law, defined as the relation between the distributions of the SFR and , result in good agreement with the observations. This could be due to the effect of various factors influencing star formation at different galactocentric distances. Indeed, the evolution of the gaseous component should have different behavior in the inner part of the disk, with radii of several kpc, and in the regions located farther from the center. The gas content in the outer regions of the galaxies can be described satisfactorily using a model with a time-independent SFE for local disk density, but the evolution in the inner disk regions is more complex that cannot be reproduced in a conservative model without allowance for the accretion of gas onto the disk and/or radial motion of the gas. In this case, an exponential law for the decrease in the SFR proves to be inapplicable.
Note that a similar situation that requires inclusion of the accretion of gas also arises during modeling of the evolution of the disk in our own Galaxy. In the evolutionary model of Naab and Ostriker NO06 , where the SFE was taken to be fixed at a given galactocentric distance (and equal to 10 of the disk rotational period), the “global” SFR and accretion rate do not decrease exponentially with time, but vary slowly and remain close to each other over the past several billion years. This model agrees well with available estimates of the surface density of the stellar disk and gaseous layer in the solar neighborhood.
V ACKNOWLEDGMENTS
We are grateful to A.V. Tutukov for discussions of this work. This work was supported by the Russian Foundation for Basic Research (project code no. 04-02-16518).
References
- (1) S. Boissier, A. Boselli, V. Buat, et al., Astron. Astrophys. 424, 465 (2004).
- (2) . A. W. Verheijen and R. Sancisi, Astron. Astrophys. 370, 765 (2001).
- (3) S. Boissier, A. Boselli, N. Prantzos, and G. Gavazzi, Mon. Not. R. Astron. Soc. 321, 733 (2001).
- (4) A. V. Zasov and A. V. Smirnova, Pis’ma Astron. Zh. 31, 178 (2005) [Astron. Lett. 31, 160 (2005)].
- (5) M. Schmidt, Astrophys. J. 129, 243 (1959).
- (6) A. S. Tutukov, Astron. Rep. 50, 439 (2006).
- (7) R. C. Kennicutt, Astrophys. J. 498, 541 (1998).
- (8) V. Buat, J. M. Deharveng, and J. Donas, Astron. Astrophys. 223, 42 (1989).
- (9) T. Wong and L. Blitz, Astrophys. J. 569, 157 (2002).
- (10) M. H. Heyer, E. Corbelli, S. E. Schneider, and S. S. Young, Astrophys. J. 602, 723 (2004).
- (11) Yu Gao and P. M. Solomon, Astrophys. J., Suppl. Ser. 152, 63 (2004).
- (12) S. Komugi, Y. Sofue, H. Nakanishi, et al., Publ. Astron. Soc. Jpn. 57, 733 (2005).
- (13) C. Firmani and A. V. Tutukov, Astron. Astrophys. 288, 713 (1994).
- (14) S. Boissier and N. Prantzos, Mon. Not. R. Astron. Soc. 312, 398 (2000).
- (15) C. L. Martin and R. C. Kennicutt, Astrophys. J. 555, 301 (2001).
- (16) S. Boissier, N. Prantzos, A. Boselli, and G. Gavazzi, Mon. Not. R. Astron. Soc. 346, 1215 (2003).
- (17) S. S. McGaugh and W. J. G. de Blok, Astrophys. J. 481, 689 (1997).
- (18) R. C. Kennicutt, H. Tamblyn, and C. W. Congdon, Astrophys. J. 435, 22 (1994).
- (19) A. Buzzoni, Mon. Not. R. Astron. Soc. 361, 725 (2005).
- (20) T. Lauer, S. Faber, E. Ajhar, C. Grillmair, and P. Scowen, Astron. J. 116, 2263 (1998).
- (21) M. W. Regan and S. N. Vogel, Astrophys. J. 434, 536 (1994).
- (22) K. Newton, Mon. Not. R. Astron. Soc. 190, 689 (1980).
- (23) E. Corbelli, Mon. Not. R. Astron. Soc. 342, 199 (2003).
- (24) http://leda.univ-lyon1.fr/.
- (25) W. E. Baggett, S. M. Baggett, and K. S. J. Anderson, Astrophys. J. 116, 1626 (1998).
- (26) D. J. Westpfahl, Astrophys. J., Suppl. Ser. 115, 203 (1998).
- (27) Y. Sofue, T. Tutui, M. Honma, et al., Astrophys. J. 523, 136 (1999).
- (28) J. E. Beckman, R. F. Peletier, J. H. Knapen, et al., Astrophys. J. 467, 175 (1996).
- (29) R. S. de Jong, Astron. and Astrophys., Suppl. Ser. 118, 557 (1996).
- (30) O. Hernandez, H. Wozniak, C. Carignan, et al., Astrophys. J. 632, 253 (2005).
- (31) J. H. Knapen, R. S. de Jong, S. Stedman, et al., Mon. Not. R. Astron. Soc. 344, 527 (2003).
- (32) B. G. Elmegreen, D. M. Elmegreen, and L. Montenegro, Astrophys. J., Suppl. Ser. 79, 37 (1992).
- (33) V. Buat, Astron. Astrophys. 220, 49 (1989).
- (34) R. C. Kennicutt, Ann. Rev. Astron. Astrophys. 36, 189 (1998).
- (35) J. Iglesias-Paramo, V. Buat, J. Donas, et al., Astron. Astrophys. 419, 109 (2004).
- (36) D. A. Dale, G. Helou, A. Contursi, et al., Astrophys. J. 549, 215 (2001).
- (37) M. Sullivan, M. A. Treyer, R. S. Ellis, et al., Mon. Not. R. Astron. Soc. 312, 442 (2000).
- (38) L. Tresse and S. J. Maddox, Astrophys. J. 495, 691 (1998).
- (39) K. Glazebrook, C. Blake, F. Economou, et al., Mon. Not. R. Astron. Soc. 306, 843 (1999).
- (40) V. Buat, A. Boselli, G. Gavazzi, and C. Bonfanti, Astron. Astrophys. 383, 801 (2002).
- (41) H. Hirashita, V. Buat, and A. K. Inoue, Astron. Astrophys. 410, 83 (2003).
- (42) A. H. Rots, Astron. Astrophys. 45, 43 (1975).
- (43) E. F. Bell and R. S. de Jong, Astrophys. J. 550, 212 (2001).
- (44) F. Schweizer, Astrophys. J., Suppl. Ser. 31, 313 (1976).
- (45) J. D. P. Kenney, N. Z. Scoville, and C. D. Wilson, Astrophys. J. 366, 432 (1991).
- (46) D. A. Hunter, B. G. Elmegreen, and A. L. Baker, Astrophys. J. 493, 595, (1998).
- (47) B. G. Elmegreen, Astrophys. J. 338, 178 (1987).
- (48) A. V. Kasparova and A. V. Zasov, Astron. Zh. (2006) (in press).
- (49) S. D. Lord and J. S. Young, Astrophys. J. 356, 135 (1990).
- (50) E. F. Bell, and R. S. de Jong, Mon. Not. R. Astron. Soc. 312, 497 (2000).
- (51) M. A. Dopita and S. D. Ryder, Astrophys. J. 430, 163 (1994).
- (52) C. A. Narayan and C. J. Jog, Astron. Astrophys. 394, 89 (2002).
- (53) T. Naab and J. P. Ostriker, Mon. Not. R. Astron. Soc. 366, 899 (2006).
- (54) T. Wong, L. Blitz, and A. Bosma, Astrophys. J. 605, 183 (2004).
- (55) B. Jungwiert, F. Combes, and J. Palous, Astron. Astrophys. 376, 85 (2001).
- (56) J. S. Gallagher III, D. A. Hunter, and A. V. Tutukov, Astrophys. J. 284, 544 (1984).
- (57) D. L. Block, F. Bournaud, F. Combes, et al., Astron. Astrophys. 349, 35 (2002).