Age and Metallicities of Cluster Galaxies: A1185 and Coma
Abstract
We present age and metallicities determinations based on narrow band continuum colors for the galaxies in the rich clusters A1185 and Coma. Using a new technique to extract luminosity-weighted age and [Fe/H] values for non-star-forming galaxies, we find that both clusters have two separate populations based on these parameters. One population is old ( 11 Gyrs) with a distinct mass-metallicity relation. The second population is slightly younger ( 9 Gyrs) with lower metallicities and lower stellar masses. We find detectable correlations between age and galaxy mass in both populations such that older galaxies are more massive and have higher mean metallicities, confirming previous work with line indices for the same type of galaxies in other clusters (Kelson et al. 2006, Thomas et al. 2005). Given the previously discovered correlation between galaxy mass and /Fe abundance (a measure of the duration of initial star formation, Denicolo et al. 2005, Sanchez-Blazquez et al. 2006), we interpret our age-metallicity correlations to imply that cluster galaxies are coeval with varying durations for their initial bursts. Our results imply shorter durations for higher mass galaxies, in contradiction to the predictions of classic galactic wind models. Since we also find a clear mass-metallicity relation for these galaxies, then we conclude that star formation was more efficient for higher mass galaxies, a scenario described under the inverse wind models (Matteucci 1994). With respect to cluster environmental effects, we find there is a significant correlation between galaxy mean age and distance from the cluster center, such that older galaxies inhabit the core. This relationship would nominally support hierarchical scenarios of galaxy formation (younger age in lower density regions); however, environmental effects probably have larger signature in the sample and present-day galaxies are remnants from an epoch of quenching of initial star formation, which would result in the same age gradients.
1 INTRODUCTION
The key to understanding the star formation history of galaxies is determining the age of their underlying stellar populations and the amount chemical evolution that those populations have undergone. Historically, these issues have been addressed separately and by morphological type. For example, early-type galaxies are considered have the simplest modes of star formation, the oldest ages (i.e. primordial) and relatively passive evolution as indicated by their similarity in color, morphology and kinematic properties (Bernardi et al. 2003, Tremonti et al. 2004, Cool et al. 2006, Smolcic et al. 2006). Very little current or recent star formation (Bernardi et al. 2001), plus low amounts of molecular gas (Huchtmeier, Sage & Henkel 1995), reinforces the hypothesis that a majority of their stars have their origin at high redshift (Larson 1975, Kodama et al. 1998, Jimenez et al. 1999, van Dokkum & Stanford 2003).
Work on the star formation history of galaxies is dominated by studies of rich clusters because 1) they are located in the same region of position and velocity space easing observational constraints, 2) they are easily detected in surveys at large redshift and are useful signposts for the study of evolutionary effects and 3) they are impacted by similar, if not complicated, environmental effects. Since rich clusters are dominated by elliptical and S0 galaxies, then they are ideal laboratories for the understanding of the simplest systems, but the discovery of the Butcher-Oemler effect (Butcher & Oemler 1984, Poggianti 2004) means that rich clusters are also interesting arenas to study starburst phenomenon.
Tracers of age and metallicity in even simple systems, such as cluster ellipticals, are complicated by the fact that, unlike globular clusters, the stellar populations in ellipticals, are a mixture of stars of many ages at various stages of chemical evolution (see studies that resolve the stellar populations in ellipticals by HST, Gregg et al. 2004). This means that any information obtained on galaxies, outside the resolution range of space imaging, will be luminosity weighted and observational constraints are such that these data must be interpreted using the guidance of star formation models. While model guided results always run the gamut of dependences on various assumptions, the range of galaxy types and lookback time has successful allowed a critical examination of these assumptions (Renzini 2006). In addition, the star formation and chemical evolution histories of galaxies can be examined through the use of many parameters based on their integrated light (e.g. broadband colors versus line spectroscopy), each providing their own unique picture of the underlying stellar populations.
The determination of a galaxy’s age and metallicity (meaning not only the mean quantities, but the distribution of age’s and metallicities within a galaxy’s stellar population) is an observationally intense problem and suffered in early studies from the problem that broadband colors are coupled with respect to age and metallicity (the so-called age-metallicity degeneracy problem, see Worthey 1999). However, in the last decade, three approaches have successful broken the age-metallicity degeneracy. The first is the use of colors across a wide wavelength region (e.g. far-UV to near-IR, see Kaviraj et al. 2006) which bridges regions of the spectrum sensitive to many different regions of the HR diagram. The second method is to use various spectral features sensitive to age and metallicity in a semi-independent manner (Gonzalez 1993). Semi-independent in a fashion that meaningful values can only be extracted by comparison to stellar population models. There is nothing new to the use of models to determine stellar population parameters, for example, globular cluster ages can only be extracted by comparison to stellar evolution tracks. But an additional complications arises in that the stellar populations in galaxies are neither homogeneous in age nor metallicity (if our own Galaxy is a typical example). The third technique is the one pioneered by our team using narrow band filters combined with a robust principal component analysis (PCA) of multi-color space derived from spectroevolutionary (SED) models (Rakos & Schombert 2005a). This technique makes use of the effects of age and metallicity on the continuum emission resulting from the integrated light of the underlying stellar population.
For the past decade, the technique of choice to determine age and metallicity in galaxies has been judicious choice of certain spectral line indices (i.e. the Lick sequence, Worthey & Ottaviani 1997, Trager et al. 2000). These studies sample particular lines sensitive to metallicity (e.g., Fe and Mg) combined with other couplets to find age (e.g. the Balmer lines). The grid of age and [Fe/H] is model dependent, but the two values are distinct and have a solvable degeneracy problem. While line measurements would appear, at first glance, to be a superior technique since their are actually measuring the parameters to investigate the chemical evolution of stellar populations (e.g. Fe, Mg), line strengths do suffer a number of disadvantages. Increased information on various lines paints a confusing picture. For example, Fe strengths show very little dependence on galaxy mass (Fisher, Franx & Illingworth 1997), in contrast to expectations from the color-magnitude relation. There are sharp dependences between elements, such as Ca and Mg, and the main source of free electrons in stellar photospheres, Fe. For example, Sanchez-Blazquez et al. (2006b) find no correlation between age and metallicity when the Mg2 index is used, but clear correlations are found with Ca or Fe indices. This leads to difficulties in forming an overall picture of galaxy formation as any model of stellar populations does not necessarily desire the value of individual elements as input parameters, but rather their combined effect on stellar atmospheres as this reflects into their position on the HR diagram.
Recently, the values for galaxy age extracted from the Lick technique has come in conflict with age determination by other methods. Numerous studies of cluster ellipticals using the Lick system that find many examples of ellipticals with relatively young mean ages (less than 6 Gyrs, Sanchez-Blazquez et al. 2006). In contrast, our previous work using continuum colors, flux values determined from regions of the near-blue portion of a galaxy’s spectra, find very few ellipticals with ages less than 10 Gyrs. And recently, ellipticals have also been determined to have old ages in a study using far-IR indicators of age (Bregman, Temi & Bregman 2006). Some of age dispersion may be due to contributions from small amounts of young stars, significant in their effect on colors, but minor in their fraction compared to the total stellar population (i.e., the ‘frosting’ effect, Trager et al. 2000). However, again, this will be an advantage for integrated continuum colors which more fully take into account the whole stellar population in a galaxy and will not suffer from aperture effects that may distort spectral estimates.
The dispersion in ages for cluster galaxies is a major inhibitor in determining the correct scenario for galaxy formation and evolution. While a range of ages can be supported by various methods of galaxy formation, purely old galaxy ages imply high redshifts for galaxy formation and relatively simple evolutionary scenarios. To further explore the issue of galaxy age, we developed a technique parallel to line indices work that focuses on the continuum region of the spectra around 4000Å. We have refined our calculations of age and metallicity from our narrow band colors and incorporated a robust technique to determine those values from the data (see Rakos & Schombert 2005a). This paper will apply these new methods to examine the history of galaxies in a nearby rich cluster, A1185, as compared to our typical rich cluster for extragalactic studies, Coma. Our goal is to further refine the spectrophotometric classification of galaxies on our system and determine the age and metallicity properties of cluster galaxies with respect to their stellar mass and cluster environment.
2 OBSERVATIONS
The rich cluster A1185 is a Bautz-Morgan type II cluster with a richness class of 1. It is located at a redshift of 0.033 and is approximately 80 arcmins in diameter. A1185 is a dynamically young cluster based on its projected density and velocity distribution. It composed of several distinct (spatially as well as kinematically) subgroups and a core which has several subclumps (Mahdavi et al. 1996). Our photometry includes only those galaxies on the region that is one Mpc in radius centered at the x-ray luminosity peak. This region also contains the top 10 brightest cluster members and will, presumable, become the cluster core when virialization is complete. A1185 was observed on 08 Jan 2005, using the 2.3m Bok telescope of the Steward Observatory located at Kitt Peak Arizona. The image device was 90prime, a prime focus wide-field imager using a mosaic of four 4k by 4k CCDs resulting in a field of view of 1.16 by 1.16 degrees and a plate scale of 0.45”/pixel (Williams et al. 2004).
The filter system, a modified Strömgren () system, was the same as used in our distant cluster studies (Rakos & Schombert 1995). Five exposures of 600 secs were made in each filter centered on NGC 3552. Calibration was obtained through a number of spectrophotometric standards measured on each night. The modified Strömgren system (herein called ) is altered in the sense that the filters are slightly narrower (by 20Å) and the filter is shifted 30Å to the red in its central wavelength as compared to the original system. The system we use herein is called the system to differentiate it from the original system since our filters are specific to the rest frame of the cluster that is being studied. The system covers three regions in the near-UV and blue portion of the spectrum that make it a powerful tool for the investigation of stellar populations in SSP’s (simple stellar population), such as star clusters, or composite systems, such as galaxies. The first region is longward of 4600Å, where in the influence of absorption lines is small. This is characteristic of the and filters ( = 4675Å and 5500Å), which produce a temperature color index, . The second region is a band shortward of 4600Å, but above the Balmer discontinuity. This region is strongly influenced by metal absorption lines (i.e. Fe, CN) particularly for spectral classes F to M, which dominate the contribution of light in old stellar populations. This region is exploited by the filter (Å). The third region is a band shortward of the Balmer discontinuity or below the effective limit of crowding of the Balmer absorption lines. This region is explored by the filter (Å). All the filters are sufficiently narrow (FWHM = 200Å) to sample regions of the spectrum unique to the various physical processes of star formation and metallicity (see Rakos et al. 2001 for a fuller description of the color system and its behavior for varying populations).
The reduction procedures have been published in Rakos, Maindl & Schombert (1996) and references therein. The photometric system is based on the theoretical transmission curves of filters (which can be obtained from the authors) and the spectra of spectrophotometric standard stars published in the literature (Massey & Gronwall, 1990). The convolution of the transmission curves and the spectra of the standard stars produces theoretical flux values for color indices of the standard stars corrected for all light losses in the equipment and the specific sensitivity of the CCD camera. Magnitudes were measured on the co-added images using standard IRAF procedures and are based for brighter objects on metric apertures set at 32 kpc for cosmological parameters of km s-1 Mpc-1 and the Benchmark cosmology (, ). For fainter objects, the apertures were adapted to deliver the best possible signal to noise ratio, but always using the same aperture for all four filters. Color indices are formed from the magnitudes: , , , and []. There is a small, but measurable galactic extinction in the region around A1185 ( mag), which corresponds to , and . While these corrections were made to all the datasets, their effect on the age and metallicity results (below) were negligible and are dominated by other sources of error. Typical errors were 0.03 mag in at the bright end of the sample and 0.08 mag at the faint end.
After applying our photometric membership criteria to remove foreground and background galaxies (see Rakos et al. 1991 for a full description of the procedure) there remained 192 galaxies ranging from the brightest at (NGC 3550) to a completeness limit of 20 mag. Of those 192, 53 had known redshifts and all 53 galaxies were cluster members (meaning their redshifts were within 1000 km/sec of the cluster mean redshift). This confirms the high reliability of our photometric membership technique, as discussed in our previous papers. Six galaxies in our sample display radio emission and one galaxy is a LINER. Our photometry system uses filters that avoid strong emission lines of star formation or LINER activity, plus our colors are based on integrated colors where the stellar population dominates over any nuclear emission. This is demonstrated by our colors for the above mentioned galaxies which are normal elliptical types under our photometric classification methods.
3 DISCUSSION
3.1 Colors and Photometric Morphology
The three colors (, and ) and the index () for all 192 galaxies in A1185 are displayed in Figure 1. This diagram is the main diagnostic tool for interpreting the narrow band colors. It has the advantage of demonstrating that the continuum colors of galaxies is a relatively simple, to first order, distribution over a range of Hubble types. The distribution of colors in Figure 1 is extremely well correlated, although the typical error is less than the width of the correlation. Changes in metallicity are a linear relation in color space (for a constant age, see solid line for a 13 Gyr population), thus, the scatter about a mean relationship suggests the effects of age for the red population (see below) and recent star formation for the blue population. As noted by Smolcic et al. (2006), the narrow band colors of galaxies are nearly a one parameter family and that the locus width in principal component space is well explained by simple star formation models. These colors are also strongly correlated with spectral indices, even emission lines, which track the current and recent star formation histories.
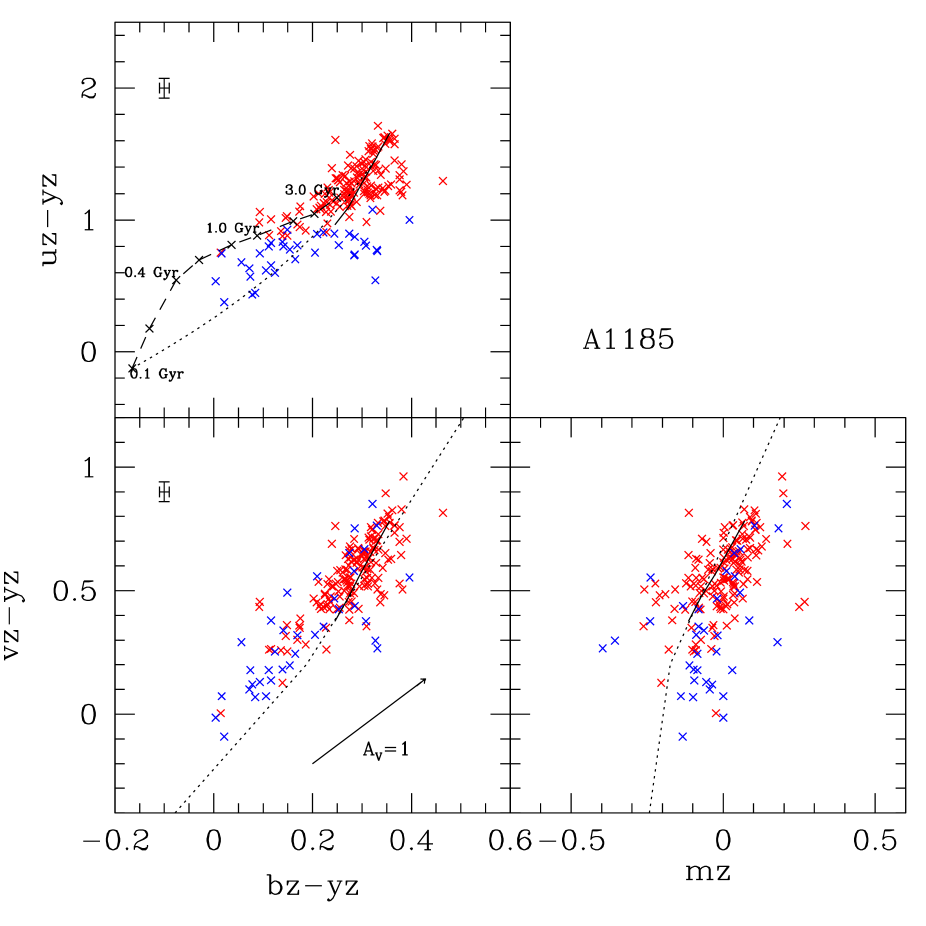
The uniform locus in colors is particularly important for our study as the sample is selected from galaxies in a rich cluster. The combination of dense environment and a limited range in morphological types produces an extremely red population of galaxies with a limited scatter. Figure 1 displays the obvious result that a majority of the galaxies in A1185 have typical elliptical colors ( and ) and follow an old (greater than 10 Gyrs) track of metallicity from spectroevolutionary models (a 13 Gyr track is shown as a solid line in Figure 1 for comparison). We can also compare these colors with synthetic colors generated from SDSS spectra (Smolcic et al. 2006). Their mean color locus are shown in Figure 1 as a dotted line (only for and as SDSS spectra do not cover the filter). There is a small shift due to slight different definitions of the filter bandpasses (also seen on other comparison data, Rakos & Schombert 2005b), but the slopes and dispersions are identical.
A strongly defined color locus opens the possibility of classifying galaxies by their spectrophotometric properties, in contrast to their morphological appearance. While classification by morphological appearance has been a useful diagnostic for galaxy evolution, the underlying physics is difficult to unravel. Classification by optical color reflects, mostly, the physics of the star formation histories of galaxies, which is potentially more insightful to the evolution and formation of the stellar populations in galaxies.
We have applied PCA in our previous papers (see Odell, Schombert & Rakos 2002) to define four classes of galaxies based on their narrow band colors. The most recent form of our classification system divides the first principal component axis (PC1) into four subdivisions based on mean past star formation rate; E (passive, red objects), S (star formation rates equivalent to a disk galaxy), S- (transition between E and S) and S+ (starburst objects). By comparison to SED models and nearby galaxies (Rakos, Maindl & Schombert 1996), the divisions along the PC1 axis are drawn such that S galaxies correspond to those systems with spiral star formation rates (approximately 1 per yr) and S+ galaxies correspond to starburst rates (approximately 10 per yr). We note that since these divisions are determined by continuum colors, versus spectral lines, they do not represent the current star formation rate, but rather the mean star formation rate averaged of the last few Gyrs as reflected into the optical emission by the dominant stellar population. The red E systems display colors with no evidence of star formation in the last five Gyrs. The transition objects, S-, represents the fact that there is not sharp division between the E class and S class . These objects display slightly bluer colors (statistically) from the passive E class; however, the difference could be due to a recent, low-level burst of star formation or a later epoch of galaxy formation or an extended phase of early star formation or even lower mean metallicity (i.e. the color-magnitude effect). In addition to classification by color, we can separate out objects with signatures of non-thermal continuum (AGN) under the categories of A+, A and A- based on their PC2 values colors. It is important to remember that these classifications are based solely on the principal components as given by the color indices from four filters. While, in general, these spectrophotometric classes map into morphological ones (i.e. E types are often ellipticals, S- are S0 and early-type spirals, S are late-type spirals and S+ are irregulars), this system differs from morphology by being independent of the appearance of the galaxy and based on the color of the dominant stellar population in a galaxy. This is also a classification based on integrated colors, such that large B/D galaxies (i.e. early type spirals) will generally be found in class S- as the bulge light dominates over the disk. This is in contrast to classification by morphology where the existence of even a faint disk distinguishes the galaxy from an elliptical.
Galaxies are labeled by their various spectrophotometric classes in Figure 1, where the size of the symbol is proportional to their absolute luminosity. Unsurprisingly, a majority of the galaxies are E class (48%) and S- (33%). The remaining 19% were S class (15%) and S+ (4%). The Coma cluster (Odell, Schombert & Rakos 2002) has a similar mix of S/S+ galaxies at 12 and 5% each. However, in Coma, a majority (72%) of the red galaxies are E class and 14% are S- class, compared to 48% E class in A1185 versus 33% S- class. It is important to remember that the S- class galaxies represents a transition set of colors between star-forming (S class) and non-star-forming (E class) as mapped into PC space. While S- class galaxies are, in general, associated with systems with low amounts of star formation (large bulge disks, S0’s and E+A), they are also prominent as one examines lower luminosity systems where low mean metallicity pushes all the narrow band colors to the blue (see Figure 3 below).

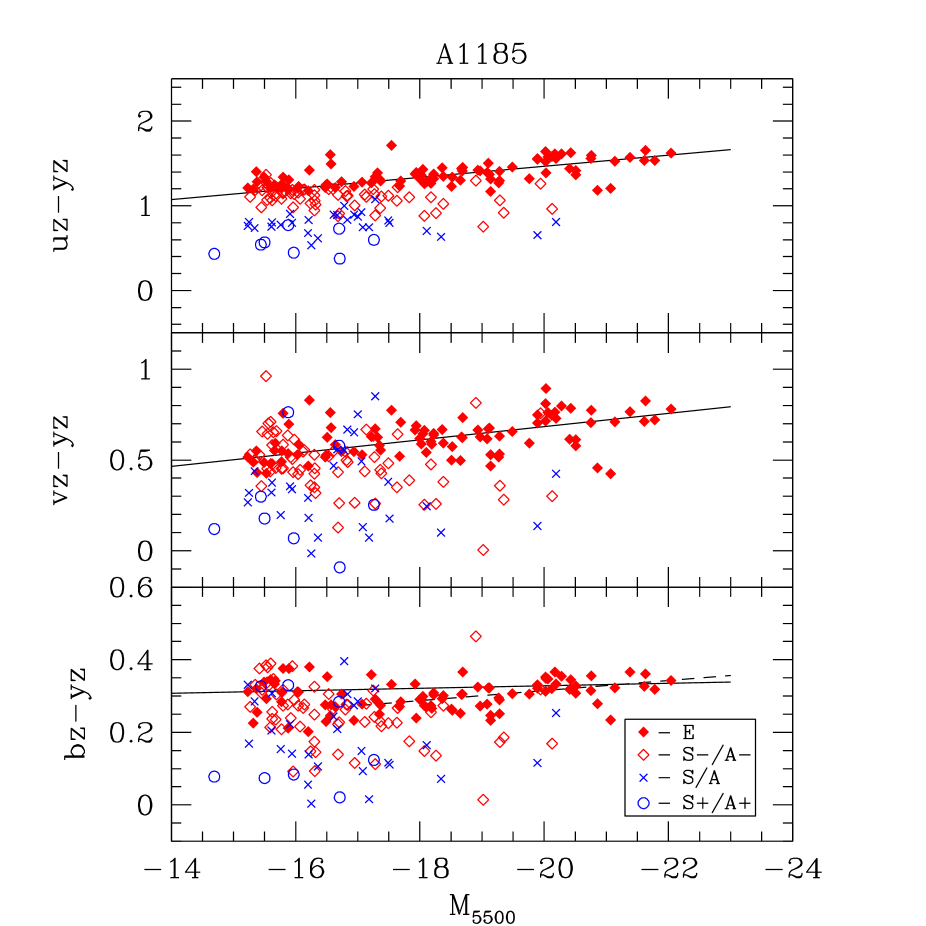
The higher fraction of S- class galaxies in A1185 (compared to Coma) is consistent with the higher fraction of blue galaxies found in A1185. The total blue fraction () for A1185, defined as the ratio of the number of galaxies with (Rakos et al. 2000) is 0.21 (trimmed to the same limiting absolute magnitude as Coma). For comparison, the value for Coma is 0.10. Given that A1185 is a dynamically younger cluster than Coma, a large blue fraction is to be expected (see review of cluster environmental effects in Poggianti 2004). A simple blue fraction value disguises a great deal of information about the population of galaxies in a cluster. The bottom panel in Figure 2 displays the run of as a function of absolute magnitude (divided into bins of 32 galaxies). As with other rich clusters we have studied (A2218, A2125 Rakos & Schombert 2005b, A115, A2283 Rakos et al. 2000, A2317 Rakos et al. 1997), a common trend of increasing with fainter magnitudes is found. While galaxies do become bluer with decreasing luminosity (i.e., CMR), this effect is minimal in the color where is defined (see below). The top panel in Figure 2 also shows that fraction of star-forming galaxies (S and S+ class) also increases with decreasing luminosity and is the driving factor in .
One of the earliest photometric correlations for galaxies is the color-magnitude relation (CMR) and A1185 is unique by having the deepest examination of its CMR of any cluster of galaxies (Andreon et al. 2006). The Andreon et al. study (using colors) found the CMR for A1185 to be linear and well defined down to absolute luminosities of . Figure 3 displays the CMR for all three narrow band colors in our study. The solid lines are fits to the Coma data and match perfectly to the A1185, even at the level of the scatter around the relationships. The universality of the CMR is well documented (see Schawinski et al. 2006 and references therein), and its origin as a mass-metallicity relationship is also well-studied by theoretical models (Kodama & Arimoto 1997, although see Trager et al. 2000 for a dissenting view). While determining exactly how the age and metallicity of a galaxy map into the CMR requires guidance from SED models, it is known from our previous work in the Coma cluster (Odell Schombert & Rakos 2002) that the primary driver of galaxy colors is metallicity, with age taking a secondary role if there is no recent star formation. The competition between age and metallicity is the main goal of this paper and we take the existence of the mass-metallicity relation for ellipticals to be given (Gallazzi et al. 2006).
With respect to our narrow band colors, there are series of additional points. First, the CMR is difficult to analyze as a linear relation due to the fact that any star-forming galaxies lie on the blue side of the relation which unbalances a linear fit. Our spectrophotometric classification system has the immediate advantage of removing star-forming galaxies from the fit, however, one then finds increasing weight given to red objects which biases the fit in the other direction. In addition, the separation between E and S- classes is arbitrary (although guided by morphological information), thus, final fits will be dependent on the cut used to separate the photometric categories. Fortunately, in a rich cluster, the number of red galaxies vastly outnumbers any contaminating blue galaxies. Experimentation with different cuts and bi-weight fitting procedures finds that the results for A1185 are statistically identical to CMR fits to other rich clusters in our previous papers. The scatter on the final slope and zeropoint shown in Figure 3 was due solely to observational uncertainty in the colors rather than sample criteria.
A second difference between the Coma sample and A1185 is that the A1185 data involves a fainter magnitude cutoff. We find that this resolves an anomaly in the Coma CMR noted in Odell, Schombert & Rakos (2002). For the Coma data, we were surprised to find that the CMR had no slope in a formal fit. Our expectation from SED models was that a slope, due to metallicity effects, in and should translate into a smaller, but measurable slope in . In , the CMR drops from a mean of 0.80 for to approximately 0.50 at . For a 13 Gyr population, the same change in (0.30) corresponds to a change in 0.08 in , which was not seen in the Coma data where a formal fit was equivalent to a zero slope.
Lacking a clear CMR in , we interpreted the lack of slope to be an age effect countering the mass-metallicity effect (where is more sensitive to turnoff stars in an old stellar population and such that fainter galaxies were older). The bottom panel in Figure 3 indicates that the CMR for A1185 is, in fact, confused and a blend of galaxies at the faint end. There is a clear correlation from the brightest galaxies to (see dashed line fit in Figure 3), and the slope of this relation matches the expectations from the SED models and the slope. But, below this luminosity, the relationship dissolves and the scatter increases such that a formal fit is a line of zero slope. A similar effect is noted by Poggianti et al. (2001) for giant versus dwarf galaxies in Coma. Also note, that due to this distortion in the CMR, our conclusions concerning the age of low luminosity galaxies in Coma is invalid. In fact, the poor resolution of the indicator to age, motivated us to seek a more intensive procedure to determine age and metallicity (see §3.2). which completely reverses our conclusions from Odell, Schombert & Rakos (2002) concerning the age of low luminosity ellipticals.
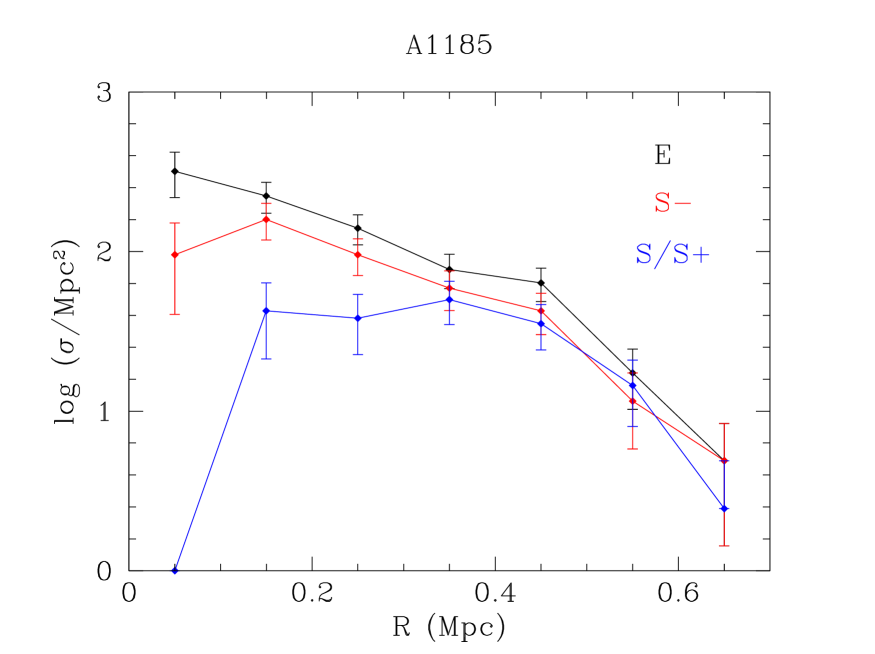
The data for A1185 also indicates there exists a spectrophotometric-density relationship in A1185, equivalent to the density-morphology relation (Dressler 1984, Smith et al. 1997). Figure 4 displays the variation on projected galaxy density as a function of cluster radius for the four photometric classes (S and S+ were combined to represent all star-forming galaxies). Unsurprisingly, star-forming galaxies avoid the cluster core and the red population (E and S- classes) dominate the inner regions. Numerous environmental effects have been postulated to account for rapid changes in the star formation of disk galaxies as they encounter a cluster core such as tidal forces, gas stripping, strangulation (see Poggianti 2004 for a review). However, even the S- class displays a statistically significant drop in density at the cluster core, even though there are no overt signs of star formation in these systems. An environmental effect on galaxies with old stellar populations would imply that the cluster environment has had a long history on galaxy populations, and that even within the red population of a cluster there are color differences influenced by environmental factors.
3.2 Age and Metallicity Determination
The goal for spectrophotometry studies of cluster galaxies is to reveal some information pertaining to their star formation history. Ultimately, we wish to determine not only the formation epoch of the galaxies (the age of their oldest stars), but also the style and behavior of their star formation (for example, initial bursts versus later episodes) as it factors into their evolution. The optical colors of galaxies reflect information that pertains to the photospheres of stars and, therefore, the evolution of a galaxy’s colors mirrors changes in those same stellar populations. Thus, the light from stellar populations in galaxies is primarily a two parameter family based on the distribution of age and metallicity of the stars.
Techniques for estimating the age and metallicity of galaxies have improved dramatically in the last 20 years. For optical studies, the primary technique of choice is age and metallicity determination through the use of spectral features (Gonzalez 1993). This has the immediate advantage of linking galaxy measurements to stellar studies, where a solid foundation of theoretical work on stellar atmospheres has resolved the behavior of spectral lines with temperature and abundance. However, the dominant component that produces the observed colors in galaxies is not their spectral features but rather the continuum emission. Age and metallicity vary the continuum emission through the impact of higher mass stars in younger stellar populations (hot colors) and changes in the color of the red giant branch (RGB) by line blanketing effects caused by changes in the mean metallicity (Tinsley 1980).
Stellar population studies by colors is not without drawbacks. For example, the well known degeneracy problem for continuum colors derives from the fact that changes in metallicity can imitate age effects, particularly in observations without sufficient spectral resolution (i.e. from broadband colors such as Johnson ). Our use of narrow band continuum colors is motivated by two factors; 1) narrow filters select smaller regions of a galaxy’s spectra, regions which contain a concentration of metal lines (the region) versus regions that are relatively free of line (continuum areas, i.e. and ) and 2) there exist improved population models (Schulz et al. 2002) which sample the region of age-metallicity parameter space useful for the analysis of old, red galaxies and which are now tied to the globular clusters system. The Schulz et al. models are a significant improvement over past work with respect to our near-UV and blue colors since they 1) include the recent isochrones from the Padova group which have a stronger blue HB contribution, 2) use more recent stellar atmosphere spectra which, again, are refined to better sample the blue and 3) are in better agreement with globular cluster colors than previous work. Our studies on the use of the filters to determine age and metallicity have culminated in Rakos & Schombert (2005a) where we develop a principal component methodology for determining these two parameters in composite systems, such as galaxies. There are several limitations to the technique. For example, the models are restricted to [Fe/H] -1.7 and ages greater than 3 Gyrs. However, for cluster galaxy studies, we can isolate galaxies with ongoing star formation, or have large fractions of young stars, by their extreme colors and/or strong emission lines. In addition, there is a strong expectation that cluster galaxies consist of star populations with mean [Fe/H] values greater than globular clusters, removing any problems of fitting the low metallicity end of the models.
Our approach derives metallicity and age values using only the observed narrow band colors and the knowledge of the behavior of the PC surface (i.e., guided by the SED models). We first use the three narrow band colors from the SED models (Schulz et al. 2002) to generate a mesh of PC1 and PC2 values, where the PC equations (see Rakos & Schombert 2005a) contain age, metallicity and the three narrow band colors. With the expectation that one pair in the computed mesh represents the true value for an unknown age and metallicity, we next attempt to identify the true value of PC1-PC2 for an object with observed colors but unknown age and metallicity by an iterative search. The search begins by using an estimated metallicity from the color and a crude, mean stellar age from the color. We then interpolate a PC1 and PC2 pair from the assumed age and metallicity, use the PC equations to fill in the observed color indices plus the assumed age and metallicity, and compare the calculated pairs to those derived from the colors. In practice, the search for the correct age and metallicity is an iterative process as the PC plane is smooth, but not linear. Correct values are evaluated by calculating the differences between the PC values determined from models and those determined from the PC equations, in which the observed colors are the input. The quality of the solution is measured by the root mean difference (rms) between the PC values over two iteration loops; one for age and one for metallicity. At each step, PC values are interpolated from the Schulz et al. (2002) models for the step values of age and metallicity, then compared to the PC values determined from the PC equations, again using the step values of age and metallicity plus the observed colors.
There are several cautionary notes to this technique: 1) the procedure can only be used to determine mean ages and metallicities (i.e., objects which have multiple epochs of star formation will produce age/[Fe/H] values that are the luminosity weighted mean), 2) the technique only applies for stellar populations older than 3 Gyrs (i.e., the degeneracy is still unresolved for galaxies undergoing starburst or recent star formation), 3) the age/[Fe/H] values are integrated values from the total luminosity of the galaxy and are not surface brightness selected (e.g. core spectroscopy), this means that some metallicity/age model must be used to interpret internal stellar population distribution of age and metallicity as it reflects into the integrated colors. The tools for our new age/metallicity algorithms can be found at http://student.fizika.org/vkolbas/pca.
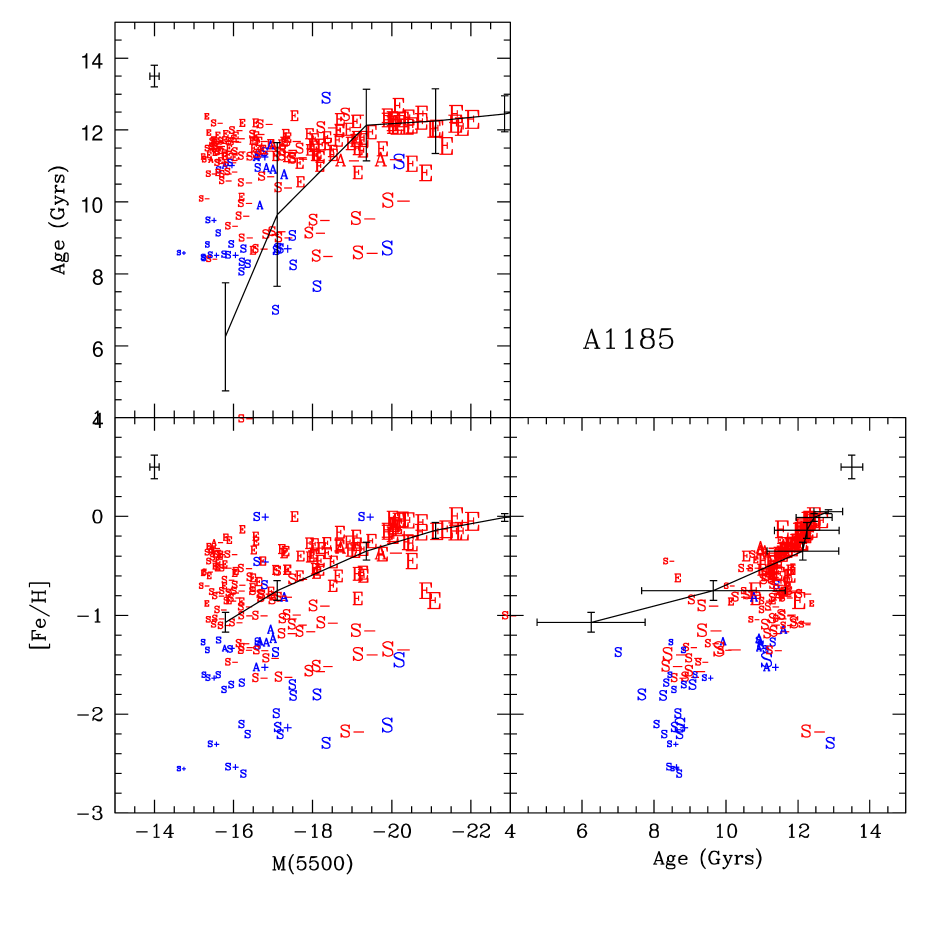
The resulting age and [Fe/H] values for the A1185 galaxies, as calculated using the technique described in Rakos & Schombert (2005a), are listed at our data website (http://abyss.uoregon.edu/js/narrow) and displayed in Figure 5. The typical error in our technique is 0.2 dex in [Fe/H] and 0.5 Gyrs in age which, of course, degrades at lower luminosities. What is immediately obvious, in both the Coma and A1185 data, is that cluster galaxies divide into two populations by age and [Fe/H]. The first population is a classic red sequence of galaxies with ages greater than 10 Gyrs having a color-magnitude relation which is clear for high luminosity systems, but degrades at lower luminosities. Their morphological and spectrophotometric classifications are early-type ellipticals and S0’s with no current or recent star formation. The metallicities display strong chemical evolution with values that range from [Fe/H] to slightly greater than solar (see also Odell, Schombert & Rakos 2002). The second group of cluster members is younger than the first group with mean ages between 8 and 10 Gyrs (although for some of the star-forming members of this group, this age will represent an upper limit). Their metallicities also reflect a weakly evolved history with mean [Fe/H] values less than . An advantage to our narrow band color scheme is that these [Fe/H] values are tied to the SED models. As there are significant changes in /Fe ratios with galaxy mass (Sanchez-Blazquez et al. 2006), [Fe/H] extracted from line values must correct for this effect. Comparison to super-rich metallicity models (Rakos et al. 2001) shows that changes in Mg/Fe from 0 to 0.4 result in changes in color of less than 0.01 mags.
The old, red group displays a classic trend of luminosity and [Fe/H] for galaxies brighter than 18, but the relation degrades at lower luminosities. Assuming that luminosity traces stellar mass (Cappellari et al. 2006), then bright red galaxies follow a well-defined mass-metallicity relation (Kelson et al. 2006, Nelan et al. 2005). Comparison of all three narrow band colors also demonstrates that the CMR, in our color system, is primarily a metallicity indicator. The effects of age are secondary, although in the same direction as metallicity effects with galaxy luminosity. The low scatter in the CMR for red galaxies is not due to competing age and metallicity changes.
This older population also displays a clear correlation between age and luminosity (stellar mass) in the sense that more massive galaxies are older. This trend indicates a mean age for high mass ellipticals to be 12.5 Gyrs, on average, dropping to 11.5 Gyrs for the faintest ellipticals in the sample. This effect is often referred to as the ‘downsizing’ scenario of galaxy formation (Smail et al. 1998, Bundy et al. 2005, Mateus et al. 2006) and has been confirmed in line indices work (Collobert et al. 2006, Gallazzi et al. 2006, Sanchez-Blazquez et al. 2006, Gallazzi et al. 2005, Thomas et al. 2005, Kuntschner et al. 2001), optical colors (Cool et al. 2006), near-IR colors (James et al. 2006), UV colors (Kaviraj et al. 2006), estimates (di Serego Alighieri, Lanzoni & Jorgensen 2006), field galaxies (Li, Zhang & Han 2006, Mateus et al. 2006), cluster galaxies (Nelan et al. 2005, Poggianti et al. 2004, Poggianti et al. 2001) and galaxies at higher redshifts (Kelson et al. 2006, Mei et al. 2006, Schiavon et al. 2006, Barr et al. 2005, Jorgensen et al. 2005). The best demonstrations of the downsizing effect are the CMR diagrams from clusters by De Lucia et al. (2004). These diagrams show a clear deficiency of low luminosity red galaxies between to . Our studies of the Butcher-Oemler effect in clusters, using the same narrow band filter set (Rakos & Schombert 2005b), finds that only 5 to 10% of a galaxy’s mass needs to be involved in star formation to produce spiral-like colors as seen in the De Lucia et al. diagrams. Given that corresponds to 6 Gyrs ago (Benchmark cosmology), then this would produce a current generation of low luminosity cluster ellipticals with approximately 10% of their stellar mass in a 6 Gyr population plus the remaining 90% of their stellar mass in a 12 Gyr population. Convolving these values to our SED models finds that the luminosity weighted value for the age of such a galaxy would be 11 Gyrs, in agreement with the age estimates from Figure 5.
The second group of galaxies, with younger mean ages, is represented in A1185 by two types of galaxies, a disk/irregular galaxy mixture on the low mass side combined with a few S- class objects on the high mass side. In Coma, the younger population is primarily red, dwarf elliptical type systems (see Odell, Schombert & Rakos 2002 for more discussion). The low mass red galaxies in younger group are primarily non-nucleated dwarf ellipticals, which we have found be have many of the characteristics of the blue globular clusters in ellipticals (i.e. slightly younger and metal-rich compared to Galactic globulars, Rakos & Schombert 2004). This supports our claim in Rakos & Schombert (2004) that low mass ellipticals divide into two populations, nucleated dwarfs with ages and metallicities that form a continuum with bright ellipticals and a younger non-nucleated dwarf elliptical population with slightly younger ages and higher metallicities.
Our interpretation of blue galaxies in this second group, given their blue colors indicating ongoing star formation, is a population with a majority of their stellar mass in an old stellar population and a smaller mass, young (less than 1 Gyr) stellar population which combine to produce an integrated age of 8 to 9 Gyrs. Again, invoking estimates using SED models, we find that about 10% of the mass of these blue galaxies can be in a one Gyr population and the remaining in a 12 Gyr to produce the observed colors and ages. It is interesting to note that the high mass systems in the second group appear to have the oldest ages, reddest colors and perhaps represent a transition population from the blue to red cluster galaxies (possible future S0’s). This population maintains many of the characteristics for the ‘blue-side’ population found in SDSS CMR studies (Cool et al. 2006, Kauffmann et al. 2003), galaxies with primarily red stellar populations and a small percentage of stars with ages less than one Gyr resulting in a dichotomy in color space by galaxy mass.
Other points to note from Figure 5, the correlation between luminosity and metallicity for the red population is weaker than the correlation between mean age and metallicity. While a mass (luminosity)-metallicity correlation is evident in the data, in fact, for values of [Fe/H] above , the metallicity of a red galaxy so well correlated with age that either parameter predicts the other. The correlation between age and metallicity, in a positive sense, is in contradiction with other studies such as Thomas et al. (2005) and Sanchez-Blazquez et al. (2006) which find anti-correlations between age and metallicity (yet, positive correlations between galaxy mass and age or metallicity). Correlated errors between the determination of age and metallicity could lead to positive correlation seen in Figure 5 since redder colors can signify older age or higher metallicities. However, examination of the least square fits to the parameters in PC space (see Figure 4 of Rakos & Schombert 2005) finds that / has a slope of 0.03. Whereas, the slope of the age/metallicity relation in Figure 5 is 0.4. Although the range in age is low, it is unlikely that the correlation found from narrow band colors is due to coupling of the two parameters. Thus, Figure 5 demonstrates that the range of age and metallicity vary among galaxies, particularly at low masses. But for the oldest, high mass ellipticals, age and metallicity have a strong linear behavior such that [Fe/H] = 0.36 - 4.55 in Gyrs. The existence of this tight relationship for the most massive galaxies is probably the strongest signature of a common origin and evolutionary path for these systems. Although the expectation from simple galactic wind models (Arimoto & Yoshii 1987, Matteucci 1994) are that the oldest galaxies should have the lowest metallicities (older meaning shortest duration of star formation and less processing of the ISM), the reverse as seen in Figure 5. This will be discussed further in the conclusions section.
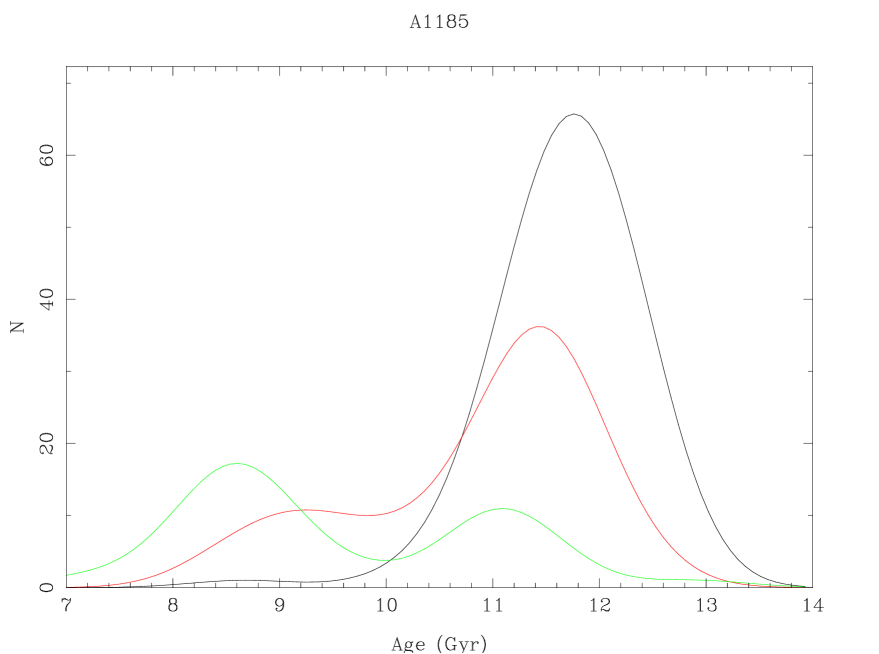
A comparison between our spectrophotometric classifications and galaxy age is found in Figure 6. The two age groups are clearly visible in this normalized histogram with mean ages at 12 and 8.5 Gyrs. Also noticeable in this histogram is that even within the two groups there are differences in ages by spectrophotometric type. The median age drops from 12 Gyrs for E class galaxies to 11.5 Gyrs for S- class galaxies to 11 Gyrs for star-forming S/S+ class galaxies. For the later type galaxies, this probably reflects a mean age value based on a mixture of an old ( 11 Gyrs), bulge stellar population plus a younger disk population. However, for the non-starforming S- class galaxies, their colors are typically more uniform and we would not propose that the younger age is due to a mixing of disk and bulge populations. Yet, their ages from integrated light measurements are statistically younger than the E class galaxies. The second, younger group is composed solely of S-, S and S+ class galaxies. Where the youngest galaxies are, not surprisingly, the star-forming S and S+ galaxies. However, the distribution in age for S- galaxies is distinctly bimodal with the youngest S- galaxies being older as the S/S+ galaxies (9.5 to 8.5 Gyrs), but certainly separate from the peak at 11.5 Gyrs.
The meaning of the trend with age and stellar mass is more difficult to extract from our data because the integrated age of the underlying population can be reached by many avenues. For example, if all the stars in a galaxy are formed simultaneously, then our age measurement represents the time to that epoch. This is also true if galaxies form their initial stars over a range of time, but all starting and stopping at the same epoch. Then our age measurement will represent the luminosity weighted mean age of the stars, presumably near the time to the median of the initial star formation epoch. This enters into a debate of the formation time of the stellar population versus the assembly time of those populations into their parent galaxy (De Lucia et al. 2006). Under a monolithic collapse scenario, those times are nearly equal. But, recently, a variety of hierarchical models have been considered where stars forming in smaller units, then merger into their final systems. One such set of models is presented by De Lucia et al. (2006) using the results of a high resolution cosmic structure growth simulation (the Millennium Simulation, Springel et al. 2005). Their resulting tracks of age, metallicity and galaxy mass (converted to using an of 4) are shown in Figure 5. The error bars on the models display the range from their simulations, not inaccuracies to their method. While there is qualitative agreement with the simulations in that age increases with galaxy mass and metallicity increases with mass, the simulations appear incomplete at the low mass end and even the broad range of age in their low mass galaxy simulations do not capture the distribution of ages and metallicities on our sample. In particular, this flavor of models fails to find old, yet metal poor galaxies that represent a majority of the galaxies fainter than 17.
As an aside, an alternative interpretation of the luminosity-weighted ages arises if the duration of the epoch of initial star formation varies with galaxy mass. For example, the red population trend in Figure 5 may suggest that the initial phase of star formation is shorter for high mass galaxies than low mass ones. An extended phase of initial star formation results in a mean age that is younger than the age calculated from a short, intense burst. Thus, the red population in A1185 and Coma either 1) have low mass galaxies to be younger with respect to their initial star formation epoch or 2) have similar formation epochs, but low mass galaxies experience a longer duration of initial star formation as compared to higher mass systems. This later interpretation is supported by the /Fe ratios in ellipticals (Denicolo et al. 2005, Sanchez-Blazquez et al. 2006), which increase with increasing galaxy mass to indicate a shorter duration of star formation.
Evidence for recent star formation in elliptical (Barger et al. 1996) would complicate the interpretation of our ages calculated from integrated colors. These claims are based on spectroscopic signatures in the Balmer series (i.e. H). In an old population, very small numbers of hot, young stars are easy to detect in spectra. Estimating the mass of a galaxy involved in a recent burst has not been conclusive. Our estimates from SED models is that a recent burst, which involves less than 5% of the galaxy mass, will effect on our narrow band colors at less than the level of the internal errors (Rakos & Schombert 2005a). Thus, there is no conflict between observation of recent, weak bursts of star formation and our age estimates which will apply to a majority of the underlying stellar population.
3.3 Cluster Age Gradients
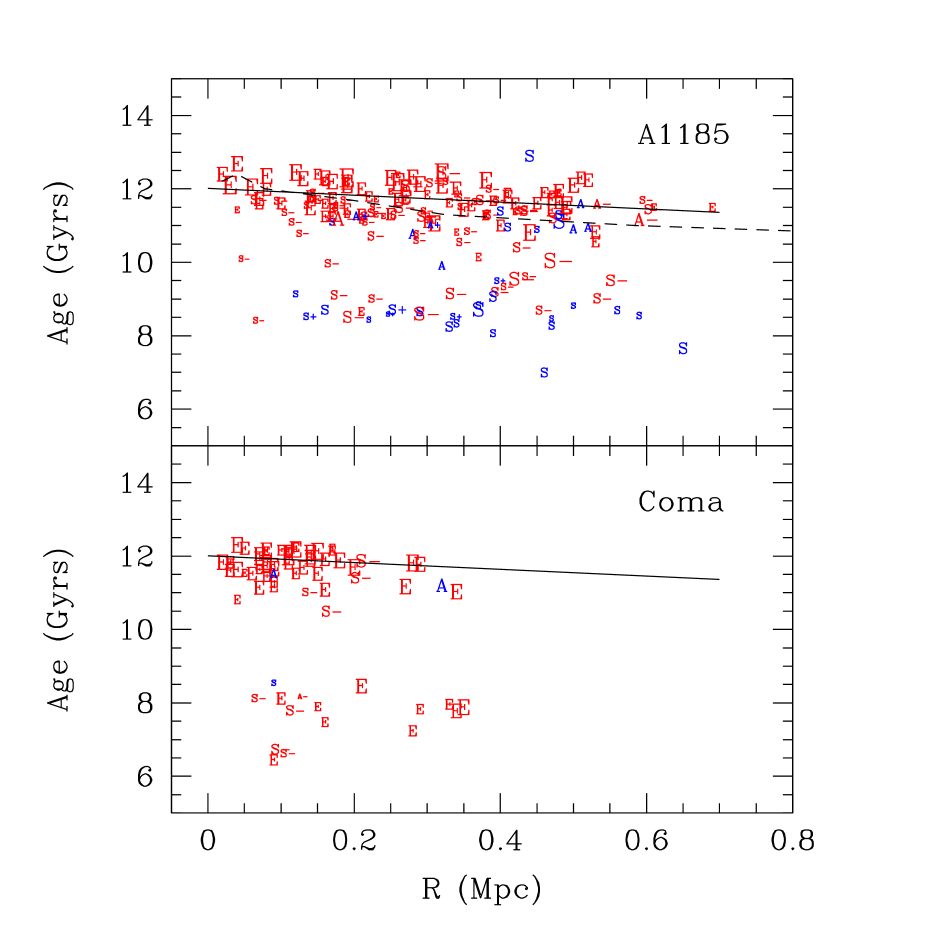
Our Coma sample (Odell, Schombert & Rakos 2002) lacked sufficient sky coverage to confidently address correlations related to distance from cluster center. A larger field of view for the A1185 observations allows us to address those issues in this study. Figures 7 and 8 display just that information for A1185, age and metallicity as a function of distance from the geometric center of the cluster. There are weak, but statistically significant, trends for both parameters in the sense of decreasing metallicity and decreasing age with increasing distance from the cluster core. These gradients are identical in direction and similar in magnitude to the line index gradients found in the NOAO Fundamental Plane Survey (Smith et al. 2006). They also found a decrease in age by 1 Gyrs (15%) and almost no metallicity gradient (2%). Their interpretation is later accretion produces younger stellar populations in a cluster halo, but early environmental effects, such as quenching, could equally well explain the observed gradients (Poggianti et al. 2004, Bundy et al. 2005).
As we have already seen in previous section, there is a correlation between galaxy mass (luminosity) and age/metallicity. So the trend with distance from the cluster core may simple reflect mass segregation. However, an examination of the galaxy luminosities as a function of cluster radius finds no correlation between galaxy luminosity and radial distance. The change in mean stellar age is approximately 1 Gyr from the cluster core to the outer regions. This would represent a change in 2 to 3 mags in average galaxy luminosity as given by Figure 7, which is simply not seen in the data. Thus, the trends of age and metallicity are not due to changes in galaxy mass with cluster position.
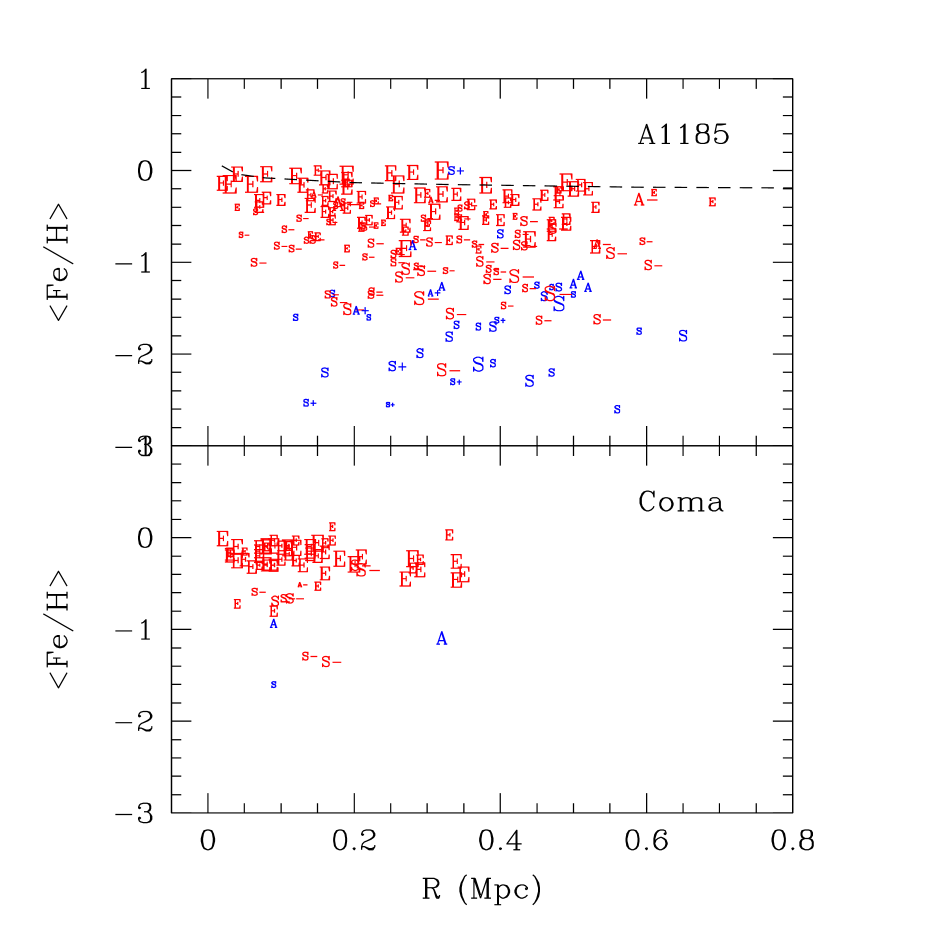
Assuming that the trend of age with distance from the cluster core is real, and not reflecting some secondary correlation with a galaxy’s properties, we are surprised to find that metallicity-radius relation is so poor compare to the age-radius trend. For the red population in A1185, the relationship between age and [Fe/H] is very tight (see §3.2). An age gradient of 1 Gyr should be matched by a corresponding metallicity gradient of 0.5 dex, which is not seen in Figure 8. This would agree with line strength studies (Bernardi et al. 2006) which also found little change in Fe indicators across various galaxy density regions. While low metallicity systems appear to avoid the cluster core, high metallicity galaxies ([Fe/H]) are found at all cluster radii. The implication here is that cluster environmental effects, which alter the red populations star formation history, affect the star formation rate (i.e. age) more sharply than the chemical evolutionary history of a galaxy, i.e. the mean metallicity of a red galaxy is set long before the era of star formation is complete.
Various hierarchical models of galaxy formation predict differences between the ages of galaxies formed in high density versus low density regions (Baugh, Cole & Frenk 1996). Present-day clusters form in high density peaks of the primordial density field. This leads to early collapse times for galaxies forming in these regions and, therefore, an older stellar population compared to field galaxies. In addition, there exist simulations that display age and metallicity gradients within the cluster environment based on the hierarchical recipes (De Lucia et al. 2006, shown as dashed lines in Figures 7 and 8). There is some evidence for this effect in spectroscopic studies (Bernardi et al. 2006, Collobert et al. 2006); however, the data presented herein does not sample into the field population as would be required to test this observation.
The age gradients seen in Figure 7 follow the change in current galaxy projected density from core to cluster halo, but these outer density values are still a factor of three greater than the field, and there is no guarantee that these galaxies are occupying the same local density today as at their formation. Gradients found in simulations (De Lucia et al. 2006) are primarily driven by mass segregation such that the distance to the center of a cluster is correlated loosely with time and, thus, is reflected in the mass correlated properties of the individual galaxies.
4 CONCLUSIONS
The processes, both internal and external, that influence the star formation history of cluster galaxies are so complex and interconnected, that even the determination of relatively accurate values for mean age and metallicity will not uniquely map into a single galaxy formation scenario due to the large number of possible paths a stellar population may take to end up with the integrated values that we measure. The best we can do is isolate the pure observables in this study and list the most likely candidates for the processes that a galaxy might take to acquire its properties. This will, in the end, be a list of the most likely star formation scenarios combined with the known environmental influences on cluster galaxies.
With respect to the red population in rich clusters, our work herein has found clear trends in galaxy age and metallicity with respect to stellar mass and environment. The most massive galaxies in a cluster are the oldest with luminosity weighted ages of 12 to 13 Gyrs. These galaxies also have the highest metallicities, near solar. With decreasing stellar mass (luminosity), the mean age decreases to approximately 11 Gyrs. Likewise, the mean metallicity decreases to [Fe/H]=. Age and metallicity are strongly correlated, such that older mean age correlates to higher mean metallicities. In addition to trends with galaxy mass, the mean age of the red population also changes with environment with the oldest galaxies found in the dense inner core and the youngest galaxies at the lower density cluster halos, although there is little change in global metallicity with cluster location.
As stated in §3.2, it is impossible to determine strictly from integrated values whether the variation in mean age with galaxy mass is due to varying epochs of initial star formation or varying durations. However, an additional stellar clock is available to resolve this dilemma, the ratio of elements to Fe. The ratio of elements to Fe is a function of the number of Type II versus Type Ia supernova in a galaxy’s past. Type Ia SN produce extra amounts of Fe and decrease the ratio. However, Type Ia SN require at least a Gyr of time to build-up within a galaxy and, therefore, high fractions of /Fe indicate shorter duration times for star formation. SDSS (Sanchez-Blazquez et al. 2006) and deep line indices studies (Nelan et al. 2005) have already demonstrated that /Fe increases with galaxy mass (although see Matteucci & Chiappini 2005 for a dissenting view on the abundance problem). The relationship of age with galaxy mass seen herein is consistent with a single epoch of galaxy formation and increasing initial durations of star formation with decreasing stellar mass. This appears to be a weaker version of the so-called ‘downsizing’ effect discovered in other age studies (Gallazzi et al. 2006) since, by comparison to SED models, if as much as 10% the stellar mass of a low luminosity elliptical is involved in star formation at (De Lucia et al. 2004) then this would produce luminosity-weighted mean ages of around 11 Gyrs at the present epoch.
The homogeneous properties of the red population, for example, the tight CMR found in all rich clusters, has always argued strongly for a monolithic collapse scenario (Partridge & Peebles 1967, Larson 1975). Yet, the decrease in age with galaxy density (radial changes) found in this study is precisely the effect predicted by most hierarchical formation models (Yee et al. 2005, Conselice 2006) and, more importantly, an increase in metallicity with galaxy mass in conjunction with a decreasing duration of initial star formation with galaxy mass is in direct contradiction of the classic galactic wind model of galaxy formation. Under a normal wind model (see Matteucci 2004), the efficiency of star formation is a decreasing function of galactic mass. Thus, the timescale of star formation is based on the dynamical free fall time. Larger mass systems have longer dynamical timescales and, therefore, smaller efficiencies and longer durations of initial star formation before the onset of a galactic wind halts the process. This allows more time for chemical evolution to increase the abundance of metals and resulting in higher global metallicities for higher mass galaxies (i.e., the color-magnitude relation). However, the /Fe ratios and the age-mass relation (Figure 5) argue exactly the opposite of the classic wind model, that star formation was shorter and more efficient with increasing galaxy mass. In order to maintain a homogeneous collapse scenario, one is required to propose a process where ellipticals form by merging protoclouds and the merger process introduces higher densities/velocities resulting in more efficient, and more abundant, star formation (i.e., the inverse wind model, Matteucci 1994). This would be a hybrid galaxy formation scenario, mergers early on then reducing by monolithic collapse to a final state.
Gradients exist in A1185, a dynamically young cluster. But the gradients are more discernible in age, than in metallicity. Environmental effects are usually thought to primarily influence the star-forming population in clusters, we note that even the red population of S- class galaxies display a gradient with respect to cluster density and effect that most have applied at the earliest formation times. These two observations would indicate that gradients are suggestive of a ‘quenching’ behavior for cluster galaxies (Poggianti et al. 1999, Bundy et al. 2005) that has been in place even as the cluster was formed at redshifts greater than 5. Thus, the age and metallicity gradients found in A1185 appear to be the effect of environmental processes imprinted at early epochs onto the red population. This type of behavior is visible in the latest hierarchical models produced by collisionless cosmological simulations (De Lucia et al. 2006). These models give a qualitative fit to our observations (see model tracks in Figure 5) if the oldest galaxies in the models have their ages increased by 2.5 Gyrs. Key to those models is that the star formation epoch matches formation redshifts of 5, but that galaxies assemble by mergers at redshifts below 2. Our data cannot address the assembly timescale for the red population, which is an issue to be investigated by space imaging.
The second population in A1185 and Coma (with mean ages around 9 Gyrs, see Figure 5) is associated with the blue population in clusters and, for higher redshifts, the Butcher-Oemler effect. While most of this population has a mean age based on the luminosity-weighted sum of a small fraction of young stars plus a bulk of older (12 Gyrs) stars, a significant fraction of this group have non-star-forming colors (class S-) and probably represent transition galaxies between the Butcher-Oemler population at high redshifts and their descendants at the current epoch.
This blue population is also a candidate for the source of the metal-rich globulars found in many bright ellipticals. In Rakos & Schombert (2004), we re-analyzed the narrow band colors of M87 globulars from Jordan et al. (2002) and found that the bimodal aspect of the M87 globulars was due to a old, metal-poor population (blue globulars) plus a younger, metal-rich population (red globulars), in agreement with many other studies of extragalactic globulars (see Brodie & Strader for a review). We estimated the age of the red population of globulars to be between 3 and 4 Gyrs younger than the blue globulars. Interestingly, this is similar to the difference in age between the old cluster galaxies and the blue population in A1185 and Coma. It suggests that, under a merger scenario for globular clusters in ellipticals (Ashman & Zepf 1992), the younger galaxies in clusters can be a source for the younger globulars in ellipticals.
References
- Andreon (2006) Andreon, S. 2006, MNRAS, 369, 969
- Arimoto & Yoshii (1987) Arimoto, N., & Yoshii, Y. 1987, A&A, 173, 23
- Ashman & Zepf (1992) Ashman, K. M., & Zepf, S. E. 1992, ApJ, 384, 50
- Barger et al. (1996) Barger, A. J., Aragon-Salamanca, A., Ellis, R. S., Couch, W. J., Smail, I., & Sharples, R. M. 1996, MNRAS, 279, 1
- Barr et al. (2005) Barr, J., Davies, R., Jørgensen, I., Bergmann, M., & Crampton, D. 2005, AJ, 130, 445
- Baugh et al. (1996) Baugh, C. M., Cole, S., & Frenk, C. S. 1996, MNRAS, 283, 1361
- Bernardi et al. (2001) Bernardi, M., et al. 2001, ArXiv Astrophysics e-prints, arXiv:astro-ph/0110344
- Bernardi et al. (2003) Bernardi, M., et al. 2003, AJ, 125, 1882
- Bernardi et al. (2006) Bernardi, M., Nichol, R. C., Sheth, R. K., Miller, C. J., & Brinkmann, J. 2006, AJ, 131, 1288
- Bregman et al. (2006) Bregman, J. N., Temi, P., & Bregman, J. D. 2006, ArXiv Astrophysics e-prints, arXiv:astro-ph/0604399
- Bundy et al. (2005) Bundy, K., Ellis, R. S., & Conselice, C. J. 2005, ApJ, 625, 621
- Butcher & Oemler (1984) Butcher, H., & Oemler, A., Jr. 1984, ApJ, 285, 426
- Cappellari et al. (2006) Cappellari, M., et al. 2006, MNRAS, 366, 1126
- Collobert et al. (2006) Collobert, M., Sarzi, M., Davies, R. L., Kuntschner, H., & Colless, M. 2006, MNRAS, 370, 1213
- Conselice (2006) Conselice, C. J. 2006, ApJ, 638, 686
- Cool et al. (2006) Cool, R. J., Eisenstein, D. J., Johnston, D., Scranton, R., Brinkmann, J., Schneider, D. P., & Zehavi, I. 2006, AJ, 131, 736
- De Lucia et al. (2004) De Lucia, G., Kauffmann, G., & White, S. D. M. 2004, MNRAS, 349, 1101
- De Lucia et al. (2006) De Lucia, G., Springel, V., White, S. D. M., Croton, D., & Kauffmann, G. 2006, MNRAS, 366, 499
- Denicoló et al. (2005) Denicoló, G., Terlevich, R., Terlevich, E., Forbes, D. A., & Terlevich, A. 2005, MNRAS, 358, 813
- Dressler (1984) Dressler, A. 1984, ARA&A, 22, 185
- Fisher et al. (1996) Fisher, D., Franx, M., & Illingworth, G. 1996, ApJ, 459, 110
- Gallazzi et al. (2005) Gallazzi, A., Charlot, S., Brinchmann, J., White, S. D. M., & Tremonti, C. A. 2005, MNRAS, 362, 41
- Gallazzi et al. (2006) Gallazzi, A., Charlot, S., Brinchmann, J., & White, S. D. M. 2006, MNRAS, 370, 1106
- González (1993) González, J. J. 1993, Ph.D. Thesis,
- Gregg et al. (2004) Gregg, M. D., Ferguson, H. C., Minniti, D., Tanvir, N., & Catchpole, R. 2004, AJ, 127, 1441
- Huchtmeier et al. (1995) Huchtmeier, W. K., Sage, L. J., & Henkel, C. 1995, A&A, 300, 675
- James et al. (2006) James, P. A., Salaris, M., Davies, J. I., Phillipps, S., & Cassisi, S. 2006, MNRAS, 367, 339
- Jimenez et al. (1999) Jimenez, R., Friaca, A. C. S., Dunlop, J. S., Terlevich, R. J., Peacock, J. A., & Nolan, L. A. 1999, MNRAS, 305, L16
- Jordán et al. (2002) Jordán, A., Côté, P., West, M. J., & Marzke, R. O. 2002, ApJ, 576, L113
- Jørgensen et al. (2005) Jørgensen, I., Bergmann, M., Davies, R., Barr, J., Takamiya, M., & Crampton, D. 2005, AJ, 129, 1249
- Kaviraj et al. (2006) Kaviraj, S., Rey, S. -., Rich, R. M., Lee, Y. -., Yoon, S. -., & Yi, S. K. 2006, ArXiv Astrophysics e-prints, arXiv:astro-ph/0601050
- Kauffmann et al. (2003) Kauffmann, G., Heckman, T., White, S. D. M., Charlot, S., Tremonti, C., Brinchmann, J., Bruzual, G., Peng, E., Seibert, M., Bernardi, M., Blanton, M., Brinkmann, J., Castander, F., Csbai, I., Fukugita, M., Ivezic, Z., Munn, J., Nichol, R., Padmanabhan, N., Thakar, A., Weinberg, D., York, D. 2003, MNRAS, 341, 33
- Kelson et al. (2006) Kelson, D. D., Illingworth, G. D., Franx, M., & van Dokkum, P. G. 2006, ArXiv Astrophysics e-prints, arXiv:astro-ph/0606642
- Kodama & Arimoto (1997) Kodama, T., & Arimoto, N. 1997, A&A, 320, 41
- Kodama et al. (1998) Kodama, T., Arimoto, N., Barger, A. J., & Arag’on-Salamanca, A. 1998, A&A, 334, 99
- Kuntschner et al. (2001) Kuntschner, H., Lucey, J. R., Smith, R. J., Hudson, M. J., & Davies, R. L. 2001, MNRAS, 323, 615
- Larson (1975) Larson, R. B. 1975, MNRAS, 173, 671
- Li et al. (2006) Li, Z., Zhang, F., & Han, Z. 2006, ArXiv Astrophysics e-prints, arXiv:astro-ph/0605610
- Mahdavi et al. (1996) Mahdavi, A., Geller, M. J., Fabricant, D. G., Kurtz, M. J., Postman, M., & McLean, B. 1996, AJ, 111, 64
- Mateus et al. (2006) Mateus, A., Sodré, L., Cid Fernandes, R., Stasińska, G., Schoenell, W., & Gomes, J. M. 2006, MNRAS, 370, 721
- Matteucci (1994) Matteucci, F. 1994, A&A, 288, 57
- Matteucci (2004) Matteucci, F. 2004, Baryons in Dark Matter Halos,
- Matteucci & Chiappini (2005) Matteucci, F., & Chiappini, C. 2005, Publications of the Astronomical Society of Australia, 22, 49
- Mei et al. (2006) Mei, S., et al. 2006, ApJ, 639, 81
- Nelan et al. (2005) Nelan, J. E., Smith, R. J., Hudson, M. J., Wegner, G. A., Lucey, J. R., Moore, S. A. W., Quinney, S. J., & Suntzeff, N. B. 2005, ApJ, 632, 137
- Odell et al. (2002) Odell, A. P., Schombert, J., & Rakos, K. 2002, AJ, 124, 3061
- Partridge & Peebles (1967) Partridge, R. B., & Peebles, P. J. E. 1967, ApJ, 147, 868
- Poggianti (2004) Poggianti, B. 2004, Baryons in Dark Matter Halos,
- Poggianti et al. (1999) Poggianti, B. M., Smail, I., Dressler, A., Couch, W. J., Barger, A. J., Butcher, H., Ellis, R. S., & Oemler, A. J. 1999, ApJ, 518, 576
- Poggianti et al. (2001) Poggianti, B. M., et al. 2001, ApJ, 562, 689
- Poggianti et al. (2004) Poggianti, B. M., Bridges, T. J., Komiyama, Y., Yagi, M., Carter, D., Mobasher, B., Okamura, S., & Kashikawa, N. 2004, ApJ, 601, 197
- Rakos et al. (1991) Rakos, K. D., Schombert, J. M., & Kreidl, T. J. 1991, ApJ, 377, 382
- Rakos & Schombert (1995) Rakos, K. D., & Schombert, J. M. 1995, ApJ, 439, 47
- Rakos et al. (1996) Rakos, K. D., Maindl, T. I., & Schombert, J. M. 1996, ApJ, 466, 122
- Rakos et al. (1997) Rakos, K. D., Odell, A. P., & Schombert, J. M. 1997, ApJ, 490, 194
- Rakos et al. (2000) Rakos, K. D., Schombert, J. M., Odell, A. P., & Steindling, S. 2000, ApJ, 540, 715
- Rakos et al. (2001) Rakos, K., Schombert, J., Maitzen, H. M., Prugovecki, S., & Odell, A. 2001, AJ, 121, 1974
- Rakos & Schombert (2004) Rakos, K., & Schombert, J. 2004, AJ, 127, 1502
- Rakos & Schombert (2005) Rakos, K., & Schombert, J. 2005a, PASP, 117, 245
- Rakos & Schombert (2005) Rakos, K., & Schombert, J. 2005b, AJ, 130, 1002
- Renzini (2006) Renzini, A. 2006, ArXiv Astrophysics e-prints, arXiv:astro-ph/0603479
- Sanchez-Blazquez et al. (2006) Sanchez-Blazquez, P., Gorgas, J., Cardiel, N., & Gonzalez, J. J. 2006, ArXiv Astrophysics e-prints, arXiv:astro-ph/0604568
- Schawinski et al. (2006) Schawinski, K., et al. 2006, ArXiv Astrophysics e-prints, arXiv:astro-ph/0601036
- Schiavon et al. (2006) Schiavon, R. P., et al. 2006, ArXiv Astrophysics e-prints, arXiv:astro-ph/0602248
- Schulz et al. (2002) Schulz, J., Fritze-v. Alvensleben, U., Möller, C. S., & Fricke, K. J. 2002, A&A, 392, 1
- Smail et al. (1998) Smail, I., Dressler, A., Couch, W. J., Ellis, R. S., Oemler, A. J., Butcher, H., & Sharples, R. M. 1998, VizieR Online Data Catalog, 211, 213
- Smith et al. (1997) Smith, R. J., Lucey, J. R., Steel, J., & Hudson, M. J. 1997, MNRAS, 291, 461
- Smolčić et al. (2006) Smolčić, V., et al. 2006, MNRAS, 371, 121
- Springel et al. (2005) Springel, V., et al. 2005, Nature, 435, 629
- Thomas et al. (2005) Thomas, D., Maraston, C., Bender, R., & Mendes de Oliveira, C. 2005, ApJ, 621, 673
- Tinsley (1980) Tinsley, B. M. 1980, Fundamentals of Cosmic Physics, 5, 287
- Trager et al. (2000) Trager, S. C., Faber, S. M., Worthey, G., & González, J. J. 2000, AJ, 120, 165
- Tremonti et al. (2004) Tremonti, C. A., et al. 2004, ApJ, 613, 898
- Worthey (1999) Worthey, G. 1999, ASP Conf. Ser. 192: Spectrophotometric Dating of Stars and Galaxies, 192, 283
- Worthey & Ottaviani (1997) Worthey, G., & Ottaviani, D. L. 1997, ApJS, 111, 377
- Yee et al. (2005) Yee, H. K. C., Hsieh, B. C., Lin, H., & Gladders, M. D. 2005, ApJ, 629, L77
- di Serego Alighieri et al. (2005) di Serego Alighieri, S., et al. 2005, A&A, 442, 125
- van Dokkum & Stanford (2003) van Dokkum, P. G., & Stanford, S. A. 2003, ApJ, 585, 78
- Williams et al. (2004) Williams, G. G., Olszewski, E., Lesser, M. P., & Burge, J. H. 2004, Proc. SPIE, 5492, 787