THE INITIAL CLUSTER MASS FUNCTION OF SUPER STAR CLUSTERS IN IRREGULAR AND SPIRAL GALAXIES
Abstract
The initial cluster mass function (ICMF) is a fundamental property of star formation in galaxies. To gauge its universality, we measure and compare the ICMFs in irregular and spiral galaxies. Our sample of irregular galaxies is based on 13 nearby galaxies selected from a volume-limited sample from the fifth data release of the Sloan Digital Sky Survey (SDSS), from which about 320 young ( Myr), massive () clusters or associations were selected using an automated source extraction routine. The extinctions, ages, and masses were determined by comparing their magnitudes to those generated from starburst models. Completeness corrections were performed using Monte Carlo simulations in which artificial clusters were inserted into each galaxy. Foreground stellar and background galactic contaminations were assessed by analyzing SDSS images of fields around the sample galaxies and found to be small. We analyzed three nearby spiral galaxies with SDSS data exactly in the same way to derive their ICMF based on a similar number of young, massive clusters as the irregular galaxy ICMF. We find that the ICMFs of irregular and spiral galaxies for masses are statistically indistinguishable. For clusters and associations more massive than , the ICMF of the irregular galaxies is reasonably well fit by a power law with . Similar results were obtained for the ICMF of the spiral galaxy sample but with . We discuss the implications of our results on theories of star cluster formation, which appear to indicate that the power-law indicies are independent of metallicity and galactic shear rate. We also examine the evolution of visual extinction, , with cluster age and find significant reduction in median extinction after Myr by about 0.5 mag for clusters in both spiral and irregular galaxies. We discuss the implications of our results for theories of star cluster formation: the shape of the ICMF appears to be independent of metallicity and galactic shear rate.
Subject headings:
galaxies: irregular, galaxies: spiral, galaxies: star clustersDept. of Physics & Astronomy
University of Wyoming
1000 E. University Ave.
Laramie, WY 8207155affiliationtext: Current Address:
Dept. of Astronomy
University of Florida
Gainesville, FL 32611
1. Introduction
Star formation is a highly clustered process. A large fraction of stars form in clusters, as determined in our local Galactic neighborhood (Lada & Lada, 2003), in interacting galaxies like the Antennae (Fall, Chandar, & Whitmore, 2005), and in dwarf starburst galaxies such as NGC 5253 (Tremonti et al., 2001). The most massive star clusters, , are known as super star clusters (SSCs), and examples are found in all of these galactic types (Clark et al., 2005; Mengel et al., 2002; Turner, Beck, & Ho, 2000).
The study of SSCs is important for a number of reasons. Their extreme physical properties present new challenges for star-formation theories. For example, their large masses and relatively small sizes mean that their natal gas clouds must have very high pressures due to self-gravity and escape speeds that are in excess of the ionized gas sound speed (Tan, 2005). The stellar densities of the final clusters are not likely to be that much greater than typical rich young Galactic star clusters, such as the Orion Nebula Cluster, but if the initial mass function (IMF) is similar, then there are more massive OB stars present, potentially thousands within just a few parsecs of each other.
Young SSCs are likely to be similar to the progenitors of globular clusters (Gonzáles-Delgado et al., 1997; Zhang & Fall, 1999) although this requires an evolution of the initial cluster mass function (ICMF) from a power-law form to a log-normal form, likely to occur through preferential disruption of lower-mass clusters. Thus, studying nearby populations of SSCs may shed light on processes similar to those occurring in the early phases of galaxy formation.
From a practical point of view, young SSCs are the easiest clusters to identify in magnitude limited surveys of external galaxies, and so corrections for incompleteness are relatively small, allowing for more accurate determination of the ICMF. However, a disadvantage is that SSCs are relatively rare, so a large sample of galaxies needs to be surveyed to build up a good statistical sample.
While SSCs occur in many different types of galactic environments, there are many prominent examples in irregular and dwarf irregular galaxies. For example, NGC 5253 hosts a SSC (Turner, Beck, & Ho, 2000), Henize hosts several forming SSCs as revealed in the radio and mm continuum (Kobulnicky & Johnson, 1999; Johnson & Kobulnicky, 2003), NGC 1569 hosts three SSCs (Gilbert & Graham, 2003), SBS 0335-052 hosts a cluster (Plante & Sauvage, 2002), and NGC 1705 and IC 4662 host SSCs (Johnson, Indebetouw, & Pisano, 2003). Several other dwarf starburst galaxies with SSCs are described by Beck, Turner, & Kovo (2000).
Billett, Hunter, & Elmegreen (2002) discussed how the most massive cluster in a galaxy depends on the mass function and the size of the galaxy (see also Hunter et al., 2003). They argued that the most massive clusters in dwarf irregular galaxies are more massive than would be expected if their star cluster populations are similar to those of normal disk galaxies. They suggested that this result could imply that the ICMF of dwarf galaxies is not a continuous power law and that the SSCs have a different origin perhaps related to special galactic circumstances, such as an interaction with another galaxy. However, care needs to be taken with the selection of the galaxy sample; for example, if only dwarf irregular galaxies with prominent SSCs are considered, then the result will be biased. The continuity of the ICMF in dwarf galaxies is an issue that we specifically address in this paper. It is important to quantify potential differences in the ICMFs in different types of galaxies since it may illustrate how the star-formation process responds to environmental factors.
To characterize properly the masses of a population of star clusters, we need to measure the ICMF. We shall see that it can often be well fit by a power law,
| (1) |
The masses of clusters are not easily determined observationally. Dynamical masses from spectroscopic studies have been possible only for a handful of SSCs (Mengel et al., 2002; McCrady, Gilbert, & Graham, 2003). Most previous studies of cluster populations have concentrated on the luminosity function (LF), which also often resembles a power law,
| (2) |
From a sample of spiral galaxies, Larsen (2002) found . In the Antennae galaxies, Whitmore et al. (1999) found . Fall (2006) has discussed the relations between luminosity and mass functions in more detail.
For unresolved clusters, conversion from luminosity to mass requires knowledge of the age, metallicity, and reddening of the cluster together with a model for the cluster’s stellar evolution and an assumed IMF for the stars. Multi-color photometry is a minimum observational requirement for performing this conversion on a cluster-by-cluster basis and is the approach adopted in this paper using Sloan Digital Sky Survey (SDSS) data. Billett, Hunter, & Elmegreen (2002) performed a similar analysis for nearby dwarf irregular galaxies using a heterogeneous dataset from the HST archives. Their study has the advantage of high spatial resolution, but the disadvantage of a limited spectral coverage (and thus more of an uncertain conversion from luminosity to mass). Hunter et al. (2003) used ground-based data to study the cluster populations of the Large and Small Magellanic Clouds, concluding that . Zhang & Fall (1999) found for young ( Myr) clusters with masses in the merging galaxies NGC 4038/4039 using multi-wavelength, broadband HST photometry. Based on the LFs of Galactic HII regions, McKee & Williams (1997) concluded for clusters and associations.
Alternatively, the conversion from luminosity to mass can be made on a statistical basis, given assumptions about the star-formation history. Larsen (2002) showed that a cluster population with mass function with from and a uniform distribution of ages between and has an approximately power-law LF in the range with .
Comparisons of ICMFs in different galaxy types are interesting because it informs us about the star-formation process and how it may depend on different physical conditions. For example, Elmegreen & Efremov (1997) argued for a universal formation mechanism for open and globular clusters because the ICMF was similar to the mass spectrum of interstellar clouds. Differences in the mass function between dwarf galaxies and normal disk galaxies would cast doubt upon this assertion. Dwarf galaxies have quite different physical properties compared to normal disk galaxies such as typically lower metallicities and less shear due to differential rotation, and the influence of these factors on the star-formation process may imprint itself on the ICMF.
In this paper, we determine the ICMF for 13 irregular galaxies within 10 Mpc with data obtained from the fifth data release (DR5) of the SDSS. We compare this to the ICMF derived from SDSS DR5 data of three spiral galaxies, also within 10 Mpc. In Section 2, we discuss the SDSS DR5 data, the selection of our two galaxy samples (irregulars and spirals), and the procedures for finding clusters and deriving their magnitudes. Section 3 deals with extinction, age, and mass determinations of the individual star clusters. We consider the ICMF in Section 4; in particular we ask if the ICMFs of irregular and spiral galaxies are consistent with being drawn from the same parent distribution. We fit the observed ICMFs with power laws and derive their parameters. We discuss the implications of our findings in Section 5 and summarize in Section 6.
2. SDSS Data and Photometry
2.1. Sample Selection
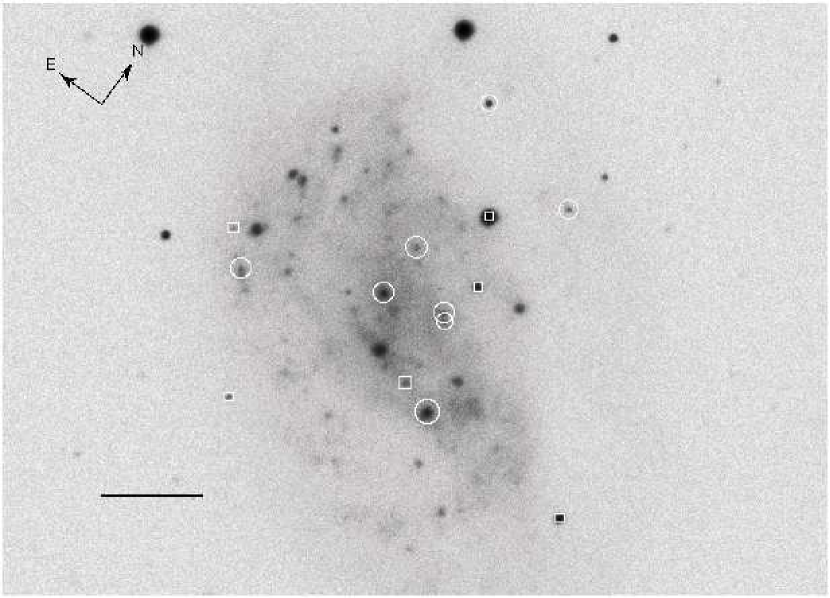
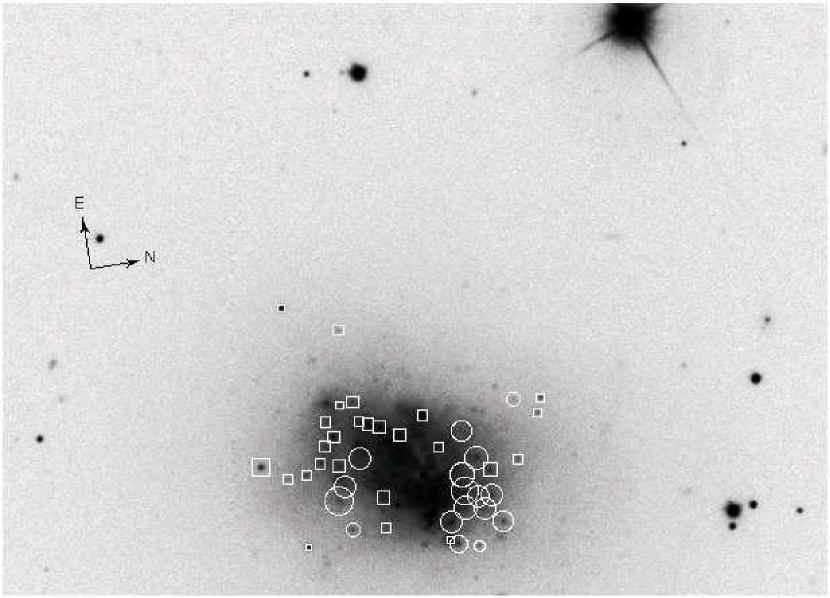
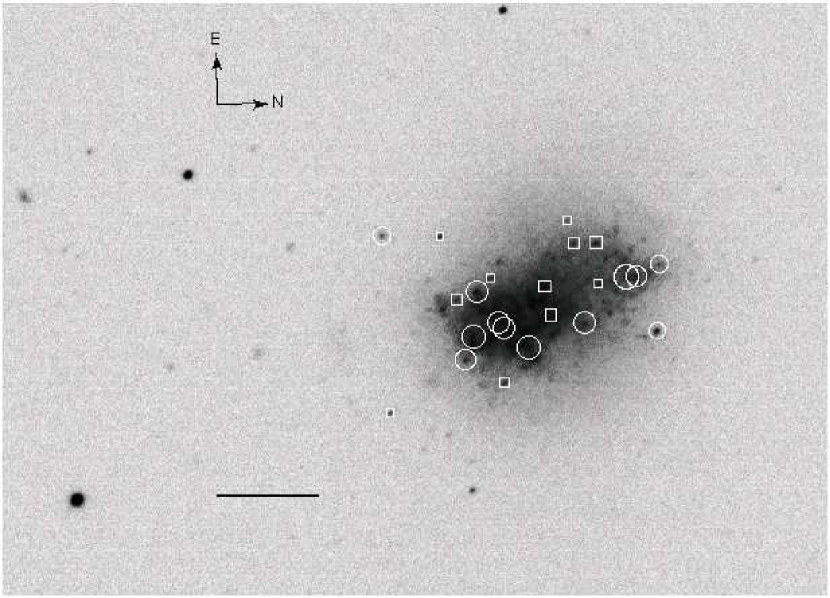
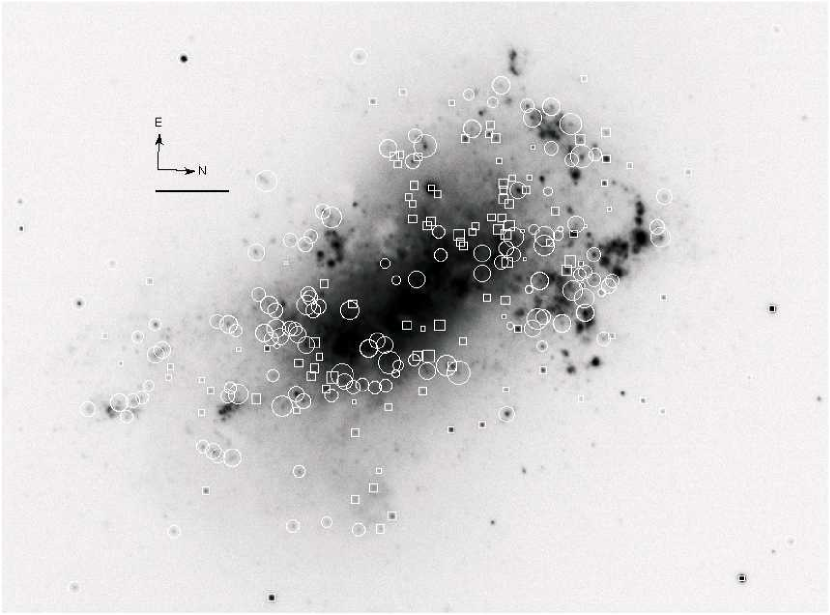
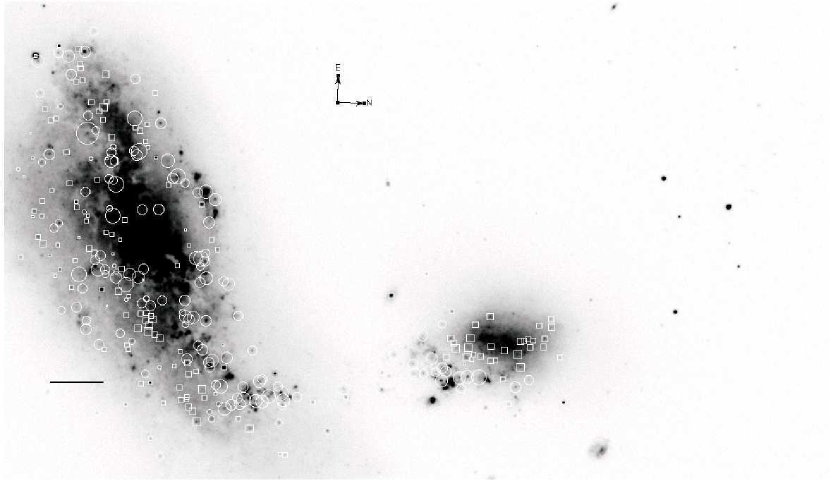
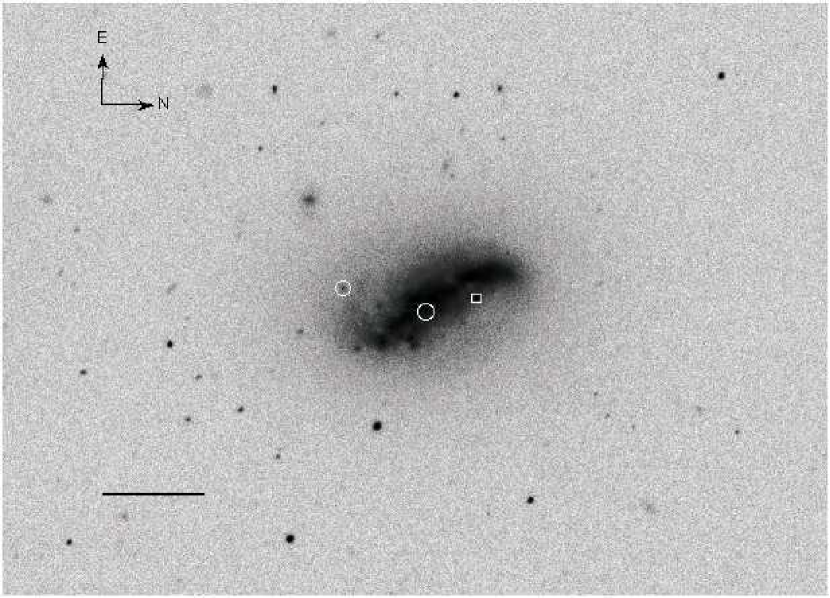
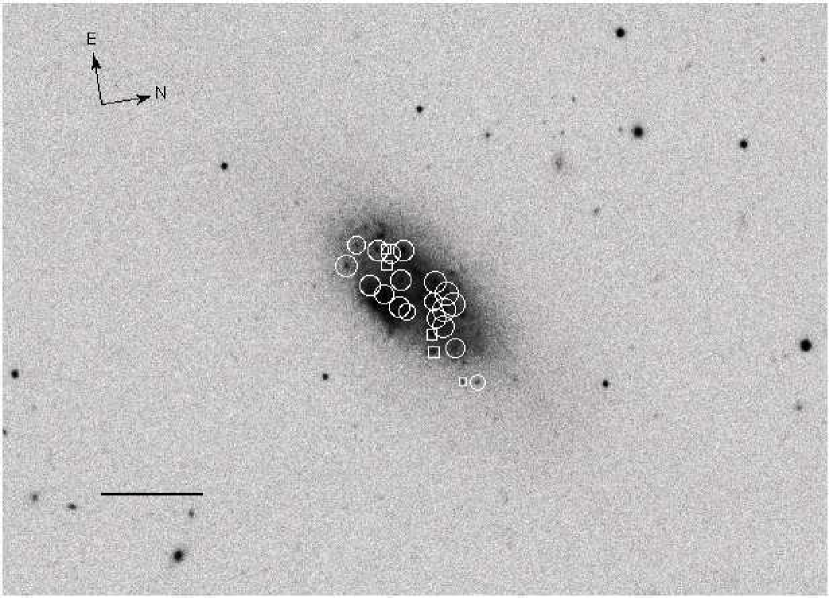
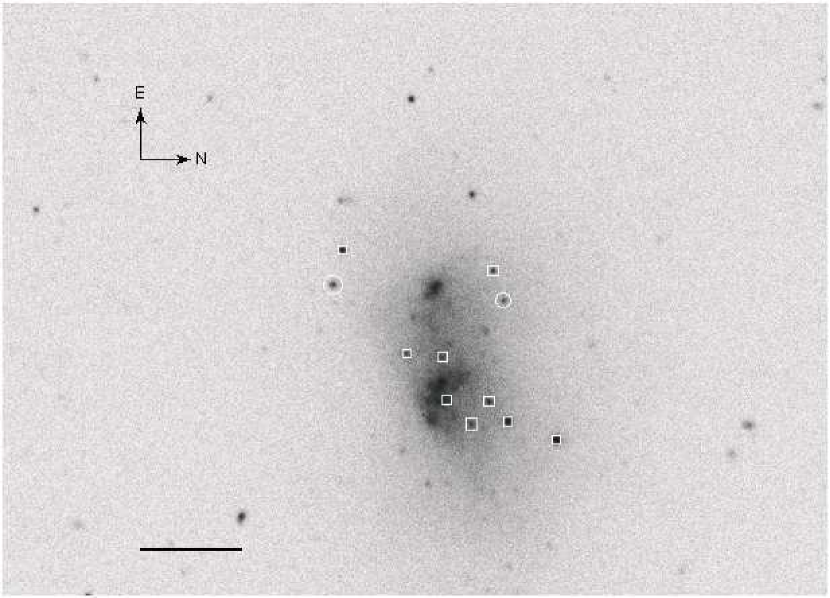
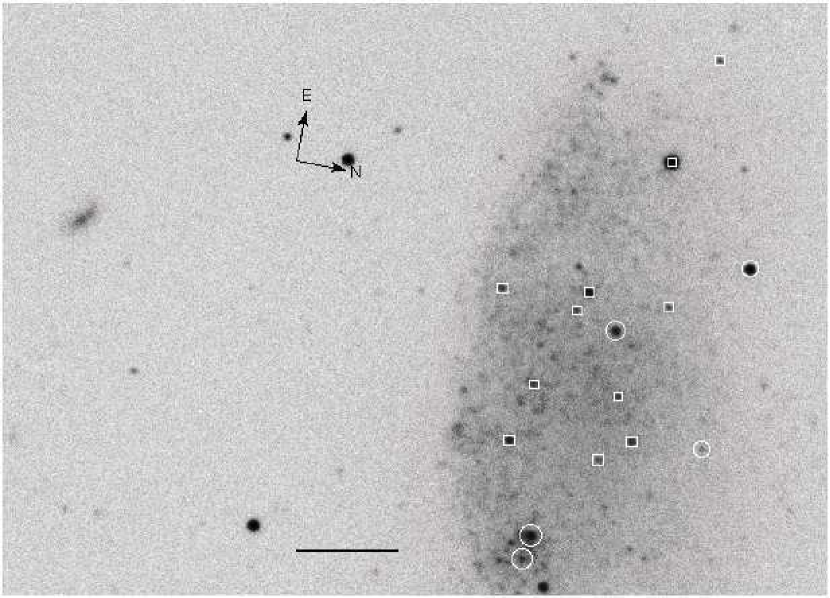
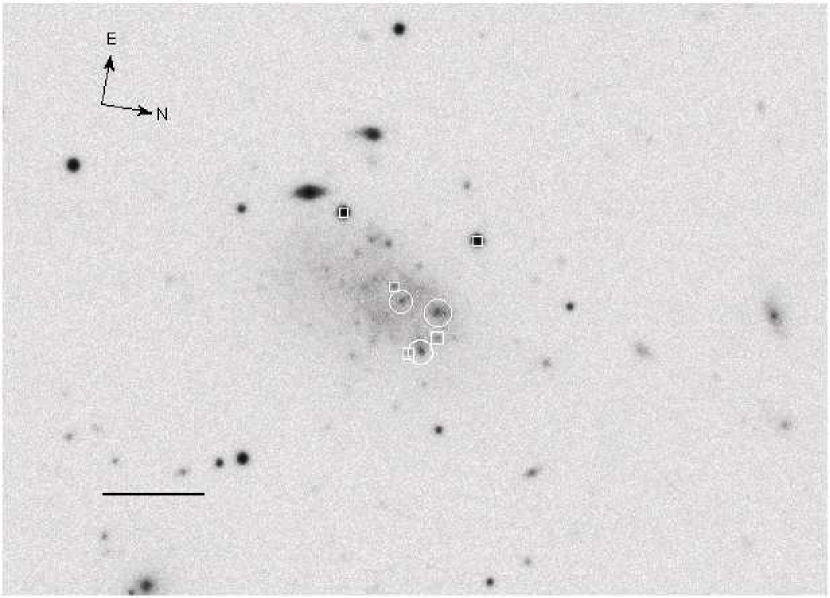
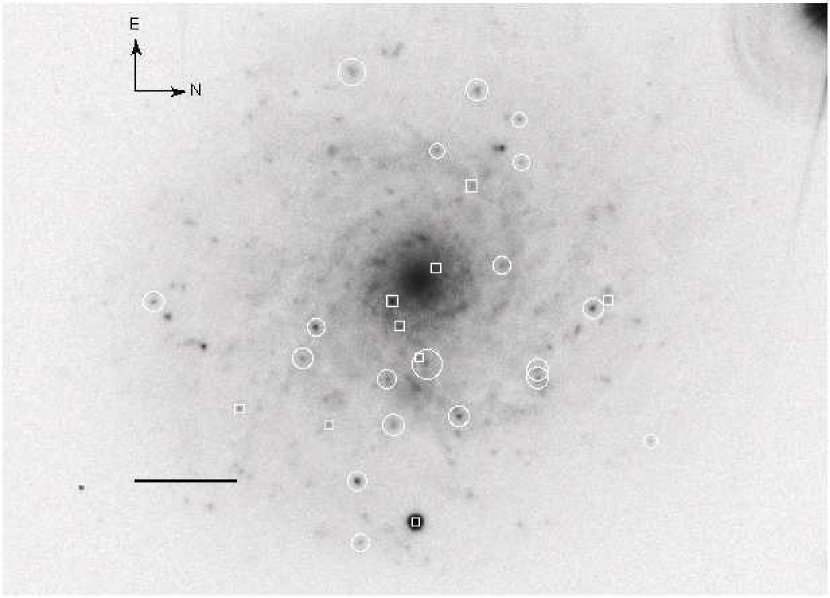
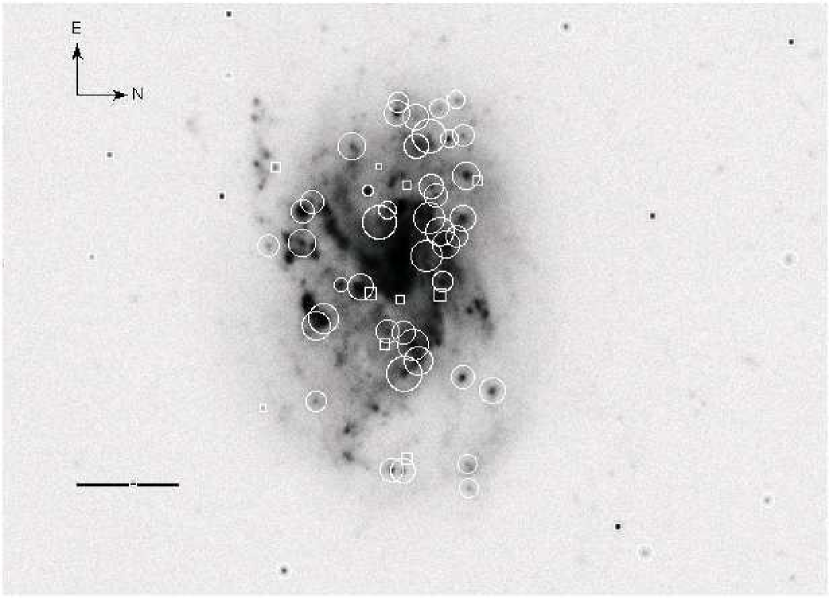
The galaxies used in this study, listed in Table THE INITIAL CLUSTER MASS FUNCTION OF SUPER STAR CLUSTERS IN IRREGULAR AND SPIRAL GALAXIES, came from a search of the Third Reference Catalog of Bright Galaxies (de Vaucouleurs et al., 1991, hereafter RC3). The selection criteria for RC3 galaxies were a magnitude 15, a Hubble stage number of , and a radial velocity 750 km s-1 (i.e., a distance 10 Mpc assuming H0=75 km s-1 Mpc-1). The list of galaxies was then cross referenced to determine the inclusion in SDSS DR5 (Adleman-McCarthy et al., 2007), producing 13 galaxies, which defines our irregular galaxy sample. SDSS DR5 images of these galaxies are shown in Figures 1-3.
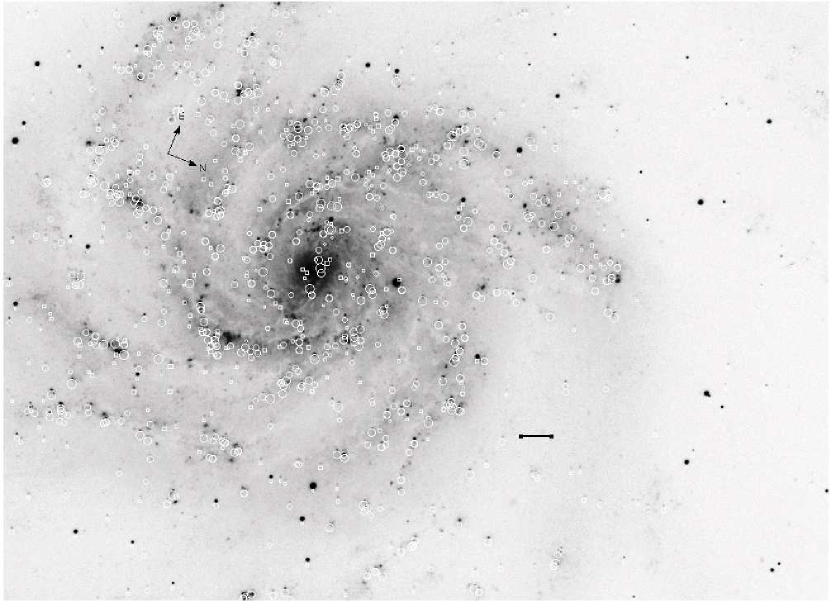
We also studied a small sample of three spiral galaxies with SDSS data (NGC 4571, NGC 4713, NGC 5457), ranging between Hubble types Sb and Sd, and distances from 5.8 to 9.5 Mpc (see Table THE INITIAL CLUSTER MASS FUNCTION OF SUPER STAR CLUSTERS IN IRREGULAR AND SPIRAL GALAXIES). SDSS DR5 images of these galaxies are presented in Figure 3.
2.2. Photometry
The only post-processing necessary for the SDSS images was to register those images (, , and ) with respect to the image coordinate system for each galaxy. Clusters were located using the SExtractor automatic catalog generation routine (Bertin & Arnouts, 1996) on the SDSS image of each galaxy. Young clusters are expected to be generally brightest in this band. To aid in the location of potential clusters embedded in the diffuse light the images were convolved with a Mexican-hat profile, with a FWHM comparable to the stellar PSF. We selected objects with signal-to-noise , chosen after some experimentation as the optimum value to allow selection of relatively faint clusters but without too many false detections.
Once the candidates were located, SExtractor was used to perform flux measurements in all four bands using elliptical Kron apertures of these objects. During these measurements, as part of the automated process, the influences of nearby objects were taken into account and masked. The degree of crowding of the typical star cluster environments in the irregular and spiral galaxy samples are similar although there is substantial variation within each sample.
Once the fluxes and apertures for each potential cluster were returned, the list of potential clusters was filtered to remove candidates with large photometric errors because of apertures that extend too close to frame edges or that overlap too much with adjacent sources. We also removed objects with sizes times that of the median stellar aperture, which corresponds to a size of about 50 pc at a typical distance of 5 Mpc, since these objects are likely to be blends of multiple clusters.
Next, the ratio of instrumental fluxes, , to the reference flux, , of cluster candidates were corrected for atmospheric extinction via
| (3) |
where is the magnitude zero-point for the given bandpass, is the extinction coefficient, and is the airmass. All parameters were obtained from the SDSS exposure parameter file associated with each science image. Once this correction has been made, the true fluxes are converted to magnitudes on the inverse hyperbolic sine magnitude system using
| (4) |
where is a band-dependent softening parameter (see Lupton, Gunn, & Szalay, 1999, for a complete description).
For each irregular and spiral galaxy, local Galactic extinction was removed using the value of obtained from the NASA/IPAC Extragalactic Database (NED). We converted this extinction to the system using Table 6 of Schlegel, Finkbeiner, & Davis (1998).
Absolute , , and magnitudes for each cluster were also computed using distances from literature searches. For all galaxies except NGC 4214, the distance was calculated from the radial velocities corrected for the infall of the Local Group toward the Virgo cluster (Terry, Paturel, & Ekholm, 2002) and a Hubble constant of 75 km s-1 Mpc-1. For NGC 4214, the distance given in Maíz-Alpellániz, Cieza, & MacKenty (2002) was used.
3. Determination of Extinction, Age, and Mass via the Color3 Plot
3.1. Evolutionary Models
Starburst99 version 5.0 (Leitherer et al., 1999) spectral energy distributions (SEDs) were generated for an instantaneous burst model with total cluster mass, Salpeter IMF, upper and lower stellar mass limits of and , ages 0.01 Myr to 1 Gyr in steps of 0.5 Myr, and metallicities of , , and . The model SEDs include contributions from both the stellar component and a nebular continuum (see Leitherer et al., 1999, for a description of the nebular conditions modeled). The magnitudes were generated from these model SEDs to derive the extinctions, ages, and masses found below. Model colors were used for age determination while model absolute magnitudes were used for mass determination.
3.2. Overview of Color3
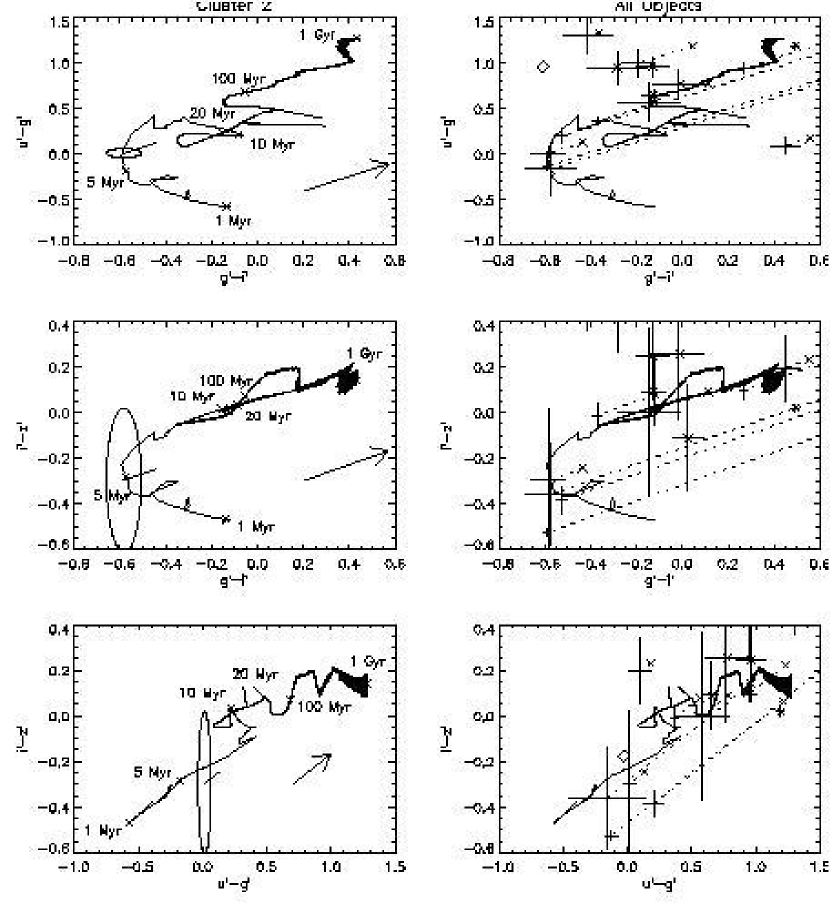
The color3 (color versus color versus color) method that we introduce here is an improvement of the age determination method of Hunter et al. (2003). The method is improved by using three broadband colors rather than two to decrease the effects of color degeneracy encountered between 7 and 21 Myr, and it also attempts to estimate the metallicity of the galaxy by minimizing the global uncertainty in the derived reddening. The color3 method consists of two routines: the dereddening routine and the mass determination routine. Internal reddening is determined by shifting the cluster colors along an reddening line in the color-color-color plot until the clusters reach a minimum (least-squares) distance from the model curve. The minimum distance was determined by computing all possible reddening values between a cluster’s initial position and the bluest and model colors in increments of 0.005 mag. In the event that removing any additional reddening from the cluster results in it moving away from the model on the color-color-color diagram an of zero is adopted. The length of the translation is then converted into an for the star cluster, and reddening corrections are applied to the absolute magnitudes.
At this point, an age and its uncertainties can be derived for the cluster by determining the model age corresponding to the closest model point to the cluster. The uncertainties of the colors are first translated the same length along the reddening line toward the model curve. Next, the uncertainties are used to define an ellipsoidal region. This region is then divided into subregions where the central colors of each are compared to the model in order to find their corresponding ages. The greatest age found is taken to be the upper limit while the least is taken to be the lower limit. After cluster ages and uncertainties were derived from the observed colors, the minimum age uncertainty of each cluster was set to the larger of 10% of the age or 1 Myr, based on the expected systematic uncertainties in the star cluster models and the expected age spreads of massive star clusters (Tan & McKee, 2004).
This method is carried out on all three model metallicities, and the results compared. The comparison examines the number of clusters for which ages have been determined and selects the model that results in the largest number of clusters. The metallicity associated with this model is taken to be the metallicity of the galaxy. This technique is equivalent to minimizing the global error between the observed colors and those predicted by the model. In the event that two or more models have the same number of clusters, the reddening dispersion is then compared. The model that corresponds to the minimum reddening dispersion is taken to be the correct metallicity. We expect the derived reddening to be constrained across the galaxy as many of the galaxies in our sample are face-on. The galaxies being face-on implies that reddening experienced by any given star cluster should be dominated by the Galactic reddening in all but the youngest clusters. It should be noted that this method does not serve as a rigorous determination of the metallicity of each galaxy.
For this work, the three broadband colors used were , , and . The and colors were chosen to help differentiate between young clusters and older stellar populations. The color was chosen since these two filters are not significantly affected by emission lines. Figure 4 shows an example of how this method derived the reddening and age of a Myr cluster in DDO 165 in addition to the dereddened colors of all clusters in DDO 165.
Once an age and its uncertainty has been determined, the mass determination routine is called. This routine uses an age and three absolute magnitudes to determine a mass for the cluster via the ratio of the observed flux in each of the three bandpasses to the model fluxes. The uncertainty in the mass is determined by using the uncertainties in the absolute magnitudes as well as the uncertainty in the age. The absolute magnitudes , , and were used in this work for mass determination since is more susceptible to contamination due to nebular emission lines.
3.3. Age Limit to Select Young Cluster
We focus on young ( Myr) clusters as these probe the initial cluster mass function most directly. From observations of clusters in the Milky Way (Lada & Lada, 2003) and other galaxies (e.g. Fall, Chandar, & Whitmore 2005), it appears as if a large fraction of clusters suffer from “infant mortality”, i.e. they are only weakly gravitationally bound, if at all, and suffer disruption so the mass function of older clusters is significantly modified from the ICMF. The younger clusters also have a higher light-to-mass ratio so a magnitude limited survey can probe their mass function down to smaller masses than is possible for older clusters. The age limit of 20 Myr also counters the problem of heavy foreground Galactic stellar contamination in the - Myr age range.
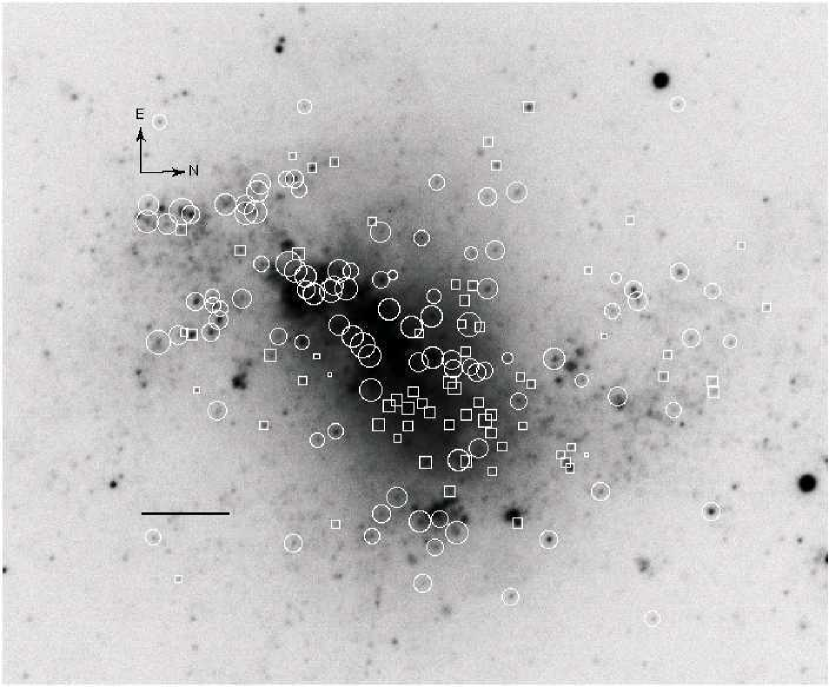
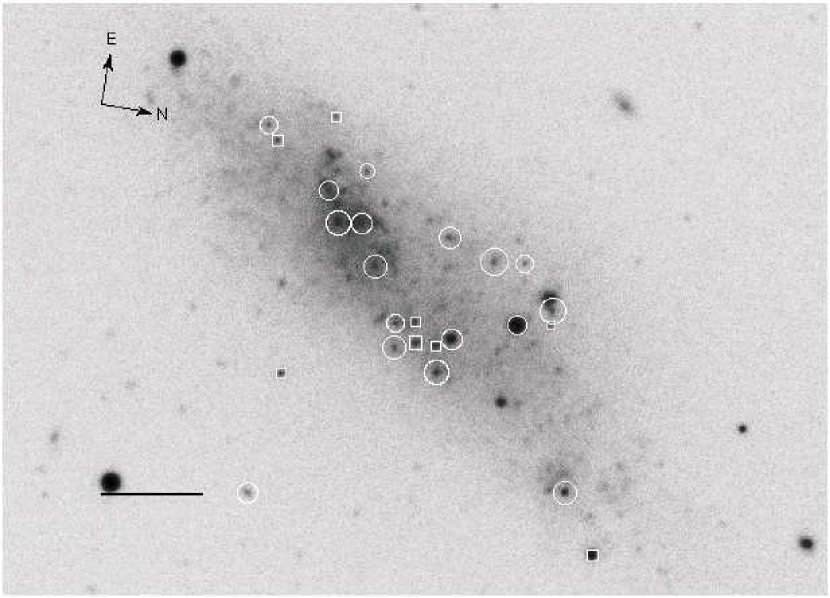
Table 2 contains the positions; absolute magnitudes; and derived reddenings, ages, and masses for the young clusters that comprise our sample. Note that this table is available in full in the electronic version of the paper. The locations of these clusters in their host galaxies are circled in the images found in Figures 1-3.
3.4. Sources of Contamination
Since we focused on the youngest star clusters, emission-line contamination of the broadband colors was possible. In addition, since the star-formation histories of these galaxies are unknown, red stellar populations from an earlier epoch may contaminate the star cluster colors. We removed those clusters from our ICMF analysis that had apparent red stellar population contamination and emission line contamination using the method described by Hunt, Thuan, & Izotov (2003). These considerations were used to create the excluded color region needed by the dereddening routine. An additional filter was applied to remove candidate clusters whose dereddened colors were greater than 3 and 0.50 mag away from the model colors. This relatively high level of 3 was chosen to counteract the color3 method’s tendency to exclude clusters with small photometric uncertainties. The 0.50 mag floor was added to address systematic uncertainties and includes considerations for uncertainties in the metallicities, reddening, and photometry. Of the 2,184 potential star clusters identified in this survey, only 48 (2.2%) were rejected by the color filters or by being 3 and 0.5 mag away from the theoretical model colors. Our subsequent analysis will assume that there is no bias introduced by this cut.
Another source of contamination is from foreground stars, background galaxies, supergiants, and stellar blends. Using SDSS data helps limit the likelihood of imaging foreground stars by restricting the galaxy sample to high Galactic latitudes. To determine the contamination level due to foreground stars and background galaxies we examined the fields around the 13 irregular galaxies. Using SExtrator, we created a sample of field objects and applied the same selection criteria to them as we did the clusters. This field sample then had ages and masses derived using color3. This allowed us to estimate the sky density of these stars and galaxies to be, on average, 0.28 contaminants per square arcminute. From this, we estimate that both the irregular and spiral galaxy samples are contaminated below the 10% level.
Supergiants and stellar blends are dealt with using a mass cut-off of . Hence, all clusters with masses below this level are expected to have some degree of contamination. This cut-off is roughly equivalent to excluding young clusters with . Subsequent analysis in this paper will ignore lower-mass clusters.
A summary of the effect on the sample sizes for the various rejection methods used in this paper can be found in Table 3. It should be noted that relatively large fractions of identified sources are rejected at the various stages of this analysis. Most of these are because of poor photometry (in any of the four bands), which can be due to the clusters being relatively faint, in relatively crowded regions, or extended (and thus likely to be blends of more than one cluster).
3.5. Sources of Systematic Error
The variety of rejection methods introduced to deal with the relatively poor angular resolution of the SDSS data (see §2.2) and the various sources of contamination (§3.4) are potential sources of systematic error. From Table 3 it is clear that the size of the initial sample is affected most by rejection techniques that use a combination of SExtractor quality flags and photometric aperture size. The initial sample selection is strongly influenced by the angular resolution, especially in regions where the diffuse galactic light is prominent. The detection method described in §2.2 minimizes the effect of diffuse light on source selection for the majority of the star-forming area of each galaxy. Detections in the nuclear regions, however, are still limited due to a combination of strong galactic light and the proximity of sources to each other. This proximity makes it difficult to estimate the flux contributions of the other sources and increases the uncertainty in the fluxes to %. This has a potential to influence the derived ICMF in two ways. First, it reduces the overall number of clusters that are used to determine the ICMF and can increase the uncertainties in the power-law fits. Second, some galaxies (e.g., NGC 4449, [Böker et al. 2001]) have numerous young clusters that are the result of a nuclear starburst. In not being able to accurately measure clusters that may be part of such a nuclear starburst, the initial sample may be skewed toward older clusters where sufficient time has passed so that “infant mortality” (Lada & Lada, 2003), over the first 20 Myr, has altered at least the low-mass end of the ICMF. In addition, the rate of nuclear starburst activity may be different between the galaxies that compose the irregular and spiral samples, thus leading to difficulties in comparing the two derived ICMFs.
The photometric problem of many sources in close proximity to each other also manifests itself in regions where potential clusters themselves are highly clustered. If young star clusters preferentially form clustered around their parent giant molecular cloud (GMC), then excluding these clusters would bias the selection method against the youngest clusters. Within each sample this could lead to the ICMF being derived from a population of clusters that has already undergone some evolution and disruption. In addition, the degree of clustering in irregular and spiral galaxies may be different due to the large difference in galactic properties (Section 1). This difference would make direct comparisons between the two samples more difficult.
Subsequent analysis in this paper assumes that the potential systematic errors in the sample selection method affect both the irregular and spiral samples to the same extent. Furthermore, we assume that the potential systematic errors do not bias our derived ICMFs in such a way that a direct comparison between the two samples is inappropriate.
Systematic errors can also be introduced by the color3 analysis method both through limitations in the analysis approach and through the low spatial resolution of the data. de Grijs et al. (2005) reviewed a variety of broadband imaging techniques, including a multi-parameter minimization technique similar to the color3 method used here, that are used to derive star cluster parameters. Using HST data for 17 clusters in NGC 3310 and 20 clusters in the Antennae galaxies they study the absolute systematic uncertainties associated with these broadband methods. In Tables A1-A10 of de Grijs et al. (2005) they find that multi-parameter minimization techniques systematically derive higher cluster masses than other methods. However, they note that the relative age and mass distributions within a population of clusters are robust across the various methods, i.e., observed features in either distribution are likely to be related to features in the true distribution. Thus, any systematic errors introduced by the analysis method are not likely to influence the overall shape of the derived ICMF.
4. Derivation of the ICMF and Comparison Between Irregular and Spiral Galaxies
4.1. Completeness Corrections
The completeness and sample bias corrections described by Larsen (1999) were applied to all galaxies with 20 or more detected clusters. For these tests, 30 sets of randomly generated artificial clusters with masses between and were inserted into the image of each galaxy. The number of artificial clusters was set to one-quarter the number of clusters found. This dynamic factor helps to reduce overcrowding in smaller galaxies while better sampling larger galaxies. The magnitudes used for these test clusters came from the appropriate metallicity Starburst99 models. We limited the completeness and bias corrections to clusters more massive than to avoid contamination contributed by supergiants and stellar blends. The artificial clusters used in this test were uniformly distributed in age between 2 and 20 Myr. Masses were sampled from a power-law distribution with an index of -1.7. The spatial distribution of these clusters was determined by fitting an ellipse to the observed cluster distribution and altering the semi-major axis until 90% of the observed clusters were contained in this ellipse. Once these parameters of the ellipse were determined, the artificial clusters were randomly distributed throughout its interior. As a final measure to insure that clusters generated were as authentic as possible, random amounts of reddening were added to the model magnitudes. The reddening was uniformly distributed between an of 0.02 mag and the median reddening magnitudes determined for the particular galaxy. At this point, the artificial clusters were added to the images using IRAF’s “mkobjects” routine.
Once the artificial clusters were added to the images, the SExtractor routine was executed on the images using the parameters found in §2.1. The returned object list was then compared with the list of artificial clusters to determine the number of clusters recovered. These results were then averaged across the various samples to arrive at the completeness corrections presented in Table 4 for both the irregular and spiral samples. For the lowest mass bin that we consider, , we estimate that our method of finding young clusters is 79% complete for the irregular galaxy sample and 92% complete for the spiral galaxy sample. Higher angular resolution optical searches by HST would help us to probe regions of diffuse stellar light deeper and detect the less massive clusters with a higher detection rate.
4.2. Variation of Cluster Frequency within the Galaxy Samples
It should be noted that the frequency at which massive clusters appear in our galaxy samples varies greatly. From Table THE INITIAL CLUSTER MASS FUNCTION OF SUPER STAR CLUSTERS IN IRREGULAR AND SPIRAL GALAXIES we see that three galaxies dominate the irregular sample of massive () clusters: NGC 4449, NGC 4485/4490, and NGC 4656. Using our derived Hubble flow distances and the apparent B-band magnitudes from the RC3 yields absolute magnitudes of , , and , respectively. This range of magnitudes places these galaxies at the high end of the irregular galaxy luminosity distribution. Only one of these galaxies, NGC 4656, has a classification other than ImB. Its classification of SB/Sm(p) is likely due to its optical appearance (see Figure 2) being almost linear, with the possible remnant of a spiral arm toward the northeast.
In the small spiral sample, NGC 5457 contributes about 90% of the massive clusters. Thus, our comparison of the mass functions of the two galaxy samples is in essence a comparison of the clusters in NGC 5457 to those in NGC 4449, NGC 4485/4490, and NGC 4656. Larger samples of galaxies are needed to improve upon this situation.
4.3. The Initial Cluster Mass Functions
The young ( Myr) clusters were binned logarithmically by mass using the bin-sizing method described in Scott (1979). This sizing procedure takes into consideration the standard deviation of the data along with the total number of data points to reduce any bias introduced by binning. For our data set, this resulted in a bin size of 0.20 dex. We applied completeness corrections to each bin and assumed a combination of Poissonian uncertainty and uniform systematic uncertainties of 30% in the bin amplitudes. Histograms for both samples are presented in Figure 5. In each case, the distribution of clusters spans approximately the same range in mass. Thus, despite being physically smaller and possessing different internal conditions, irregulars are capable of producing clusters with the same mass range as spirals.
We fit power laws, , to the ICMF in the range , assuming errors for each bin that are a combination of Poisson and a 30% systematic error added in quadrature. For the irregular ICMF, we derive and for the spiral ICMF we derive . The histograms along with linear regression fits are plotted in Figure 6.
The power-law indicies that we derive for these ICMFs are comparable to, though somewhat shallower than, those derived by some other researchers. For example, Hunter et al. (2003) found an index of to for LMC and SMC clusters in the mass range 10. Larsen (2002) found an index of for clusters in disk galaxies. Zhang & Fall (1999) found the same index of for young ( Myr) clusters with masses M in the merging galaxies NGC 4038/4039. Cresci, Vanzi, & Sauvage (2004) found a index of for young ( 20 Myr) clusters in the mass range - in the irregular galaxy NGC 5253.
However, the absolute values of the power-law slopes are likely to be influenced by the differing spatial resolutions of these studies. In particular our analysis uses SDSS data with relatively poor spatial resolution compared to, for example, HST images so it is likely that some of our more massive clusters are, in fact, blends of adjacent smaller clusters, and this could affect the shape of the derived ICMF. As an example of this kind of effect, in the Antennae galaxies Whitmore & Schweizer (1995) found a cluster LF with a power-law slope of using pre-refurbished HST data while Whitmore et al. (1999) found a slope of using higher resolution, post-refurbished HST data. In a future study, we will examine this effect in a subset of our cluster samples using HST data.
Another factor that could lead to systematic variations in the cluster mass functions between different studies is the varying amounts of spectral coverage of the observations, leading to different uncertainties in the accuracy of derived cluster ages, reddening, and masses. The SDSS data that we use here have the advantage of a relatively broad spectral coverage and is homogeneous across our samples.
From our results, there is some evidence from the lowest-mass bins () in both the spiral and irregular samples that the single power-law description may break down at these masses, even after completeness corrections have been made. We detect relatively few clusters in the mass range M , and this contrasts with some previous studies (e.g., Hunter et al. 2003 study of the LMC and SMC). It is possible that our completeness correction has been underestimated; for example, some of the filtering that we carry out for the cluster sample based on colors and nebular line contamination may tend to remove lower-mass clusters, and this possible bias is hard to quantify. Another possibility is that, again, the relatively poor spatial resolution of our galaxy images may cause us to group together associations of several smaller clusters into a single object, which we treat as a “cluster”. The size of the point-spread function is several tens of parsecs at the typical distance of galaxies in our sample. This hypothesis could be tested by seeing if the young association (i.e. groups of young stars within pc of each other) mass functions in the LMC, SMC, and nearby spirals show a break at .
Our ICMF power-law index of for irregular galaxies over the mass range - is consistent within the uncertainties to that derived from the spiral galaxy sample, i.e. .
We have also compared the spiral and irregular raw ICMFs (i.e. with no completeness corrections applied) for masses above using a Kolmogorov-Smirnov test. There are 321 such clusters in the irregular galaxies and 358 in the spirals. This test yields a p-value of 0.633, indicating that the distributions are statistically indistinguishable.
5. Discussion: Implications for Star-Formation Theories
5.1. Effect of Galactic Shear
The ICMFs in dwarf and spiral galaxies appear to be very similar in spite of the relatively major differences between these galaxy types.
Irregular galaxies tend to have rotation curves that are rising with increasing galactocentric radius. This contrasts with the more nearly flat rotation curves of typical spiral galaxies, such as those making up our sample of spirals. In particular NGC 5457 is classed with a Hubble stage of 6.0 and has an extended Hubble type of SABcd(rs), indicating it is a mixed bar and non-barred type, somewhere in between Sc and Sd in terms of the winding of the arms, and the internal organization in the galaxy consists of a mixture between an inner ring and spiral arms. The rotation curve of this galaxy is not as flat as a classic, earlier-type spiral, i.e. it shows a sharp increase within the innermost 1 kpc, then is flat out to 5 kpc, then increases again, peaking at about 250 around 8 kpc (Sofue et al., 1999). However, it should be noted that we do not generally have detailed information on the rotation curves of the galaxies in our irregular and spiral samples. A flat rotation curve means that gas experiences large shearing motions due to differential rotation in the disk. This enhances the collision rate between GMCs (Tan, 2000). Shear is absent in a rotation curve that rises linearly with radius (i.e. solid body rotation). The observed similarity of the ICMFs in irregular and spiral galaxies implies that the process determining the masses of clusters does not depend on galactic shear and is, thus, probably operating on scales smaller than the tidal radius of giant molecular clouds in a typical flat rotation curve spiral, i.e. pc. Zhang, Fall, & Whitmore (2001) and Whitmore et al. (2005) found a similar lack of influence of shearing velocity gradients on cluster formation in the Antennae galaxies.
According to the model for star-cluster formation by Elmegreen & Efremov (1997), the mass function of clusters reflects that of unstable interstellar gas clouds, and a universal cluster mass function from galaxy to galaxy reflects the universal nature of turbulence, at least on scales relevant to star cluster formation. Our results are consistent with this universal model.
One explanation for the global star formation rates in galaxies (Kennicutt, 1998) is the triggering of star formation by cloud collisions (Tan, 2000), the rate of which depends on the galactic shear rate. The main prediction of this model is a smaller star-formation efficiency per orbital time in irregular galaxies compared to spirals. The data presented in this paper can be used to estimate global star-formation rates in these galaxies. With data on the gas content of the star-forming regions of these galaxies (e.g. Leroy et al. 2005), this question will be able to be addressed.
5.2. Effect of Metallicity
Irregular galaxies, being typically of smaller mass and with a higher gas fraction than normal spiral galaxies, tend to have much lower metallicities. This does not appear to have any bearing on the ICMF. Note that the range in metallicity of the Starburst99 models considered, -, is not an accurate assessment of the range in metallicities of our galaxy samples, and the metallicity recorded in Table 2 for each galaxy is a somewhat arbitrary choice intended to maximize the number of clusters found by the color3 method (see §3.2). Good measurements of the metallicities of the galaxies in our samples are not generally available, so a more quantitative discussion of the range of metallicity over which the ICMF is invariant is not possible at this stage.
One mechanism by which metallicity might be expected to affect star formation involves the degree of ionization and heating inside molecular clouds due to far-UV photons. In a higher metallicity cloud with a higher dust-to-gas ratio and higher mean extinction, the far-UV photons do not penetrate as easily. If magnetic fields are important for preventing GMC collapse and thus regulating star formation (McKee, 1989) and if the creation of magnetically super-critical regions occurs primarily via ambipolar diffusion in regions of low ionization, then one expects such regions to require smaller amounts of shielding gas in a higher metallicity galaxy. In other words, shielding a given mass of gas in a low-metallicity galaxy requires it to be in the center of a more massive GMC, i.e. with a larger total mass surface density, , than in a high-metallicity galaxy. The pressure due to the self-gravity of the gas will be of order , and the combination of higher pressure and more surrounding material may lead to higher star-formation efficiencies and higher-mass clusters. See Tan & McKee (2004) for a more extensive discussion of feedback processes in forming SSCs. Since we do not observe such a difference in the ICMFs of (presumably lower metallicity) irregulars and (presumably higher metallicity) spirals, we conclude that either magnetically super-critical regions are created by turbulent diffusion of field strength rather than ambipolar diffusion or that other processes, such as turbulent fragmentation, set the ICMF on scales smaller than the super-critical regions of GMCs.
5.3. Continuity of the ICMF
Since the derived star cluster masses presented for the irregular galaxy sample cover a wide range of masses, we are able to examine the question of the continuity of the ICMF discussed in Billett, Hunter, & Elmegreen (2002). The significant linear correlation p-value () for the power-law fits implies that the ICMF is well modeled by a single power law in the - mass range. We conclude that the ICMF in our sample of irregulars is well described by a continuous power law. Due to completeness and stellar contamination issues in the lower mass bins, the only conclusion that can be drawn about the issue of continuity is that if a break in the power law exists, it occurs for clusters with masses .
It should be noted that a power-law index of implies that the total star formation occurring in clusters (in a given mass range) is dominated by that in the largest clusters. If the ICMF does not significantly steepen below , then our results imply that the star formation in irregular and spiral galaxies is dominated by that occurring in SSCs or super associations. However, the derived power-law indicies of our ICMFs are close to , and at this value each logarithmic interval in cluster mass contributes equally to the total mass of new stars.
5.4. Evolution of Extinction
We expect that younger clusters should suffer from a greater amount of local extinction relative to older clusters. To test this hypothesis, we examined how the local extinction estimate for our clusters varied with cluster age. In Figure 7, we see an apparent decrease in the cluster extinction with age. We also note that there are no clusters younger than 5 Myr that have an less than 0.1 mag while 15% of clusters in irregulars and 28% of clusters in spirals older than 5 Myr have an less than 0.1 mag. Performing a linear fit between the extinctions and ages we derive that an average cluster in an irregular galaxy has decrease by 0.19 mag Myr-1, while an average cluster in a spiral galaxy has decrease by 0.16 mag Myr-1.
The above results imply that 5-10 Myr is the characteristic timescale for a cluster to destroy or move away from its natal molecular cloud, which is consistent with estimates of this timescale based on studies of young Galactic star clusters (Leisawitz, Bash, & Thaddeus, 1989). Whitmore & Zhang (2002) and Mengel et al. (2005) have found similar results from extragalactic studies of massive young clusters.
We examined the mass dependence of these relations, defining a “low-mass” sample from to and a “high-mass” sample from to . The high-mass clusters in irregular and spiral galaxies start with high values of mean at zero age of 5.29 and 5.41 mag, respectively. The corresponding values for the low-mass clusters are 1.95 and 1.44 mag. The rates of decrease of are -0.29 and -0.33 mag Myr-1 for the high-mass clusters in irregular and spiral galaxies, respectively, while the rates are and mag Myr-1 for the low-mass clusters, respectively. Thus the 5-10 Myr timescale for reduction in extinction is similar for all these sub-samples.
6. Summary
We have presented the age and masses determined for 321 young ( Myr) star clusters in 13 irregular galaxies and 358 young star clusters in three spiral galaxies based on an automated analysis of SDSS data. From this, we have found the irregular ICMF to be well fit by a power law with for clusters over the - mass range. The equivalent index for the spiral ICMF was found to be . The irregular and spiral ICMFs are statistically indistinguishable in spite of expected differences in galactic shear and metallicity.
Our derived ICMFs are slightly top-heavy compared to some previous studies, perhaps because of the generally poorer spatial resolution of the SDSS data; it is likely that many of our more massive “clusters” are blends of adjacent smaller clusters. Nevertheless, this does not affect our conclusion on the similarity of the irregular and spiral ICMFs since these data were analyzed in the same way and share the same systematic errors.
We also find a characteristic timescale of about 5-10 Myr for clusters to move away from or destroy their natal gas and dust clouds.
References
- Adleman-McCarthy et al. (2007) Adelman-McCarthy, J., et al. 2007, ApJS, 172, 823
- Beck, Turner, & Kovo (2000) Beck, S., Turner, J., & Kovo, O. 2000, AJ, 120, 244
- Bertin & Arnouts (1996) Bertin, E. & Arnouts, S. 1996, A&AS, 117, 393
- Billett, Hunter, & Elmegreen (2002) Billett, O., Hunter, D., & Elmegreen, B. 2002, AJ, 123, 1454
- Böker et al. (2001) Böker, T., van der Marel, R., Mazzuca, L., Rix, H.-W., Rudnick, G., & Ho, L. 2001, AJ, 121, 1473
- Clark et al. (2005) Clark, J., Negueruela, I., Crowther, P., & Goodwin, S. 2005, A&A, 434, 949
- Cresci, Vanzi, & Sauvage (2004) Cresci, G., Vanzi, L., & Sauvage, M. 2005, A&A, 433, 447
- de Grijs et al. (2005) de Grijs, R., Anders, P., Lamers, H., Bastian, M., Fritze-v. Alvensleben, U., Parmentier, G., Sharina, M., & Yi, S. 2005, MNRAS, 359, 874
- de Vaucouleurs et al. (1991) de Vaucouleurs, G., de Vaucouleurs, A., Corwin, H., Buta, R., Paturel, G., & Fouqué, P. 1991, Third Reference Catalogue of Bright Galaxies (New York:Springer)
- Elmegreen & Efremov (1997) Elmegreen, B. & Efremov, Y. 1997, ApJ, 480, 235
- Fall (2006) Fall, S. 2006, ApJ, 652, 1129
- Fall, Chandar, & Whitmore (2005) Fall, S., Chandar, R., & Whitmore, B. 2005, ApJ, 631, L133
- Gilbert & Graham (2003) Gilbert, A., & Graham, J. 2003, in 25th meeting of the IAU, Joint Discussion 6, 17 July 2003, Sydney, Australia, Extragalactic Globular Clusters and their Host Galaxies
- Gonzáles-Delgado et al. (1997) González-Delgado, R., Leitherer, C., Heckman, T., & Cerviõ, M. 1997 ApJ, 483, 705
- Hunt, Thuan, & Izotov (2003) Hunt, L., Thuan, T., & Izotov, Y. 2003, ApJ, 588, 281
- Hunter et al. (2003) Hunter, D., Elmegreen, B., Dupy, T., & Mortonson, M. 2003, AJ, 126, 1836
- Johnson, Indebetouw, & Pisano (2003) Johnson, K., Indebetouw, R., & Pisano, D. 2003, AJ, 126, 101
- Johnson & Kobulnicky (2003) Johnson, K. & Kobulnicky, H. 2003, ApJ, 597, 923
- Kennicutt (1998) Kennicutt, R. 1998, ApJ, 498, 541
- Kobulnicky & Johnson (1999) Kobulnicky, H. & Johnson, K. 1999, ApJ, 527, 154
- Lada & Lada (2003) Lada, C. & Lada, E. 2003, ARA&A, 41, 57
- Larsen (1999) Larsen, S. 1999, A&AS, 139, 393
- Larsen (2002) Larsen, S. 2002, AJ, 124, 1393
- Leisawitz, Bash, & Thaddeus (1989) Leisawitz, D., Bash, F., & Thaddeus, P. 1989, ApJS, 70, 731
- Leitherer et al. (1999) Leitherer, C., Schaerer, D., Goldader, J., Delgado, R., Robert, C., Kune, D., de Mello, D., Devost, D., & Heckman, T. 1999, ApJS, 123, 3
- Leroy et al. (2005) Leroy, A., Bolatto, A., Simon, J., & Blitz, L. 2005, ApJ, 625, 763
- Lupton, Gunn, & Szalay (1999) Lupton, R., Gunn, J., & Szalay, A. 1999, AJ, 118, 1406
- Maíz-Alpellániz, Cieza, & MacKenty (2002) Maíz-Alpellániz, J., Cieza, L., & MacKenty, J. 2002, AJ, 123, 1307
- Maraston et al. (2004) Maraston, C., Bastian, N., Saglia, R. P., Kissler-Patig, M., Schweizer, F., Goudfrooij, P. 2004, A&A, 416, 467
- McCrady, Gilbert, & Graham (2003) McCrady, N., Gilbert, A., & Graham, J. 2003, ApJ, 596, 240
- McKee (1989) McKee, C. 1989, ApJ, 345, 782
- McKee & Williams (1997) McKee, C. F., & Williams J. 1997, ApJ, 476, 144
- Mengel et al. (2005) Mengel, S., Lehnert, M., Thatte, N., & Genzel, R. 2005, A&A, 443, 41
- Mengel et al. (2002) Mengel, S., Lehnert, M., Thatte, N., & Genzel, R. 2002, A&A, 383, 137
- Patureal et al. (2003) Patureal G., Petit C., Prugniel P., Theureau G., Rousseau J., Brouty M., Dubois P., Cambresy L. 2003, A&A, 412, 45.
- Plante & Sauvage (2002) Plante, S. & Sauvage, M. 2002, AJ, 124, 1995
- Schlegel, Finkbeiner, & Davis (1998) Schlegel, D., Finkbeiner, D., & Davis, M. 1998, ApJ, 500, 525
- Scott (1979) Scott, D. 1979, Biometrika, 66, 605
- Sofue et al. (1999) Sufue, Y., Tutui, U., Honma, M., Tomita, A., Takamiya, T., Koda, J., & Takeda, Y. 1999, ApJ, 523, 136
- Tan (2005) Tan, J. 2005, in Cores to Clusters: Star Formation with Next Generation Telescopes, eds. M. S. N. Kumar, M. Tafalla, & P. Caselli, (Berlin: Springer), 87, (astro-ph/0504256)
- Tan (2000) Tan, J. 2000, ApJ, 536, 173
- Tan & McKee (2004) Tan, J., & McKee, C. 2004, in ASP Conf. Ser. 322, The Formation and Evolution of Massive Young Clusters in Giant Molecular Clouds, eds. H.J.G.L.M. Lamers, L.J. Smith, & A. Nota. (San Francisco, CA: ASP), 263
- Terry, Paturel, & Ekholm (2002) Terry, J., Paturel, G., & Ekholm, T. 2002, A&A, 393, 57
- Tremonti et al. (2001) Tremonti, C., Calzetti, D., Leitherer, C., & Heckman, T. 2001, ApJ, 555, 322
- Turner, Beck, & Ho (2000) Turner, J., Beck, S., & Ho, P. 2000, ApJ, 532, 109
- Whitmore et al. (2005) Whitmore, B., Gilmore, D., Leitherer, C., Fall, S., Chandar, R., Blair, W., Schweizer, F., Zhang, Q. & Miller, B. 2005, AJ, 130, 2104
- Whitmore & Schweizer (1995) Whitmore, B., & Schweizer, F. 1995, AJ, 109, 960
- Whitmore & Zhang (2002) Whitmore, B., & Zhang, Q. 2002, AJ, 124, 1418
- Whitmore et al. (1999) Whitmore, B., Zhang, Q., Leitherer, C., Fall, S., Schweizer, F., & Miller, B. 1999, AJ, 118, 1551
- Zhang & Fall (1999) Zhang, Q. & Fall, S. 1999, ApJ, 527, L81
- Zhang, Fall, & Whitmore (2001) Zhang, Q. Fall, S., Whitmore, B. 2001, ApJ, 561, 727


| Galaxy | R.A. | Dec. | Hubble Stage | Distance | |||
|---|---|---|---|---|---|---|---|
| (J2000.0) | (Type) | (km s-1) | (Mpc) | M M☉ | |||
| Irregulars | |||||||
| NGC 2552 | 9.0 (SA(s)m) | -17.3 | 699 | 9.32 | 5 | ||
| NGC 3738 | 10.0 (Im) | -16.8 | 464 | 6.19 | 8 | ||
| NGC 4190 | 10.0 (Im(p)) | -14.8 | 415 | 5.53 | 7 | ||
| NGC 4214 | 10.0 (IAB(s)m) | -17.1 | 291 | 2.98 | 9 | ||
| NGC 4449 | 10.0 (ImB) | -18.8 | 422 | 5.63 | 55 | ||
| NGC 4485 | 10.0 (ImB(sp)) | -17.5 | 690 | 9.20 | 90 | ||
| NGC 4656 | 9.0 (SB/Sm(p)) | -18.7 | 646 | 8.61 | 65 | ||
| IC 3521 | 10.0 (ImB) | -16.0 | 663 | 8.84 | 1 | ||
| UGC 6541 | 10.0 (Im) | -13.0 | 249 | 3.32 | 3 | ||
| UGC 7408 | 10.0 (ImA) | -16.4 | 683 | 9.11 | 2 | ||
| DDO 165 | 10.0 (Im) | -15.3 | 312 | 4.16 | 1 | ||
| DDO 167 | 10.0 (Im) | -11.6 | 400 | 5.33 | 0 | ||
| DDO 168 | 10.0 (ImB) | -16.1 | 426 | 5.68 | 1 | ||
| Spirals | |||||||
| NGC 4571 | 6.5 (SAd(r)) | -17.0 | 435 | 5.80 | 2 | ||
| NGC 4713 | 7.0 (SABd(rs)) | -17.7 | 715 | 9.54 | 33 | ||
| NGC 5457 | 6.0 (SABcd(rs)) | -20.8 | 503 | 6.71 | 379 | ||
References. — Coordinates and radial velocities were taken from NASA/IPAC Extragalactic Database (NED), and morphologies are from RC3. Distances are from LEDA (Patureal et al., 2003) except for Maíz-Alpellániz, Cieza, & MacKenty (2002) (NGC 4214). s are derived from the apparent B-band magnitudes found in RC3 and our adpoted distances.
| ID | RA | Dec. | Age | Mass | |||||
|---|---|---|---|---|---|---|---|---|---|
| (J2000.0) | (mag) | (Myr) | |||||||
| NGC 2552 () | |||||||||
| 3 | 08 19 17.29 | +50 00 14.3 | 0.00 | -11.400.02 | -11.780.01 | -11.040.02 | -11.200.08 | ||
| 6 | 08 19 18.51 | +50 00 38.7 | 0.00 | -9.620.05 | -9.710.03 | -9.510.04 | -10.030.15 | ||
| 7 | 08 19 18.71 | +50 00 40.5 | 0.84 | -11.000.06 | -11.030.03 | -10.100.03 | -10.710.13 | ||
| 8 | 08 19 20.53 | +50 00 34.7 | 2.52 | -14.430.03 | -14.400.01 | -12.030.01 | -13.420.03 | ||
| 11 | 08 19 24.48 | +50 00 15.4 | 0.93 | -11.350.04 | -11.180.02 | -9.850.03 | -10.030.22 | ||
| 13 | 08 19 20.56 | +50 00 51.3 | 0.01 | -9.200.08 | -9.370.05 | -9.620.04 | -9.850.18 | ||
| 16 | 08 19 17.53 | +50 01 27.1 | 0.28 | -10.160.05 | -10.050.04 | -9.140.07 | -8.920.51 | ||
| 17 | 08 19 21.43 | +50 01 38.0 | 4.68 | -15.770.17 | -15.740.02 | -12.060.01 | -14.570.02 | ||
| NGC 3738 () | |||||||||
| 2 | 11 35 45.59 | +54 31 43.8 | 3.46 | -11.250.54 | -10.960.08 | -8.160.06 | -10.080.14 | ||
| 5 | 11 35 45.75 | +54 31 38.0 | 2.25 | -12.630.05 | -12.850.02 | -11.310.02 | -12.810.02 | ||
| 6 | 11 35 46.78 | +54 31 07.7 | 1.23 | -9.210.19 | -9.350.05 | -8.460.05 | -9.490.12 | ||
| 7 | 11 35 46.51 | +54 31 36.9 | 1.17 | -12.680.02 | -12.460.02 | -11.140.02 | -11.620.03 | ||
| 9 | 11 35 46.27 | +54 31 52.0 | 1.19 | -10.800.06 | -10.970.03 | -9.820.03 | -10.640.06 | ||
| 10 | 11 35 46.92 | +54 31 41.6 | 1.31 | -12.590.03 | -12.560.02 | -11.150.02 | -11.560.04 | ||
Note. — values of zero indicate that removing additional reddeing only move the cluster further from the Starburst99 model tracks.
| Filter | Number of Clusters | |
|---|---|---|
| Irregulars | Spirals | |
| Initial sample | 4,447 | 1,738 |
| Poor photometry | 3,337 | 664 |
| Rejection by color3 | 23 | 25 |
| Old ( Myr) | 486 | 329 |
| Low mass () | 279 | 361 |
| High mass () | 1 | 1 |
| Final sample | 321 | 358 |
Note. — Poor Photometry refers to objects rejected due to photometric errors % or having an aperture times the median stellar aperature. Rejection by color3 refers to objects rejected by the color3 routine either by emission line contaimination or lying more than 3 and 0.50 mag from the Starburst99 models.
| Galaxy | Distance | Cluster Recovery Rate | |||||
|---|---|---|---|---|---|---|---|
| (Mpc) | |||||||
| Irregulars | |||||||
| NGC 3738 | 6.19 | 0.74 | 0.86 | 0.93 | 0.93 | 0.96 | 0.97 |
| 0.97 | 0.96 | 0.97 | 0.97 | 0.96 | |||
| NGC 4190 | 5.53 | 0.97 | 0.97 | 0.99 | 1.00 | 0.99 | 1.00 |
| 0.98 | 0.98 | 0.99 | 0.99 | 1.00 | |||
| NGC 4214 | 2.98 | 0.97 | 0.97 | 0.98 | 0.98 | 0.97 | 0.98 |
| 0.98 | 0.97 | 0.97 | 0.97 | 0.92 | |||
| NGC 4449 | 5.63 | 0.85 | 0.89 | 0.92 | 0.94 | 0.96 | 0.96 |
| 0.98 | 0.99 | 0.97 | 0.98 | 0.98 | |||
| NGC 4485 | 9.20 | 0.69 | 0.87 | 0.93 | 0.94 | 0.94 | 0.95 |
| 0.96 | 0.96 | 0.96 | 0.96 | 0.95 | |||
| NGC 4656 | 8.61 | 0.83 | 0.92 | 0.94 | 0.96 | 0.95 | 0.96 |
| 0.97 | 0.97 | 0.97 | 0.98 | 0.97 | |||
| UGC 6541 | 3.32 | 0.97 | 0.95 | 0.99 | 0.99 | 0.96 | 0.99 |
| 0.92 | 0.91 | 0.94 | 0.97 | 0.96 | |||
| DDO 168 | 5.68 | 1.00 | 0.99 | 1.00 | 0.99 | 1.00 | 1.00 |
| 0.99 | 1.00 | 0.99 | 0.99 | 0.99 | |||
| Average | - | 0.79 | 0.90 | 0.94 | 0.95 | 0.96 | 0.96 |
| 0.97 | 0.97 | 0.97 | 0.97 | 0.96 | |||
| Spirals | |||||||
| NGC 4571 | 5.80 | 0.99 | 1.00 | 1.00 | 1.00 | 1.00 | 1.00 |
| 1.00 | 1.00 | 1.00 | 1.00 | 1.00 | |||
| NGC 4713 | 9.54 | 0.67 | 0.87 | 0.97 | 0.98 | 0.99 | 1.00 |
| 0.99 | 0.99 | 1.00 | 1.00 | 1.00 | |||
| NGC 5457 | 6.71 | 0.97 | 0.97 | 0.98 | 0.98 | 0.98 | 0.98 |
| 0.98 | 0.98 | 0.98 | 0.98 | 0.98 | |||
| Average | - | 0.92 | 0.96 | 0.98 | 0.98 | 0.99 | 0.99 |
| 0.99 | 0.98 | 0.99 | 0.99 | 0.99 | |||
Note. — The average for the corrections is weighted by the number of young ( Myr) clusters in each galaxy.