Chandra and Far Ultraviolet Spectroscopic Explorer Observations of Warm–Hot Gas Toward PKS 2155–304
Abstract
The X-ray bright quasar PKS 2155–304 is frequently observed as a Chandra calibration source, with a total of 483 ksec of Low Energy Transmission Grating (LETG) exposure time accumulated through May 2006. Highly–ionized metal absorption lines, including numerous lines at and a putative O viii K line at , have been reported in past Chandra studies of this source. Using all available Chandra LETG spectra and analysis techniques developed for such X-ray absorption along other sightlines, we revisit these previous detections. We detect 4 absorption lines at significance (O vii K, O viii K, and Ne ix K), with O vii K being a detection. The ranges of O vii column density and Doppler parameter are consistent with those derived for Mrk 421 and within of the Mrk 279 absorption. Temperatures and densities inferred from the relative O vii and other ionic column densities are found to be consistent with either the local warm–hot intergalactic medium or a Galactic corona. Unlike the local X-ray absorbers seen in other sightlines, a link with the low– or high–velocity far–ultraviolet O vi absorption lines cannot be ruled out. The O viii absorption reported by Fang et al. is seen with confidence in the ACIS/LETG spectrum, but no other absorption lines are found at the same redshift.
Subject headings:
intergalactic medium – X-rays: galaxies: clusters – cosmology: observations1. Introduction
At all known epochs, the baryonic mass density of the intergalactic medium (IGM) is thought to outweigh the baryons found in denser collapsed objects– stars, galaxies, and clusters. Indeed, at high redshifts () the “forest” of Ly absorption lines seen in spectra of distant quasars reveals a vast network of cool, photoionized hydrogen that is consistent with the expected baryon density at those redshifts (Weinberg, 1997). More recently, however, the process of structure formation has shock–heated this intergalactic gas to produce the warm–hot IGM (WHIM; Cen & Ostriker, 1999; Davé et al., 2001). At such high temperatures ( K) and low densities ( cm-3; ), the combination of collisional– and photo–ionization renders most of the gas too highly ionized to be detected through its Ly absorption (though some broad Ly systems likely tracing the low- WHIM have been reported, e.g. Sembach et al., 2004; Richter et al., 2004).
As the strong Ly transition is largely suppressed, most of the WHIM has proved extremely difficult to detect, resulting in a serious discrepancy between the observed low- baryon census and predictions (e.g., WMAP; Bennett et al., 2003). However, at these temperatures and densities heavier elements are not fully ionized, leading to an analogous “forest” of inner–shell X-ray metal absorption lines (Shapiro & Bahcall, 1980; Hellsten et al., 1998; Perna & Loeb, 1998). Even the most common heavy elements such as oxygen and neon are orders of magnitude less abundant than hydrogen, and only with the advent of Chandra’s high–resolution X-ray spectroscopic capabilities have such WHIM lines been directly observable toward bright, low–redshift AGN (Fang et al., 2002; Nicastro et al., 2005a, b, Nicastro et al. 2007, in preparation). Though the statistical errors are large with so few detections, the intervening X-ray absorption lines seen by Chandra are consistent with the expected low- baryon density.
In addition to these intervening absorption lines, similar metal lines at velocities consistent with zero are seen in several high–quality Chandra spectra (Nicastro et al., 2002, 2003; Williams et al., 2005, 2006a). Since very little information about the physical distribution of this absorbing medium is available, it is unknown whether it originates in the Galaxy (e.g., as part of a hot, low–density corona) or farther away in the local WHIM filament or local intra–group medium. While there is some evidence for such a Galactic corona (e.g. Sembach, 2003; Collins et al., 2005; Wang et al., 2005), detailed curve–of–growth and ionization balance analyses of the X-ray absorption lines have found that they are also consistent with the temperatures and densities expected in the WHIM (Williams et al., 2005, 2006a).
The ubiquitous O vi high–velocity clouds (HVCs) observed by FUSE (Wakker et al., 2003) present a similar puzzle. These clouds are typically seen as absorption lines with velocities inconsistent with Galactic rotation ( km s-1) and, lacking distance information, it is unclear whether they are part of the extended Galactic baryon distribution or local intergalactic medium. Some are almost certainly associated with nearby H i HVCs at similar velocities, such as Complex C and the Magellanic Stream, but others appear completely isolated (Sembach et al., 2003). These isolated O vi HVCs have an average velocity vector that is large in the local standard of rest but minimized by transforming to the Local Group rest frame (Nicastro et al., 2003), indicating that they may indeed be extragalactic.
The nature of the local X-ray absorption and O vi HVCs (and the association between the two) is thus an important consideration for the fields of galaxy formation and cosmology. In the Mrk 421 and Mrk 279 sightlines analyzed by Williams et al. (2005) and Williams et al. (2006a) respectively, the X-ray absorption was found to be unassociated with any single component of the O vi absorption systems seen with FUSE along the same sightlines. However, these systems appeared quite different from each other; for example, the inferred velocity dispersion of the O vii absorption was relatively low toward Mrk 421 ( km s-1) and high toward Mrk 279 ( km s-1). Mrk 279 also exhibited a far stronger O vi HVC than Mrk 421, possibly related to the nearby presence of an H i HVC (Complex C) at the same velocity. With only two sightlines analyzed to this level of detail thus far, comparable data in other directions are crucial to assemble the overall picture of local warm–hot absorption.
Here we present a detailed analysis of the Chandra Low–Energy Transmission Grating observations of PKS 2155–304, a bright BL Lac object at . Subsets of these data have been previously presented by Fang et al. (2002), who reported the detection of a O viii absorption line from the WHIM, and Nicastro et al. (2002), who focused on the properties of the absorption. Much more calibration data have been made publicly available in the years since, and when combined represent the second highest–quality Chandra grating spectrum of an extragalactic source in terms of counts per resolution element, and the last sightline currently in the Chandra archive for which potentially extragalactic, X-ray absorption lines are likely to be detected (excluding 3C 273, which lies in the direction of a supernova remnant). Since the physical properties of the absorption toward Mrk 421 and Mrk 279 differed substantially in some ways (velocity dispersion and offset from the O vi HVCs), a third sightline provides valuable insight into the global properties of this absorption.

2. Data Reduction and Measurements
2.1. Chandra
PKS 2155–304 has been observed numerous times for calibration and science purposes with all possible combinations of the Chandra gratings and detectors. As the strongest absorption lines previously observed have been lines from C, N, and O at Å, for the purposes of this study we only include data from the Low Energy Transmission Grating (LETG) since it has the highest effective area in this wavelength regime. Chandra’s two X-ray cameras, the High Resolution Camera (HRC) and Advanced CCD Imaging Camera (ACIS), each include separate detector arrays for imaging (I) and grating spectroscopy (S). Although LETG observations taken with HRC–I and ACIS–I are available in the archive, their calibration is less certain and wavelength range more restricted than those of the spectroscopic arrays, and so they are excluded from this analysis.
The remaining datasets include 8 employing the HRC–S/LETG instruments and 24 with ACIS–S/LETG. Of these latter observations, however, 15 have large pointing offsets (typically ), presumably intended to characterize the off–axis line spread function and effective area. Since the spectral resolution degrades significantly at these large offsets, only the nine ACIS–S observations with are considered here. The resulting 17 observations, listed in Table 1, contain a total of 483 ks of exposure time and counts per 0.05 Å resolution element (CPRE) at 21.5 Å (253.7 ks and 880 CPRE in ACIS–S; 229.3 ks and 1200 CPRE in HRC–S). In theory this should provide better than half the signal–to–noise ratio obtained in the LETG spectrum of Mrk 421 taken during two outburst phases (6000 CPRE; Nicastro et al., 2005a; Williams et al., 2005).
All datasets were fully reprocessed using the Chandra Interactive Analysis of Observations (CIAO) software, version 3.3, with the corresponding Calibration Database (CALDB) version 3.2.1111See http://cxc.harvard.edu/ciao/ and http://cxc.harvard.edu/caldb/. This CALDB version includes models for the ACIS–S time–dependent quantum efficiency degradation as well as preliminary corrections to nonlinearities in the HRC–S/LETG wavelength scale. First–order spectra were then extracted, and response matrices built, using the standard CIAO routines. LETG spectral orders cannot be separated with HRC–S due to this detector’s intrinsic lack of energy resolution, so the resulting spectrum is an overlapping superposition of all orders. We thus built all HRC–S/LETG response matrices for orders to ; past experience (e.g., Williams et al., 2006a) has shown that this is sufficient to accurately model higher–order contamination.
| Obs ID | Date | (21Å)aaBackground–subtracted photon flux at 21Å; the HRC–S values are apparent fluxes including all higher orders. | bbWeight factors for coadding the response matrices, calculated as . | |
|---|---|---|---|---|
| (ks) | (ks-1 cm-2 Å-1) | |||
| ACIS–S/LETG | ||||
| 1703 | 2000 May 31 | 25.2 | 3.4 | 0.121 |
| 2335 | 2000 Dec 06 | 29.1 | 2.4 | 0.090 |
| 3168 | 2001 Nov 30 | 28.8 | 6.7 | 0.223 |
| 3668 | 2002 Jun 11 | 13.5 | 6.9 | 0.120 |
| 3707 | 2002 Nov 30 | 26.9 | 1.6 | 0.054 |
| 4416 | 2003 Dec 16 | 46.5 | 3.2 | 0.174 |
| 6090 | 2005 May 25 | 27.5 | 3.2 | 0.106 |
| 6091 | 2005 Sep 19 | 29.2 | 2.6 | 0.087 |
| 6927 | 2006 Apr 02 | 27.0 | 0.8 | 0.025 |
| HRC–S/LETG | ||||
| 331 | 1999 Dec 25 | 62.7 | 9.7 | 0.514 |
| 1013 | 2001 Apr 06 | 26.6 | 2.9 | 0.065 |
| 1704 | 2000 May 31 | 25.8 | 3.7 | 0.081 |
| 3166 | 2001 Nov 30 | 29.8 | 8.4 | 0.212 |
| 3709 | 2002 Nov 30 | 13.7 | 2.3 | 0.026 |
| 4406 | 2002 Nov 30 | 13.9 | 2.4 | 0.028 |
| 5172 | 2004 Nov 22 | 26.9 | 1.8 | 0.041 |
| 6923 | 2006 May 01 | 29.9 | 1.3 | 0.032 |
The individual spectra from each instrument were then coadded, both to allow searches by eye for weak absorption lines and to make it easier to assess the goodness of fits. First, the positive and negative spectral orders from each observation (and their corresponding response matrices) were coadded. As PKS 2155–304 is highly variable in the X-ray band, we performed quick fits to determine the flux near 21 Å at the time of each observation. The response matrices were then weighted by a factor of and coadded; these fluxes and weights are also listed in Table 1 and show a factor 12 variation at 21Å from 1999 to 2006. Note that, as a result of the dithering strategy employed during observations, Chandra/LETG lacks the narrow chip–gaps and other detector features seen in XMM–Newton grating spectra (Williams et al., 2006b); weighting the response matrices before coaddition substantially reduces broad residuals across the LETG band, but is not essential for narrow absorption line measurements.
The resulting spectra were fit using the CIAO Sherpa utility. Simple powerlaw continua (with foreground Galactic absorption as a free parameter) were fit independently for the ACIS and HRC spectra over the 10–47 Å wavelength range. To improve the consistency of the fit near elemental edges, the foreground absorber abundances of carbon, nitrogen, oxygen, and neon were allowed to vary. The resulting best–fit powerlaw slopes are similar ( and for ACIS and HRC respectively, where ), but the Galactic absorption and abundances vary somewhat between the two instruments, perhaps due to calibration uncertainties or a degeneracy between and over this restricted wavelength range. The continuum fits for ACIS and HRC are shown in Figure 1.


Several absorption lines, including the O vii, O viii, and Ne ix K transitions at , are immediately visible. These lines were modeled with narrow (FWHM mÅ) Gaussian features added to the fitted continua. Since there appear to be lingering systematic uncertainties in the HRC–S/LETG wavelength scale even with the new correction routines (Nicastro et al., 2007), the wavelengths and strengths of absorption features (as well as the continuum normalizations) were first allowed to vary independently for the spectrum produced by each instrument. Each line’s equivalent width was then determined using a joint fit to the ACIS and HRC spectra with the requirement that the equivalent width match between the two instruments, i.e. the normalized Gaussian line amplitudes and (where corresponds to the integral of the Gaussian, not the height) were fixed according to:
| (1) |
Wavelength and equivalent width errors were determined for this joint fit using the “projection” command in Sherpa, allowing the HRC and ACIS continuum normalizations to vary. These quantities for all measured lines (as well as upper limits on Ne ix and O vii K) are reported in Table 2, and Figures 2 and 3 show the best–fit models for all detected lines in ACIS and HRC respectively. To check the consistency between the two detectors, absorption lines were also fit independently in both spectra. The resulting wavelengths and equivalent widths agree to within , with the exception of Ne ix which exhibited a (3.5 mÅ) larger equivalent width in ACIS than in HRC. This could plausibly be due to statistical fluctuations, however, so we conclude that the two detectors produce consistent results.
| ID | aaRest wavelengths taken from Verner et al. (1996), except O vi K which is from the laboratory measurements of Schmidt et al. (2004). | bbIn the cases where upper limits were found, the line positions were allowed to vary within 20 mÅ of the rest wavelengths, approximately the RMS dispersion of the measured line wavelengths. Measured wavelengths are taken from ACIS–S since its dispersion relation is thought to have the fewest nonlinearities; however, only the statistical fit error is given in this column (i.e., not taking into account systematic wavelength scale uncertainties of up to mÅ). | ccError bars are ; upper limits are . | c,dc,dfootnotemark: | Significance | Note | ||
|---|---|---|---|---|---|---|---|---|
| (Å) | (Å) | ( km s-1) | ( km s-1) | (mÅ) | ||||
| X-ray (Chandra): | ||||||||
| C V K | 40.268 | 2.2 | 1 | |||||
| C VI K | 33.736 | 2.2 | ||||||
| O VII K | 21.602 | 7.3 | ||||||
| O VII K | 18.629 | 3.2 | ||||||
| O VIII K | 18.969 | 4.8 | ||||||
| Ne IX K | 13.447 | 4.1 | ||||||
| N VI K | 28.787 | 28.787 | ||||||
| N VII K | 24.781 | 24.781 | ||||||
| O VI K | 22.019 | 22.019 | ||||||
| O VII K | 17.768 | 17.768 | ||||||
| UV (FUSE): | ||||||||
| O vi1 | 1031.926 | 31.7 | ||||||
| O vi2 | 1031.926 | 22.3 | ||||||
| O viHVC1 | 1031.926 | 18.3 | ||||||
| O viHVC2 | 1031.926 | 10.4 |
Note. — (1) An upper error bar could not be formally determined for the wavelength of this line.
It should be emphasized that the observed wavelength errors reported in Table 2 are purely based on the fit to the data and do not include systematic uncertainties in the wavelength scale. At a minimum, the nominal LETG wavelength error of mÅ should be assumed222See http://cxc.harvard.edu/cal/. A more conservative estimate can be derived directly from the best–fit positions of the six measured lines. Assuming all of these ions are at roughly the same velocity, the measured wavelengths exhibit an RMS dispersion of mÅ, similar to that seen in the Mrk 421 HRC spectrum (Nicastro et al., 2007). Thus, the true systematic uncertainty in the measured line positions (on top of the fitted statistical errors) is on the order of mÅ, consistent with that found by the LETG calibration team2.
2.2. FUSE
The reduction and analysis of the PKS 2155–304 FUSE data were performed in a manner nearly identical to that described for the Mrk 421 (Williams et al., 2005) and Mrk 279 (Williams et al., 2006a) sightlines; a brief summary follows. Three observations of PKS 2155–304 totaling 120 ks were available in the FUSE section of the Multimission Archive at STScI website.333http://archive.stsci.edu/ The calibrated data were downloaded and individual exposures cross-correlated over the 1030–1040 Å range, where many strong absorption lines are present, to compensate for small (typically mÅ) variations in the wavelength scale. The cross–correlated spectra for each observation were then coadded, and the resulting spectra in turn cross–correlated and coadded to produce a final coadded FUSE spectrum. The absolute wavelength scale was checked by comparing the positions of the strong, narrow Si II and Ar I absorption lines to the H I 21 cm emission. Wakker et al. (2003) find that essentially all of the H I is concentrated in a single Gaussian component at km s-1, which matches quite well the measured Ar I and Si II velocities ( and km s-1 respectively, with about 0.6 km s-1statistical error). Since there may be small ( few km s-1) systematic errors arising in the H I measurement and/or the physical relation between H I and the two FUSE–measured species, we will thus assume the FUSE wavelength calibration is correct for the purposes of this work.

The FUSE spectrum shows strong O vi absorption at as well as two distinct high–negative velocity O vi components (hereafter referred to as O viHVC1 and O viHVC2 in order of increasing absolute velocity). The 1029–1034 Å region of the spectrum was fit with a constant continuum plus a single Gaussian for each of the three O vi components. However, this provided a poor fit for the strong low–velocity O vi component so another Gaussian was added at to improve the fit. Figure 4 shows the resulting data and best–fit model, and the parameters of the four Gaussian components are listed in Table 2. Although Wakker et al. (2003) used a different method to measure the equivalent widths of each O vi component, our measured equivalent widths agree with theirs for both the low– and high–velocity O vi components.
The velocity of the O viHVC2 component is inconsistent with the O vii K velocity at the level assuming the statistical error on the line measurement, or if the nominal systematic wavelength uncertainty of 10 mÅ is adopted, indicating that the O vii and O viHVC2 components may be kinematically distinct. However, since wavelength scale errors in Chandra HRC–S/LETG are still not well–determined, this should not be considered a firm result.
The other O vi doublet line at 1037.6 Å is also visible in the spectrum, and in principle can be useful for curve–of–growth diagnostics when the O vi line is saturated. With the high resolution of FUSE (), however, the 1032 Å line’s shape and strength has in the past been sufficient for these measurements. Furthermore, the 1037 Å line components (particularly the HVCs) are heavily blended with nearby Galactic interstellar medium lines such as C II∗. Since this blending can introduce additional systematic error and even slight O vi saturation appears to be rare (e.g. Wakker et al., 2003), we will disregard the 1037 Å O vi line in this analysis.
3. Analysis
3.1. Doppler Parameters and Column Densities
The low resolution of the Chandra gratings compared to UV and optical spectrographs presents unique challenges for column density measurements, since essentially all non–quasar absorption lines are far narrower than the 50 mÅ ( km s-1 at 20 Å) LETG line–spread function. The lack of line width information prevents direct measurement of the profile shape, and hence the degree of saturation for any given line cannot be directly determined. If multiple absorption lines from the same ionic species are detected, however, the relative equivalent widths of these lines can instead be used to place limits on the column density () and velocity dispersion (or Doppler parameter, ) of the medium.
In the case of PKS 2155–304, the O vii K and K lines are strongly detected, and an upper limit is measured for the K line. If all these lines were unsaturated, the equivalent widths would scale as where is the absorption oscillator strength. Saturation effectively decreases the equivalent widths of strong (high–) lines while leaving weaker lines in the series more or less unaffected; thus, the ratio (K)/(K) increases with respect to the simple (unsaturated) proportionality above. For O vii, the expected K/K equivalent width ratio is , while we measure a ratio of , indicating that the O vii K may be slightly saturated (though it is also consistent with no saturation at the level).
To place more quantitative constraints on and , we employ the technique used in Williams et al. (2006a) for Mrk 279. For a grid of points in the plane, equivalent widths and apparent line FWHM values were calculated numerically (using Voigt absorption line profiles) for the O vii K, K, and K transitions. These lines were then added to the continuum model in Sherpa, and calculated with the “goodness” command, for every value of and . Figure 5 shows the contours of , , and confidence calculated in this manner.


As this figure shows, the minimum is found at km s-1 and , with the confidence region stretching between km s-1 and . Additionally, another region can be found at km s-1 with a higher column density () required to produce consistency with the spectrum. Such high O vii column densities are unlikely to be produced in a cold ( K), weakly photoionized medium without producing large amounts of narrow O vi absorption, so a low– solution appears unlikely. However, it is important to note that no value of can be ruled out at the confidence level from this curve–of–growth analysis alone; as mentioned above, the absorption is consistent with a completely unsaturated medium at this level, and lower–, higher– solutions are also possible in the regions demarcated by the and contours in Figure 5. Column densities for all X-ray lines (listed in Table 2) are calculated by assuming the –minimizing value above. While most of the lines are too weak for this choice to make a significant difference in the determination, it should be kept in mind that the systematic uncertainty in may be larger than the statistical errorbars.

Determination of these parameters for the UV O vi absorption is decidedly more straightforward since the lines are fully resolved by FUSE. Since saturation can make absorption lines broader than would be expected just from the Doppler parameter of the gas, the measured line width cannot be used directly as a surrogate for . Instead, we calculate apparent O vi FWHM values and equivalent widths over a grid of and , and find the regions within this grid that are consistent with the measured and values.
Figure 6 shows these tracks for the low–velocity O vi components. Contours of constant are roughly vertical while constant are horizontal in the unsaturated regime. In this case both O vi1 and O vi2 appear to be at most weakly saturated, so the and contours overlap nearly orthogonally, producing tight constraints on both parameters for both components. We find that km s-1 and km s-1 for O vi1 and O vi2 respectively, with column densities of and . Since these low–velocity lines are essentially unsaturated, and the HVCs are weaker still (but with comparable apparent line widths), we can safely assume they fall well within the linear part of the curve–of–growth. Values of and (for O viHVC1) and and (for O viHVC2) are thus inferred directly from the line measurements. All four O vi components have Doppler parameters that are fully consistent with the O vii limits.
3.2. Temperature and Density Diagnostics
With estimates for ionic column densities, constraints on the temperature and density of the absorbing medium can be derived. Although collisional ionization is expected to be the dominant physical process in either the extended local WHIM or a hot Galactic corona, photoionization from the extragalactic UV/X-ray background is expected to significantly alter the ionization balance of the low–density WHIM (cf. Nicastro et al., 2002; Mathur et al., 2003). To find the most general set of conditions which can produce the observed highly–ionized ion ratios, both collisional and photo–ionization must be considered.
For this sightline we follow the same analysis we employed for Mrk 279 in Williams et al. (2006a). Assuming a fixed metagalactic ionizing background model from Sternberg et al. (2002), the ionization parameter simply depends on the inverse of the electron density. The ionization balance code Cloudy (version 05.04; Ferland et al., 1998) was employed to calculate relative abundances of all measured ions over a range of K and cm-3 (or ) with grid spacings of 0.1 dex in each quantity, encompassing the range of temperatures and densities expected in WHIM and Galactic corona models.
With a grid of computed as a function of temperature and density, the problem can be inverted to determine which sets of and are consistent with the measured ionic column densities. However, since the local X-ray absorption is produced in gas too hot to be detectable in neutral hydrogen emission (and Ly absorption at is invariably obliterated by the local interstellar medium damping wing), no information on the overall metallicity can be derived from the data. Thus, it is more useful to find the regions defined by column density ratios. Since O vii is by far the best–measured ion that unambiguously arises in local warm–hot gas, we calculate all other ion column density ratios relative to .
Column density ratios of different ions of the same element are independent of metallicity, and so depend only on the physical state of the medium. Thus, if the O viii and O vii absorption arise in the same gas phase, the ratio provides the most rigorous constraints on the temperature and density of the warm–hot gas. Likewise, if any one of the four measured O vi components exists in this same phase, the ratio should be consistent with an overlapping set of temperatures and densities. Figure 7 shows the constraints derived from and for each of the O vi components. Note that at high densities ( cm-3) the temperature constraints are essentially constant, but at lower densities photoionization becomes significant and a lower temperature is necessary to produce the same column density ratios.
The and values derived from the measured are consistent with the constraints for all four components, with a typical minimum density of cm-3. However, the consistency for the strongest low–velocity O vi component (O vi1) is only marginal ( level). Since O vi1 and O vi2 are almost certainly associated with the Galactic thick disk, the density of these media must be high enough that only collisional processes affect the ionization balance. The collisional–equilibrium temperature inferred from the O viii/O vii ratio cannot be reconciled with large amounts of O vi in the same phase (), so the sum of all O vi components associated with the O viii/O vii absorber must have a total column density lower than this value. Thus, association of the X-ray oxygen absorption lines with any one of the UV O vi components cannot be ruled out for this sightline, but the X-ray absorption cannot be associated with multiple strong O vi components. If the medium is collisionally ionized, the ratio provides strong temperature constraints (assuming a Doppler parameter km s-1) of . If the density is low enough ( cm-3) that photoionization is important, then the temperature can be as low as K.
Similar constraints can be derived from other measured X-ray lines, though since (for example) the ratio depends on the relative [C/O] abundance, these constraints are more prone to systematics than those solely employing one atomic species. Moreover, since the O vii Doppler parameter cannot be pinned down accurately, can vary with different values thus significantly altering the measured column density ratios. For the low– solution ( km s-1), the measured requires temperatures of . On the other hand, such a low velocity dispersion implies a maximum temperature of so the low– solution does not appear to be physically possible. For these X-ray line diagnostics, we thus consider only the best–fit region of km s-1 and a large–velocity dispersion, low saturation ( km s-1) solution.
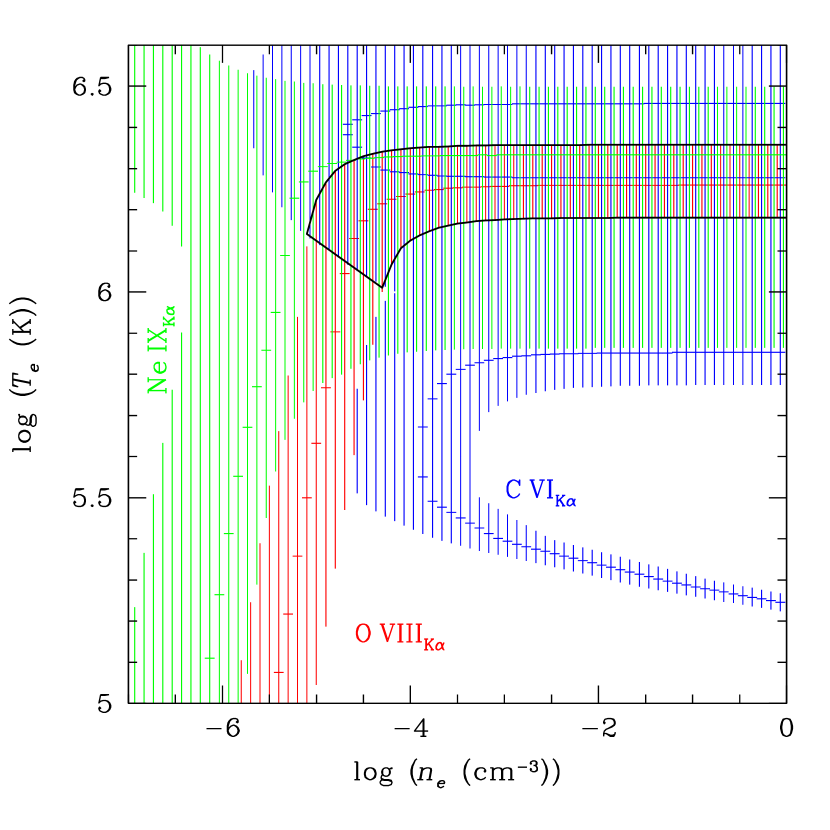
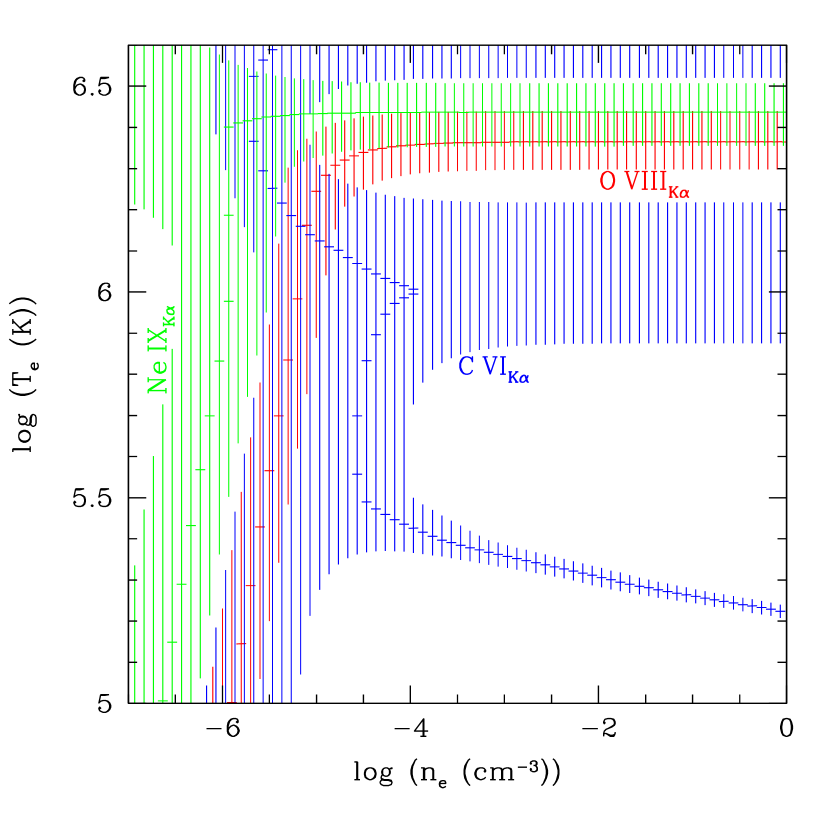
Figure 8 shows the constraints for and derived from the ratios of Ne ix, C vi, and O viii to O vii, assuming a solar abundance pattern for these elements. The column density limits measured for N vi and N vii did not provide any useful constraints (i.e., they were consistent with nearly the entire range of temperatures and densities) and were excluded from these figures for clarity. Similarly, the C v ion is expected to form in cooler gas than that producing the O vii and O viii absorption and may be contaminated by foreground ISM or thick-disk gas, so the contour (which provides no additional constraints) is also not shown.
In the best–fit plot (Figure 8, left panel), the constraints derived from all three column density ratios overlap quite well in the collisionally–ionized density regime ( cm-3). On the other hand, at a large velocity dispersion (; right panel of Figure 8) there is essentially no set of and for which the three constraints overlap. The C vi and Ne ix lines are relatively weak and not as affected by saturation as the O vii, so this change is driven primarily by the decrease in at higher velocity dispersion. Though the contours derived from and depend on [C/O] and [Ne/O], if the abundance mixture of this absorber is roughly Solar, then the measured column densities indicate that the previously derived Doppler parameter range ( km s-1) fit the data better than a high–, unsaturated medium.
Collins et al. (2004) perform a similar analysis on the UV/X-ray absorption toward this sightline, employing the Nicastro et al. (2002) X-ray measurements and assuming (as a maximal case) that both O vi HVCs are associated with the X-ray absorption. They find that the O vi column density seen in the HVCs is far larger than that expected from the O vii column density and high temperature () inferred from . However, as discussed below in §4.3, the improved constraints on imply larger O vii column densities (hence lower O vi/O vii) than found in Nicastro et al. (2002), so the large observed O vi HVC column densities now are consistent with the O vii and O viii. The scenario put forth by Collins et al. (2004) (O vi arising in a warm–hot collisionally–ionized medium, with lower ions coexisting in a cooler, photoionized phase) thus remains consistent with the data, but the O vii and O viii can now be included in the warm–hot phase as well.
3.3. Absorption at
In a previous study incorporating a subset of the data analyzed herein (ACIS–S/LETG observation IDs 1703, 2335, and 3168), Fang et al. (2002, hereafter F02) report the detection of an absorption line at km s-1 with equivalent width mÅ, possibly corresponding to O viii at a velocity of km s-1 (). Several previously discovered Ly absorption lines and a small cluster of H I galaxies appear at a similar velocity in this direction (Shull et al., 1998), so such an absorber may be indicative of intragroup medium or an associated large–scale WHIM filament.
This absorption line is clearly visible in our coadded ACIS spectrum, but is not visible in the HRC spectrum (Figure 9). A fit to the line in ACIS yields a wavelength of Å and an equivalent width mÅ ( assuming km s-1), both consistent with the F02 measurement (though the best–fit equivalent width from F02 is roughly twice that measured here). Note that this line falls near an ACIS–S chip node boundary, potentially introducing a systematic offset to the line strength, but such an offset is expected to be small compared to the measurement error. An upper limit for a line at this wavelength ( Å, to account for possible HRC/LETG wavelength scale discrepancies) in the HRC spectrum was calculated and found to be mÅ ( confidence), so the ACIS measurement is not ruled out by the HRC non–detection. A simultaneous fit to both the ACIS and HRC spectra produces almost exactly the same equivalent width and errors as the ACIS data alone, further demonstrating that the HRC spectrum is insensitive to this line. If real, this detection would still be fully consistent (albeit with large errors) with the predicted number of O viii absorbers per unit redshift (F02, Figure 2).
Even with the increased signal–to–noise provided by the additional observations, no other absorption lines are seen at this redshift, despite O vii absorption often being present at WHIM temperatures. From the upper limit of at this redshift and the measured O viii column density of (assuming km s-1), the inferred lower limit on the absorber temperature is in collisional ionization equilibrium. This is larger than the maximum temperatures inferred for local warm–hot gas (e.g., the Galactic corona or Local Group; see Williams et al., 2006a, and references therein), but it falls within the predicted temperature range for the WHIM. Furthermore, at densities below cm-3 photoionization enhances the O viii column density in the medium, and the corresponding temperature limit relaxes somewhat (e.g. for cm-3).

4. Discussion
4.1. Comparison to Other Lines of Sight
PKS 2155–304 represents the third Chandra data set we have analyzed for which relatively weak ( mÅ) local absorption, uncontaminated by known hot foreground gas (as in 3C 273, situated along the line of sight to a likely Galactic supernova remnant; Savage et al. 1993) can be detected at high confidence. Although the number of such sightlines is small, similarities and differences in the detected absorption are already beginning to emerge.
4.1.1 Mrk 421
The Chandra LETG spectrum of Mrk 421 contains is the highest–quality grating spectrum of an extragalactic source to date, with roughly three times the counts per resolution element at 21 Å as the PKS 2155–304 data analyzed here (Nicastro et al., 2005a; Williams et al., 2005). Many of the ionic species seen toward Mrk 421 (particularly O vii, O viii, Ne ix, and C vi) were also detected in the PKS 2155–304 spectrum, allowing direct comparisons to be made. In particular, the O vii absorption (the strongest–detected ion in both cases) shows strikingly similar properties between the two objects– in Mrk 421 versus in PKS 2155–304. Both O vii absorbers exhibit consistent velocity dispersions as well, with km s-1 ( limits) in Mrk 421 and km s-1 in PKS 2155–304 (though this latter quantity is the range, and limits could not be determined).
One of the most surprising features of the Mrk 421 Chandra spectrum is the presence of a weak (2.0 mÅ) absorption line at 22.02 Å, the expected wavelength of the O vi K inner–shell transition. Even though both this transition and the 1032 Å lines should both trace the O vi ground state, the column density derived from the observed K line is a factor of higher than that derived from the UV transition. If this K transition is a better tracer of the true O vi column density than the UV line, then the O vii toward Mrk 421 almost certainly arises in a low–density, photoionized medium.
Although the O vi absorption strength toward PKS 2155–304 is comparable to the Mrk 421 sightline, unfortunately this Chandra spectrum does not have sufficient signal–to–noise to detect the K line. Thus, for PKS 2155–304 we cannot determine if there is the same discrepancy between the UV and X-ray O vi, or if the inferred O vi K column density also implies a photoionized medium along this sightline. If the O vi K measurement is disregarded, then the Mrk 421 spectrum implies slightly lower–but marginally consistent–temperatures in the collisionally ionized regime (; limits from the O viii/O vii ratio) than PKS 2155–304 (). The lower density limit from Mrk 421 is somewhat more stringent than that derived from the PKS 2155–304 oxygen ion ratios ( versus ), though this may again be primarily an issue of spectral quality.
4.1.2 Mrk 279
The Seyfert galaxy Mrk 279 is significantly less luminous than either PKS 2155–304 or Mrk 421, but it was observed long enough with Chandra HRC–S/LETG to produce a reasonably high–quality spectrum in which strong O vii K absorption was detected (Williams et al., 2006a). Two features of this absorption were particularly interesting: (1) the unusually strong O vii K absorption ( mÅ), coupled with a tight upper limit on the K line, indicated that the absorption was best described as an unsaturated medium (with a lower limit of km s-1 on the Doppler parameter); and (2) the O vii absorption appears slightly redshifted, making its velocity inconsistent with the O vi HVC’s negative velocity at the level.
As previously mentioned, the velocity of the O vii toward PKS 2155–304 appears to be inconsistent with the O viHVC2 velocity at the level, assuming the nominal HRC–S/LETG wavelength scale uncertainty of 10 mÅ. Until systematic errors in the wavelength scale can be better understood, however, this should not be taken as a definitive result. Moreover, while the O vii toward Mrk 279 could not be directly associated with either low–velocity O vi component since their velocity dispersions were significantly different, such an association cannot be ruled out in the PKS 2155–304 absorption: all of the O vi Doppler parameters fall within the confidence interval found for the O vii absorption.
Temperature and density constraints on the absorption toward Mrk 279 and PKS 2155–304 are consistent with each other, though this is not surprising–since the quality of the Mrk 279 spectrum is lower, only an upper limit on temperature and a lower limit on density could be derived.
4.2. Where is the Absorption?
In principle, the degree of photoionization in an absorbing medium (and hence an estimate of the gas density) can be derived from ionic column density ratios (§3.2). However, in the case of PKS 2155–304, the errors are large enough that no upper limit on the gas density can be found, i.e. it is fully consistent with collisional ionization or a combination of collisional– and photo–ionization. Depending on the assumptions made (in particular, which if any of the O vi components are associated with the O vii and O viii), the minimum density of this medium appears to be . The best–fit O vii column density is and O vii is by far the dominant ionization state in this medium. If the gas has a metallicity of solar (comparable to that observed in the diffuse intracluster medium), then the total hydrogen density is roughly and the thickness of the absorber Mpc.
Thus, under a set of reasonable assumptions, the observed absorption is consistent with an extended extragalactic medium, but within the large uncertainties it is just as reasonable to associate it with a local hot Galactic corona. Although an association between the X-ray absorber and low–velocity O vi cannot be ruled out from these data alone, the properties of the X-ray absorber are quite similar (again within the errors) to those studied along the Mrk 421 and Mrk 279 sightlines. These latter two X-ray absorbers are definitely not associated with the low–velocity O vi absorption arising in the Galactic thick disk, so if they indicate the presence of an additional hot Galactic component, then the derived properties of the PKS 2155–304 absorber are not in conflict with the other measurements of this component.
4.3. Comparison to Nicastro et al. (2002)
In their study of three HRC–S/LETG observations of PKS 2155–304 (observation IDs 331, 1013, and 1704), Nicastro et al. (2002, hereafter N02) also detected O vii K and K, O viii, and Ne ix, albeit at lower confidence. They also analyze FUSE data of the same sightline, but at that time only 39 ks were available, or about one–third of the exposure time analyzed here. As it turns out, the addition of new Chandra and FUSE data brings about significant changes in the interpretation of the local absorption, in two important ways.
First, while N02 were able to fit the observed O vi line with two Gaussian components (one low–velocity narrow line and a broader, blueshifted HVC), the new higher–quality spectrum reveals that the “broad” component is actually two distinct HVCs, and the “narrow” low–velocity O vi is best fit with two components. Second, while the O vii K line was previously not detected strongly enough to place constraints on the Doppler parameter of the absorption, here the K and K lines hint at some degree of saturation and so the O vii column density we employ in our analysis is about 0.5 dex higher than that reported by N02. Both of these effects cause a sharp decrease in the ratio, which in turn removes the need for a photoionization contribution. Indeed, when we calculate temperature and density constraints assuming (as N02 had done; see Figure 8, right panel) we also find that a high–density, collisionally–ionized solution cannot be found without modifications to the relative abundances. This highlights the major improvements in diagnostic power that can be made by accumulating large numbers of counts per resolution element, either through very long exposures or observations of especially bright background sources.
5. Conclusions
Using all available Chandra LETG data on PKS 2155–304, we have analyzed in detail the ionization and kinematic state of the warm–hot absorbing medium. We find a Doppler parameter range of km s-1 ( limits; limits could not be found), which is consistent with the absorption seen toward both Mrk 421 and Mrk 279 (though the best–fit value best matches the former sightline). Assuming that the Doppler parameter lies in this range, ionic column densities of O vii, O viii, Ne ix, and C vi are consistent with collisional ionization at , though a low–density WHIM with a significant photoionization contribution cannot be ruled out. Unlike the other two previously analyzed sightlines, the O vii absorption toward PKS 2155–304 may be associated with either one of the low–velocity O vi components seen in FUSE or a high–velocity O vi cloud at km s-1 (though its velocity may be inconsistent at the level with another O vi HVC at km s-1, and it is only marginally consistent with the column density of the strongest low–velocity O vi component). The similarities and differences between different sightlines suggest that perhaps there is no single solution to the origin of the O vii absorbers. The relation between O vi HVCs and O vii also appears to be diverse, so the location of these systems remains an open question.
The intervening O viii absorber at reported by Fang et al. (2002) is detected in ACIS and is consistent with their measurement; although no other lines are detected at the same redshift, this O viii absorption is consistent with expectations for WHIM gas.
It is notable that the Chandra data for this line of sight hint at a number of interesting results (especially the low best–fit Doppler parameter in the absorption) but the data are not quite of sufficient quality to confidently confirm them. PKS 2155–304 is quite possibly the only other extragalactic source bright enough to obtain a Chandra LETG spectrum with counts per resolution element, comparable to the Mrk 421 spectrum analyzed by Williams et al. (2005), in a reasonable amount of time. Such a spectrum would not only allow a direct comparison of the absorption along two lines of sight, but would also provide a path length four times larger than Mrk 421 to search for “missing baryons” in intervening WHIM filaments. With two such systems detected in Mrk 421, a correspondingly larger number could be detected in a PKS 2155–304 spectrum at comparable signal–to–noise. While longer observations of PKS 2155 would have the potential for great scientific results, the large soft X-ray variability of this source (over a factor of ten, as seen in Table 1) could hamper the feasibility of such observations.
References
- Bennett et al. (2003) Bennett, C. L., et al. 2003, ApJS, 148, 1
- Cen & Ostriker (1999) Cen, R., & Ostriker, J. P. 1999, ApJ, 514, 1
- Collins et al. (2004) Collins, J. A., Shull, J. M., & Giroux, M. L. 2004, ApJ, 605, 216
- Collins et al. (2005) Collins, J. A., Shull, J. M., & Giroux, M. L. 2005, ApJ, 623, 196
- Davé et al. (2001) Davé, R., et al. 2001, ApJ, 552, 473
- Elvis, Wilkes, & Lockman (1989) Elvis, M., Wilkes, B. J., & Lockman, F. J. 1989, AJ, 97, 777
- Fang et al. (2002) Fang, T., Marshall, H. L., Lee, J. C., Davis, D. S., & Canizares, C. R. 2002, ApJ, 572, 127 (F02)
- Ferland et al. (1998) Ferland, G. J., Korista, K. T., Verner, D. A., Ferguson, J. W., Kingdon, J. B., & Verner, E. M. 1998, PASP, 110, 761
- Hellsten et al. (1998) Hellsten, U., Gnedin, N. Y., & Miralda–Escudé, J. 1998, ApJ, 509, 56
- Mathur et al. (2003) Mathur, S., Weinberg, D., & Chen, X. 2003, ApJ, 582, 82
- Nicastro et al. (2002) Nicastro, F., et al. 2002, ApJ, 573, 157
- Nicastro et al. (2003) Nicastro, F., et al. 2003, Nature, 421, 719
- Nicastro et al. (2005a) Nicastro, F., et al. 2005, ApJ, 629, 700
- Nicastro et al. (2005b) Nicastro, F., et al. 2005, Nature, 433, 495
- Nicastro et al. (2007) Nicastro, F., Williams, R. J., Mathur, S., Elvis, M., Drake, J., & Krongold, Y. 2007, ApJ, submitted
- Perna & Loeb (1998) Perna, R., & Loeb, A. 1998, ApJ, 503, 135
- Richter et al. (2004) Richter, P., Savage, B. D., Tripp, T. M., & Sembach, K. R. 2004, ApJS, 153, 165
- Savage et al. (1993) Savage, B. D., Lu, L., Weymann, R. J., Morris, S. L., & Gilliland, R. L. 1993, ApJ, 404, 124
- Schmidt et al. (2004) Schmidt, M., Beiersdorfer, P., Chen, H., Thorn, D. B., Träbert, E., & Behar, E. 2004, ApJ, 604, 562
- Sembach (2003) Sembach, K. R. 2003, preprint (astro-ph/0311089)
- Sembach et al. (2003) Sembach, K. R., et al. 2003, ApJS, 146, 165
- Sembach et al. (2004) Sembach, K. R., Tripp, T. M., Savage, B. D., & Richter, P. 2004, ApJS, 155, 351
- Shapiro & Bahcall (1980) Shapiro, P. & Bahcall, J. 1980, ApJ, 241, 1
- Shull et al. (1998) Shull, J. M., Penton, S. V., Stocke, J. T., Giroux, M. L., van Gorkom, J. H., Lee, Y. H., & Carilli, C. 1998, AJ, 116, 2094
- Sternberg et al. (2002) Sternberg, A., McKee, C. F., & Wolfire, M. G. 2002, ApJS, 143, 419
- Verner et al. (1996) Verner, D. A., Verner, E. M., & Ferland, G. J. 1996, Atomic Data Nucl. Data Tables, 64, 1
- Wakker et al. (2003) Wakker, B. P., et al. 2003, ApJS, 146, 1
- Wang et al. (2005) Wang, Q. D., et al. 2005, ApJ, 635, 386
- Weinberg (1997) Weinberg, D. H. 1997, ApJ, 490, 564
- Williams et al. (2005) Williams, R. J., et al. 2005, ApJ, 631, 856
- Williams et al. (2006a) Williams, R. J., Mathur, S., & Nicastro, F. 2006, ApJ, 645, 179
- Williams et al. (2006b) Williams, R. J., Mathur, S., Nicastro, F., & Elvis, M. 2006, ApJ, 642, L95