An asymmetry detected in the disk of CMa††thanks: Based on Guaranteed Time Observations made with the Very Large Telescope Interferometer at Paranal Observatory with the VLTI/AMBER
Abstract
Aims. We study the geometry and kinematics of the circumstellar environment of the Be star CMa in the Br emission line and its nearby continuum.
Methods. We use the VLTI/AMBER instrument operating in the K band which provides a spatial resolution of about 6 mas with a spectral resolution of 1500 to study the kinematics within the disk and to infer its rotation law. In order to obtain more kinematical constraints we also use an high spectral resolution Pa line profile obtain in December 2005 at the Observatorio do Pico do Dios, Brazil and we compile V/R line profile variations and spectral energy distribution data points from the literature.
Results. Using differential visibilities and differential phases across the Br line we detect an asymmetry in the disk. Moreover, we found that CMa seems difficult to fit within the classical scenario for Be stars, illustrated recently by Arae observations, i.e. a fast rotating B star close to its breakup velocity surrounded by a Keplerian circumstellar disk with an enhanced polar wind. Finally we discuss the possibility for CMa to be a critical rotator with a Keplerian rotating disk and try to see if the detected asymmetry can be interpreted within the ”one-armed” viscous disk framework.
Key Words.:
Techniques: high angular resolution – Techniques: interferometric – Stars: emission-line, Be – Stars: Keplerian rotation – Stars: individual ( CMa) – Stars: circumstellar matter1 Introduction
The ”Be phenomenon” is related to hot stars that have at least
exhibited once Balmer lines in emission with infrared excess produced
by free-free and free-bound processes in an extended circumstellar
disk. There is now a strong evidence that the disk around the
Be star Arae is Keplerian (Meilland et
al. 2006a, ) and that this dense
equatorial disk is slowly expanding. On the other side there are also
clear pieces of evidence for a polar enhanced wind. This was already predicted
for almost critically rotating stars as for a large fraction of Be
stars. Recently, Kervella & Domiciano de Souza kervella (2006)
showed an enhanced polar wind for the Be star Achernar whereas this Be
star presents no hydrogen lines in strong emission. Thus, it seems
that a significant polar wind may be present even if the star is still
in a normal B phase, signifying this enhanced polar wind would not be
related to the existence of a dense equatorial envelope. However many
issues remain unsolved on the actual structure of the circumstellar
envelopes in Be stars which probably depends on the dominant mass
ejection mechanisms from the central star and on the way the ejected
mass is redistributed in the near circumstellar environment. Recently
Meilland et al. 2006b reported theoretical spectral energy
distributions (SEDs), Br line profiles and visibilities for
two likely scenarii of the disk dissipation of active hot stars, and
account for the transition from the Be to the B spectroscopic
phase.
CMa (HD 50013, HR 2538) is one the brightest Be star of the
southern hemisphere (V=3.8, K=3.6). It is classified as a B2IVe star,
and the distance deduced from Hipparcos parallax is 230 30
pc. The measured vsini values range from 220 kms-1 (Dachs et
al. dachs0, 1989; Mennickent et al. mennickent, 2004;
Okazaki okazaki, 1997; Prinja prinja, 1989) to 243 kms-1 (Zorec
et al.zorec, 2005) , its radius is 6
R☉ (Dachs et al. dachs0, 1989; Prinja prinja, 1989)
and its mass is 10 M☉ (Prinja prinja, 1989).
We must mention that the mass and radius determination of a Be star is not
an easy task. For instance if we assume values of masses and radii from Harmanec harmanec1 (1988) compilation,
in agreement with Schaller et al. schaller (1992) non-rotating evolutionary models, for the effective temperatures used by Popper popper (1980), Prinja prinja (1989) and Fremat fremat (2005) we obtain the table 1.
| Teff | Mass | Normal Radius | Radius from |
|---|---|---|---|
| in K | in M⊙ | in R⊙ | parallax in R⊙ |
| 20000 | 6.60 | 3.71 | 7.25 (6.46 - 8.24) |
| 23100 | 8.62 | 4.28 | 6.26 (5.59 - 7.13) |
| 25800 | 10.72 | 4.83 | 5.59 (4.98 - 6.36) |
Thus, for a main sequence star the stellar radius should be smaller than the 6 R⊙ we have adopted but on the other side, our radius estimate based on the parallax and the chosen V magnitude from the correlation between the brightness and emission strength, as proposed by Harmanec harmanec0 (2000), gives the range of radii comparable to our chosen 6 R⊙ used in our modeling.
The star exhibits a huge IR-excess and a strong emission in the hydrogen lines making a good candidate for the VLTI/AMBER spectro-interferometer (Petrov et al. petrov (2006)) using medium spectral resolution (1500). Our aim is to study the geometry and kinematics of the circumstellar environment of this star as a function of wavelength, especially across the Br emission line and to detect any signature of a possible asymmetry of its circumstellar disk as already observed through a violet to red peaks ratio V/R 1.3 by Dachs et al. dachs (1992) and Slettebak et al. Slettebak (1992).
2 Observations and data reduction
Dedicated observations of CMa were carried out during the night of the December, 26th 2004 with the three VLTI 8m ESO telescopes UT2, UT3 and UT4 (See Table 3 for the baseline configurations). The data were reduced using the amdlib (v1.15)/ammyorick (v0.54) software package developed by the AMBER consortium. It uses a new data processing algorithm adapted to multiaxial recombination instruments called P2VM for Pixel To Visibility Matrix algorithm. The squared visibility estimator is computed from the basic observable coming from this algorithm that is the coherent flux (i.e. complex visibilities frame by frame multiplied by the flux) and the estimated fluxes from each telescope. The principles of the general AMBER data reduction are described in more details by Millour et al. millour1 (2004) and Tatulli et al. tatulli (2006).
The complex coherent flux allows also to compute differential phase, i.e. averaged instantaneous phase substracted from achromatic atmospheric OPD and a wavelength-averaged reference phase. This means that the differential phase is the difference between the phase of the source complex visibility and a mean OPD. This leads to an average differential phase equal to zero on the observed spectral window and the lost of the object’s phase slope over the wavelengths. This technique allows however to retrieve partial information of the object’s phase and is almost equal to the object’s interferometric phase if we have some spectral channels where we know the object’s phase is zero.
Moreover, it also allows to compute “differential” visibility (as defined in Millour et al. millour, 2006 and in Meilland et al. 2006a, ), i.e. the instantaneous modulus of the complex visibility divided by the averaged visibility on all the wavelengths excepted the work one. This leads to an average differential visibility equal to 1 in the continuum. It has the advantage over the “classical” visibility estimator to be almost insensitive to rapid frame to frame variations of visibility (due to vibrations or atmospheric jittering for example) and therefore one can expect the differential visibility observable to be more precise than the classical visibility estimator given the current vibrations in the VLTI infrastructure, and even though the continuum visibility information is lost in this observable.
For more information, the differential data reduction is described in details in Millour et al. millour0 (2005) and Millour et al. millour (2006).
Reducing the CMa data with a good accuracy was quite difficult to achieve. We encountered specific problems related to this data set. Therefore, in addition to the tools furnished by the default package, some specific processing was added to reach the best precision on the interferometric observables.
| Star | Diameter (mas) | Error (mas) |
|---|---|---|
| HD 75063 | 0.50 | 0.08 |
| HD 93030 | 0.454 | 0.006 |
-
•
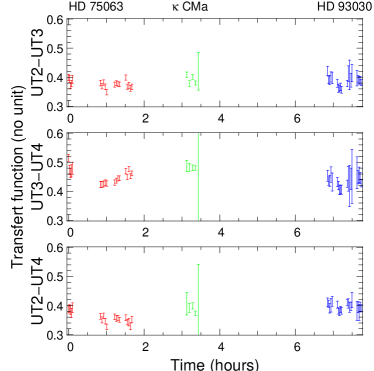
First of all, no specific data were available to calibrate the fringe contrast of CMa. We therefore looked at calibration stars observed during the same night for other stars and corrected their visibilities averaged over all the [2.13-2.21] m observed spectral range from their estimated diameters (see table 2) in order to monitor the instrumental+atmospheric transfert function (see Fig. 1). This transfert function is the visibility of a point source measured by the instrument, allowing us to correct the raw visibilities on the science star from the instrumental-specific visibility loss. The scattering over the time of the visibilities gives the dispersion due to the instrumental drifts and atmospheric fluctuations during the observing time. This leads to a visibilities dispersion estimate of 0.05 for each star, which leads to an error on calibrated visibilities of 0.07 ().
Then we interpolate the estimated transfert function to the time of the science star observations (as in Perrin et al. perrin, 2003). By using this technique, we find that the [2.13-2.21] m averaged visibility of CMa is really close to 1.0 with an uncertainty of 0.07 on all the observed base lengths. This would normally be killing for the wavelength-dependence study of the visibilities, but as explained before, we expect to have differential visibility and differential phase estimators much more precise than the visibility estimator. -
•
The lack of dedicated calibration star for CMa should have lead to an unfeasibility to spectrally calibrate the differential observables, but fortunately an other calibration star (HD93030) was observed two hours later within almost the same spectral window, which means that the spectrograph grating did not move but that the detector window was not exactly the same as for CMa, allowing us to use the intersecting spectral channels between the two observations without any calibration problem. Detailed data analysis of calibration stars tends to demonstrate that the main pattern on differential observables comes from a fiber-injection pattern (i.e. a pure internal AMBER instrumental effect) and that it is stable over several minutes in the 10-2 range for the differential visibilities and 10-2 radians for the differential phase at medium spectral resolution (R 1500, see for instance Vannier et al., vannier, 2005).
This allowed us to calibrate correctly the differential visibility and the differential phases (See Fig. 2). In order to ensure our calibration, we checked that all the features mentioned in this article are already present in the uncalibrated data, and not added by pure noise-effects produced by the calibrator star.
We could expect to see an effect in the closure phase, but its modulation seems to be of the order of amplitude of the error bars ( 3 °or 0.05 radians), which means that we do not see any detectable signal in the closure phase. This non-detection confirms the result on the visibility and the low amplitude of the modulation on the differential phases: the object is almost non-resolved or barely resolved by the interferometer on the considered baselines (80m maximum).
What we see in the observed data is a decrease in the differential visibilities in two of the three baselines of the order of 0.07, much larger than the error bars (0.02 for the differential visibilities). This can be explained by an envelope larger than the star, visible in the emission line.
We observe also a modulation in the differential phase of the order of 5°(0.09 radians), also higher than the error bars ( 2°or 0.03 radians). The modulation of the differential phase show a “sine arch” shape, typical of a rotating object or a bipolar outflow but also show an asymmetry, mainly on the baseline UT2-UT3 (B1).

In order to obtain more kinematical constraints the star has also been observed in the J2 band (1.2283-1.2937m) with the 1.6 m Perkin-Elmer telescope and Coudé spectrograph (with R=10 000) at the Observatório do Pico dos Dias, Laboratório Nacional de Astrofísica (LNA), Itajubá, Brasil. The spectra were recorded in the night 20/21 November 2005, at seven different positions along the slit using the Câmara Infravermelho (CamIV) detector. The images of the dark have been subtracted from each star’s spectral image, wavelength calibration image and five flat-field images. To get the sky image we made the median combination of the star’s spectral images (divided previously by the average of flat-field images). The sky image has been subtracted from stellar images and the one-dimensional spectra were extracted and calibrated in wavelength using the standard IRAF 111IRAF is distributed by the National Optical Astronomy Observatories, which is operated by the Association of Universities for Research in Astronomy (AURA), Inc., under cooperative agreement with the National Science Foundation. procedures. Finally the continuum normalization around the Pa line has been performed using our software. The average profile of the line, which has been used to constrain the kinematics within the disc, is plotted in Fig. 2 and 5.
3 Envelope extension and flattening
In this section we present the AMBER data in order to obtain an estimate of the CMa’s envelope geometry and extension. Assuming that the measured visibility in the continuum, , is only due to the central star and its circumstellar envelope and that the envelope is optically thin in the continuum, we can write:
| (1) |
where Vec and Fec are respectively the envelope visibility and flux in the continuum, V⋆ and F⋆ are the star visibility and flux in the continuum and Fc = Fec+F⋆.
The total flux is normalized, i.e. Fc = Fec + F⋆ = 1. Since the star is fully unresolved mas (assuming a 6 R☉ seen at 230 pc) which corresponds to for the longest baseline at 2.1 m, we assume in the following that V⋆=1. In order to estimate Vec we still have to determine the star and the envelope contributions at 2.1 m. Using the fit of the SED given in Fig. 3 we estimate that at this wavelength the stellar emission is similar to the envelope contribution, i.e. F⋆ = Fec = 0.5.

We have the same relation for the visibility in the Br line:
| (2) |
where Vr and Fr are respectively the measured visibility and flux in the Br line. Vc and Fc are previously defined and Ver and Fer are the visibility and flux only due to the Br line, i.e. without any stellar contribution and envelope continuum. Using the AMBER Br emission line profile plotted in Fig. 2 and neglecting the underlying broadened photospheric absorption line, we obtain Fer=0.5 and Fr=1.5 at the center of the line.
The corresponding visibilities, deduced from Eq. 1 and 2 and from the measurements shown in Fig. 2, are given in Table 3. Using a uniform disk model for the envelope contribution, for each measurement, we also estimate in Table 3 the corresponding angular diameters in the continuum and in the Br line. Since the envelope is marginally resolved in the continuum we simply put an upper limit to its angular size.
The envelope extensions in Br given in Table 3 are strongly dependent on the sky-plane baseline orientation as seen in Fig. 4, where we plotted the CMa (unresolved star + uniform disk) model diameters as a function of the baseline orientation.

The CMa circumstellar disk seems to be elongated along B1 but since we only have 3 visibility measurements we cannot accurately determine the angular position of the major-axis assuming an elliptical circumstellar disk. The envelope flattening given by the semi-major and semi-minor axis ratio, is about 20.7. Assuming that the disk is geometrically thin (i.e. its opening angle is only a few degree) we can estimate the range for the inclination angle i: 39i68. The lower limit of 39 relies on the lack of constraint on the disk opening angle.
| Base no | 1 | 2 | 3 |
|---|---|---|---|
| Baseline | UT2-3 | UT3-4 | UT2-4 |
| Length (m) | 42.7 | 59.3 | 80.8 |
| P.A. () | 51.6 | 128 | 97.1 |
| Vc | 0.93 | 0.93 | 0.93 |
| Vr/Vc | 0.930.02 | 0.950.02 | 0.90.02 |
| Vr | 0.85Vr0.95 | 0.87Vr0.97 | 0.82Vr0.92 |
| Vec | 0.86 | 0.86 | 0.86 |
| Ver | 0.69Ver0.85 | 0.75Ver0.91 | 0.60Ver0.76 |
| ec (mas) | 3.6 | 2.6 | 1.9 |
| er (mas) | 3.7er5.5 | 2.0er3.6 | 2.6er3.4 |
| ec (D⋆) | 15.5 | 11.2 | 8.2 |
| er (D⋆) | 15.9er23.7 | 8.6er15.4 | er14.6 |
4 SIMECA modeling
In order to obtain quantitative fundamental parameters of the central star and its circumstellar disk, we used the SIMECA code developed by Stee Stee0 (1994) and Stee Bittar Stee3 (2001) to model the CMa circumstellar environment. Since this code was axi-symmetric we made substantial modifications in order to introduce a longitudinal dependence of the envelope density as evidenced from the AMBER data plotted Fig. 2. To constrain the kinematics within the disk we use a Pa line profile obtained in December 2005 at the Observatorio do Pico do Dios, Brazil and plotted in Fig. 5. This profile is strongly asymmetric with a V/R double peak 1.3. This V/R 1 is usually interpreted in terms of a viscous disk similar to accretion disks where the gas and angular momentum are diffused outward by magnetohydrodynamic viscosity (Lee et al. lee, 1991). Considering the time-dependent structure of isothermal viscous disk, Okazaki okazaki (1997) showed that ”one-armed” density waves can propagate within the disk and should reproduce the observed V/R variations from V/R1 to V/R1 seen in the line profiles (Hummel & Hanuschik hummel, 1997). Such variations were detected for many Be stars, with period from a few years to over a decade (Hanuschik et al.hanuschik, 1995; Telting et al. Telting, 1994). But in the case of CMa the V/R ratio has remained constant for the last twenty years (Dachs et al. dachs, 1992; Slettebak Slettebak, 1992).


In figure 5 we over-plotted the supposed ”symmetric part” of the
Pa line profile, using an axi-symmetric model, and the
asymmetric residual that may be produced within the ”one-armed”
oscillation over-density. This effect must be compatible with the
asymmetric differential phase variation across the Br line for
the B1 baseline plotted in the bottom part of Fig. 5 since the
emitting regions in Pa and Br must be very close each
together. The asymmetric contribution to the Br emission is
about 20 to 30 of the total emission in this line whereas the mean
projected velocity of the inhomogeneity is -13020 kms-1.
Using a SIMECA model at 230pc we determined that the projected
separation between this over-density photocenter and the central star
is about 6.5⋆.
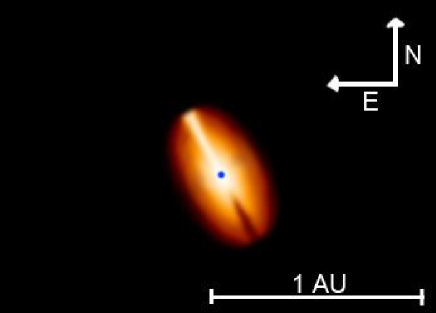
The parameters obtained for our best model are given in Table 4 with the corresponding spectroscopic and interferometric observables of Fig. 2. This best model includes an over-density along the disk major axis at +20, corresponding to an over-luminosity of 30% of the total flux in the line, and the agreement with the VLTI/AMBER data, the SED (Fig. 3) and the Pa line profile is very good as it can be seen Fig. 2. The very nice agreement with the differential visibility and phase across the Br line for the three bases validates the chosen disk geometry and kinematics. The 2.1m continuum visibilities obtained with the 3 baselines, respectively V1=0.92, V2=0.96 and V3=0.94 are also compatible with the 0.93 lower limit measured with AMBER. The corresponding continuum intensity map in the continuum at 2.15 m is plotted Fig. 6. The evaluation on the uncertainties of the parameters of our model is far below the scope of this letter and will be studied in depht as soon as we get more constraining data.
| parameter | value |
|---|---|
| 22 500 K 1000 | |
| Radius | 6 R☉ 1 |
| Inclination angle i | 60 10 |
| Equatorial rotation velocity | 240 km s-1 20 |
| rotation law exponent | 0.32 0.1 |
| Photospheric density () | 4. 10-11g cm-3 2 10-11 |
| Equatorial terminal velocity | 1 km s-1 10 |
| Polar terminal velocity | 1000 km s-1 100 |
| Polar mass flux | 2 10-11M☉ year-1 sr-1 0.5 10-11 |
| m1 | 10 5 |
| m2 | 10 2 |
| C1 | 30 10 |
| Envelope outer radius | 23 R⋆ 2 |
| Major axis position | +28 5 |
| Over-density position | along the disk major axis |
5 Discussion
Following recent VLTI/AMBER and VLTI/MIDI observations of Arae Meilland et al. 2006a concluded that this classical Be star fits very well within the classical scenario for the ”Be phenomenon”, i.e. a fast rotating B star close to its breakup velocity surrounded by a Keplerian circumstellar disk with an enhanced polar wind. This scenario was also confirmed for the Be star Achernar by Kervella & Domiciano de Souza kervella (2006) using VLTI/VINCI data, even if, for this latter case, the star was not in its active Be phase, i.e without any strong emission line and no circumstellar disk. Nevertheless, Achernar was still a nearly critical rotator and was still exhibiting an enhanced polar stellar wind. We will see in the following that CMa does not fit very well within this classical scenario.
5.1 Is CMa a critical rotator ?
If CMa was rotating close to its breakup velocity,
i.e. Vc=463kms-1, the inclination angle would be around
28 in order to obtain a measured vsini =220 kms-1).
With this inclination angle the maximum flattening
corresponding to a geometrically very thin disk is 1.12. Since we
measure a flattening of about 20.7 this inclination angle can
be ruled out. In our best SIMECA model the star is rotating at only
52 of its critical velocity. We may argue that the measured
elongation is not the envelope major axis but rather the enhanced
polar wind. In this case the projected axis of the Be envelope is
not identical to the rotation axis of the star. Nevertheless, in
order to obtain an asymmetry in the jet we need an extended
optically thick disk, perpendicular to the jets directions, that
may screen a least one part of the jet-like structure. Such
extended optically thick disk should have been detected with the
AMBER instrument which is not the case in our data.
The value of the projected rotational velocity for an early-B star can be
systematically affected by pseudo-photosphere, unrecognized
optically thick parts of the Be envelope as shown by
Harmanec harmanec (2002) for Cas. He obtains for this star
a vsini of 380 kms-1 instead of the often quoted value
of 230 kms-1 from Sletteback Slettebak (1992). Nevertheless,
taking the largest value for CMa from the literature from
Zorec zorec (2005) who found a vsini=243kms-1 we still
obtain an inclination angle of 32 which again is not in
agreement with our measured flattening. Of course, if the
discrepancy between the measured vsini and the ”real” one is
larger it may be possible that CMa is still a critical
rotator but it requires a factor of 2 between the measured and the
true vsini which we found unrealistic. Even if Townsend et
al. townsend (2004) include the gravity darkening effect on the vsini
values of rigid early-type rotators, assuming
a rotation rate / of 0.95, they conclude that
classic vsini determinations for B0 to B9-type stars can be
underestimated by 12 to 33%, far from a factor of 2. Moreover, a recent
paper by Frémat et al.fremat (2005) studying the effect of the
gravitational darkening on the determination of fundamental
parameters in fast rotating B-type stars found that on average the
rate of angular velocity of Be stars attains only
/0.88.
In this last paper, Frémat et al.fremat (2005) estimate CMa’s effective temperature to be 25790 713 K, a value significantly larger than the 22500 K used in our modeling. Moreover, Harmanec harmanec0 (2000) found a positive correlation between the emission strength and brightness in the optical. Therefore we may use the minimum observed V magnitude of about 3.5 to estimate the radius of the central star. Combining with the Hipparcos parallax and its error we obtain a radius between 9 and 14 solar radii. Using the Teff of 25790 K and a radius of 14 R☉ we obtain a stellar luminosity larger by a factor 8 compared to our modeling and thus it is not possible to obtain a good agreement with the observed SED plotted Fig.3. Thus we are more confident with our 6 R☉ used for our modeling and our finding that CMa seems not to be a critical rotator. Nevertheless, regarding the uncertainties and the large errors of all measurements the breakup velocity cannot be totally excluded.
5.2 Is the rotation law within the disk Keplerian ?
A Keplerian rotating law would produce a narrower
double-peak separation in the Pa line profile. Using a
simple axi-symmetric Keplerian disk model the double-peak
separation would be about 90kms-1 whereas we measure an
asymmetric double-peak separation of about 160kms-1. Even if
we subtract the emission of the over-density producing a larger
double-peak separation by contributing to the V peak of the
emitting Pa line, we still obtain a double-peak separation
of about 120kms-1 (see Fig. 5). The exponent of the rotation
law used for our best SIMECA model is 0.32 whereas it should be 0.5
for a purely Keplerian disk.
We may argue that Be stars vary strongly in time and thus line profiles shapes are time dependent. For instance actual H line profiles show a strong emission with a single peak whereas Bahng & Hendry bahng (1975) saw a double-peaked H emission line, with the same double-peak separation of 160 km-1 we obtained for Pa, with a shell core on their high-dispersion spectra. Nevertheless, these line variations are certainly related to the formation and disappearance of the circumstellar disk around the star as shown by Rivinius et al. rivinius (2001) and Meilland et al. 2006b . Whatever the model is, a double-peak line profile is a clear signature of an extended rotating disk, at least if the kinematics is not dominated by a strong stellar wind in the equatorial region as shown by Stee & de Araùjo Stee0 (1994). This double-peak separation is a good indication of the disk extension as shown by Huang huang (1972); Hirata & Kogure hirata (1984) and Stee & de Araùjo Stee0 (1994). We measure vdisk sini at the disk outer radius (Rdisk) from the peaks separation, where venv is the rotational disk velocity at Rdisk. Thus we can write:
| (3) |
where v⋆ is the star rotation at its photosphere.
Assuming a Keplerian rotation ( =0.5) we obtain, using Eq. 3, Rdisk=13.5 R⋆ which is about 2 from the 19.8 R⋆ interferometric measurement, assuming that the measured elongation is the envelope major axis and not an enhanced polar wind (see discussion in the previous point). Note that these 19.8 R⋆ found are obtained assuming a uniform disk for the envelope and thus is certainly a lower limit to the ”true” disk extension in the Pa line. Thus it seems difficult to maintain a Keplerian rotation within the disk of CMa.

5.3 Is the ”one-armed” viscous disk model a possible scenario for CMa ?
The asymmetry presently detected in the disk of CMa seems to be hardly
explained within the ”one-armed” viscous disk framework.
Following the viscous disk models by Okazaki okazaki (1997) and the observational detection of
”one-armed” oscillations in the disk of Tau by Vakili et
al. vakili (1998) and Cas by Berio et al. berio (1999), the
precessing period (P) of such oscillations should be confined within
a few years up to about twenty years for the longer ones. On
the other side, we tried to compile all the observational data
available in order to obtain a ”quasi-period” for the V/R
variations. First we must mention that the V/R variations occur
during the time intervals of observable presence of Be envelopes
and that they can show long-term, medium-term as well as rapid
changes (Dachs dachs1, 1981). Moreover, the very strong
H line profile is not really suitable to V/R measurements
since it is single-peaked and the illusion of apparent V/R changes
can be related to the presence of telluric lines. Finally,
compiling the data between 1965 and 2003 for CMa
respectively from Jaschek Jaschek (1965),
Slettebak Slettebak0 (1982), Banerjee banerjee (2000) and this
work, we were not able to deduce an estimation of a quasi-period
(Fig. 7). Several authors suggested a very
long V/R variation (i.e. Okazaki P28 years). This is a possibility but
an equally plausible possibility is that the star had two episodes
of V/R changes with much shorter cycle length separated by a period
of quiescence documented by Dachs et al. dachs, 1992; Slettebak Slettebak, 1992.
More observations are needed
since, if this first possiblity could be confirmed, then there is a problem for the one-armed model.
This ”pseudo-period” would be too long compared to theoretical predictions which can be hardly
longer than two decades for a disk with a radius 23R⋆
(Okazaki, private communication). Moreover, the fact that this
over-density remains confined along the major axis of the
disk seems to be a very nice coincidence…
Clearly, further observations are mandatory to confirm these conclusions or to see if other physical phenomena occurred within the circumstellar disk of CMa.
Acknowledgements.
We thanks Atsuo Okasaki for his useful comments about the viscous discs models. We acknowledge the remarks of the referee Petr Harmanec which help to greatly improve the paper. We thank David Chapeau and Damien Mattei for the SIMECA code developments support. The AMBER project has benefited from funding from the French Centre National de la Recherche Scientifique (CNRS) through the Institut National des Sciences de l’Univers (INSU) and its Programmes Nationaux (ASHRA, PNPS). The authors from the French laboratories would like to thank the successive directors of the INSU/CNRS directors. The authors from the the Arcetri Observatory acknowledge partial support from MIUR grants and from INAF grants. C. Gil work was supported in part by the Fundação para a Ciência e a Tecnologia through project POCTI/CTE-AST/55691/2004 from POCTI, with funds from the European program FEDER. This research has also made use of the ASPRO observation preparation tool from the JMMC in France, the SIMBAD database at CDS, Strasbourg (France) and the Smithsonian/NASA Astrophysics Data System (ADS). This publication makes use of data products from the Two Micron All Sky Survey. The AMBER data reduction software amdlib has been linked with the open source software Yorick222http://yorick.sourceforge.net to provide the user friendly interface ammyorick. They are freely available on the AMBER website http://amber.obs.ujf-grenoble.fr.References
- (1) Bahng J.D.R. & Hendry E. 1975, PASP, 87, 137
- (2) Banerjee, D.P.K., Rawat, S.D. & Janardhan, P. 2000, A&AS, 147, 229
- (3) Berio, Ph., Stee, Ph., Vakili, F. et al. 1999, A&A 345, 203
- (4) Bonneau, D.; Clausse, J.; Delfosse, X. et al. 2006, A&A, 4469
- (5) Dachs, J., Eichendorf, W., Schleicher, H. et al. 1981, A&AS, 43, 427
- (6) Dachs, J., Poetzel, R. & Kaiser D. 1989, A&AS, 78, 487
- (7) Dachs, J., Hummel, W. and Hanuschik R.W. 1992 A&AS 95, 437
- (8) Domiciano de Souza, A., Kervella, P., Jankov, S. et al. 2003, A&A, 407, L47.
- (9) Frémat, Y., Zorec, J., Hubert, A-M et al. 2005, A&A, 440, 305
- (10) Hanuschik, R.W., Hummel, W., Dietle, O. et al. 1995, A&A, 300, 163
- (11) Harmanec, P. 1988, BAICz, 39, 329
- (12) Harmanec, P. 2000, Alicante IAU Col. 175, ASP 214, 13
- (13) Harmanec, P. 2002, ASPC, 279, 221
- (14) Hirata, R. & Kogure, T. 1984, Bull. Astr. Soc. India, 12, 109
- (15) Huang, S. 1972, ApJ, 171, 549
- (16) Hummel, W. & Hanuschik, R.W. 1997, A&A, 320, 852
- (17) Jaschek, C. and Jaschek M. 1965, PASP 77, 376
- (18) Kervella, P. & Domiciano de Souza, A. 2006, A&A, in press
- (19) Lee, U., Osaki, Y. & Saio, H. 1991, MNRAS, 250, 432
- (20) Marlborough, J.M. and Peters, G.J. 1986, ApJ Sup. Ser., 62, 875
- (21) Meilland, A., Stee, Ph., Vannier, M. et al. 2006a, A&A, in press
- (22) Meilland, A., Stee, Zorec, J. et al. 2006b, A&A, 455, 953
- (23) Mennickent, R.E., Vogt, N., Barrera, L.H. 1994, A&AS, 106, 427
- (24) Millour, F., Tatulli, E., Chelli, A. et al. SPIE 2004, 5491, 1222
- (25) Millour, F., Vannier, M., Petrov, R.G et al. 2005, EAS Publications Series, in press
- (26) Millour, F., Petrov, R. G, Chesneau, O. et al. 2006, A&A, accepted.
- (27) Okazaki, A., 1997, A&A 318, 548
- (28) Petrov, R. G, Malbet, F., Antonelli, P. et al. 2006, A&A, submitted.
- (29) Perrin, G. 2003, A&A, 400, 1173
- (30) Popper, D.M. 1980, ARA&A, 18, 115
- (31) Prinja R.K. 1989, MNRAS, 241, 721
- (32) Rivinius, Th., Baade, D., Stefl, S. et al. 2001, A&A, 379, 257
- (33) Schaller, G., Schaerer, D., Meynet, G. et al. 1992, A&AS, 96, 269
- (34) Slettebak, A. 1982, ApJ, 50, 55
- (35) Slettebak, A., Collin, G., et al., 1992, ApJS 81, 335
- (36) Stee, Ph., de Araùjo, F.X. 1994, A&A, 292, 221
- (37) Stee, Ph., de Araùjo, F.X., Vakili F. et al. 1995, A&A, 300, 219
- (38) Stee, Ph. and Bittar, J. 2001, A&A, 367, 532
- (39) Tatulli, E., Millour, F., Chelli, A. et al. 2006, A&A, in press
- (40) Telting, J.H., Heemskerk, M.H.M., Henrichs, H.F. et al. 1994, A&A, 288, 558
- (41) Townsend, R.H.D., Owocki, S.P., & Howarth, I.D. 2004, MNRAS, 350, 189
- (42) Vannier, M., Millour, F. and Petrov, R.G. in The power of optical/IR interferometry, ESO conf, 2005, in press.
- (43) Vakili, F., Mourard, D., Stee, Ph., et al. 1998, A&A 335, 261
- (44) Zorec, J., Frémat, Y. & Cidale, L. 2005, A&A, 441, 235