The Complex Mid-Infrared Structure at the Heart of IRAS 20126+4104
Abstract
The mid-infrared emission at the center of IRAS 21026+4104 is not that of a simple compact source, as one would expect from an isolated high mass protostellar object. Furthermore the central thermal infrared emission does not appear to be coming directly from a circumstellar disk as has been recently hypothesized from near-infrared observations. The mid-infrared structure is complex, but with the help of multiple wavelength information two plausible scenarios to explain the emission in the region are advanced. The first is that there is a tight cluster of young stellar objects here. The second is that the mid-infrared emission and masers are delineating the walls of the outflow cavities of a massive stellar source located in the center of the near- and mid-infrared dark lane.
1 Introduction
It is not clear if massive stars in general form through accretion processes similar to low-mass stars. At present, the best example of a massive star with a possible accretion disk and bipolar outflow is considered to be IRAS 20126+4104 (see Cesaroni et al. 2006 for review). Originally thought to be a simple and compact high mass protostellar object (a.k.a. hot molecular core), more recent observations by Cesaroni et al. (2005) have shown this source to be 7 M⊙, surrounded by a 5000 AU Keplerian rotating CS “disk”, with an outflow near perpendicular seen in H2 and SiO. Whether this large “disk” is a circumstellar accretion disk or a accretion envelope feeding some unseen central accretion disk is still not understood.
Recent observations in the near-infrared (NIR) by Sridharan et al. (2005) revealed two K-band sources separated by a “dark lane”, interpreted as scattered emission on either side of a silhouette disk at the center of the larger rotating molecular “disk”. It was also concluded that the thermal emission from the 5 observations may be tracing the dust emission from the central accretion disk itself.
Observations at longer thermal infrared wavelengths are not hindered as much by extinction so are better tracers of the thermal dust emission that may be coming from the disk. In this article I describe recent high angular resolution mid-infrared (MIR) observations that reveal a much more complex dust structure than previously thought.
2 Observations
Observations were performed at Gemini North with the Michelle MIR imager and spectrograph. The instrument uses a Raytheon 320240 pixel Si:As IBC array with a pixel scale of 0.099 pixel-1. Sky and telescope subtraction were achieved through the standard chop-nod technique. Imaging was performed using the Si-6 (c=12.5 , =1.2 ) filter and the Qa (c=18.3 , =1.6 ) filter. On-source exposure times of 282s and 82s were used, respectively. Flux calibration was achieved by observing the MIR standard star HD199101 at a similar airmass to IRAS 20126+4104. Assumed flux densities for HD199101 were taken to be 5.84 Jy at 12.5 and 2.63 Jy at 18.3 . Flux densities measured are listed in Table 1. Uncertainties in these flux densities are estimated to be 10% at 12.5 and 15% at 18.3 .
The images at both wavelengths were deconvolved using the maximum likelihood method (Richarson 1972, Lucy 1974). Since no natural point-spread function (PSF) stars were observed, artificially generated PSFs with full width at half maximums equal to the diffraction limit (0.33 at 12.5 and 0.48 at 18.3) were used in the deconvolutions. The deconvolution routine was stopped at 25 iterations for the 12.5 image and 50 iterations for the 18.3 image. These deconvolved images compare favorably to simple unsharp masking of the original images, and thus the revealed sub-structures in the deconvolved images are believed to be real.
The relative astrometry between the NIR (K, L and M) and the MIR images was accurately determined due to the presence of two (M) or three (K and L) common point sources in the field. The mean residual offset between the 12.5 and NIR images was found to be less than a Michelle pixel (0.099) in all cases (0.04 for K, 0.03 for L, and 0.09 for M).
3 Results
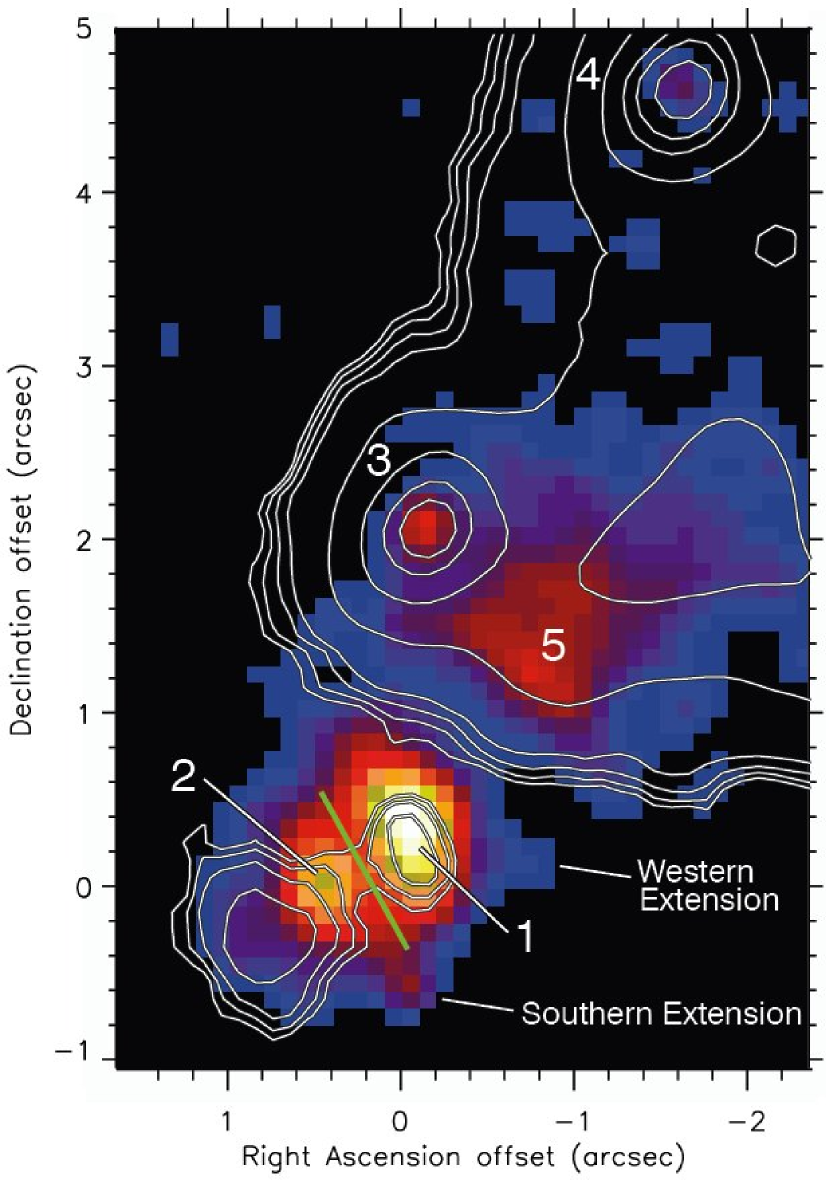
Figure 1 shows a portion of the deconvolved 12.5 field centered on the coordinates of the 1.3 cm radio continuum peak of Hofner et al. (2006). Near the origin is a bright MIR double source (IRAS20126+4104:D06 1 and IRAS20126+4104:D06 2, from now on these will be referred to as simply D06 1 and D06 2). These MIR sources, like the double source seen at K by Sridharan et al. (2005), have a “dark lane” separating them. Most importantly, the dark lane between the K-band sources, which is hypothesized by Sridharan et al. (2005) to be the “absorbtion lane” of the NIR silhouette disk, is exactly coincident with the dark lane between the two mid-infrared sources.
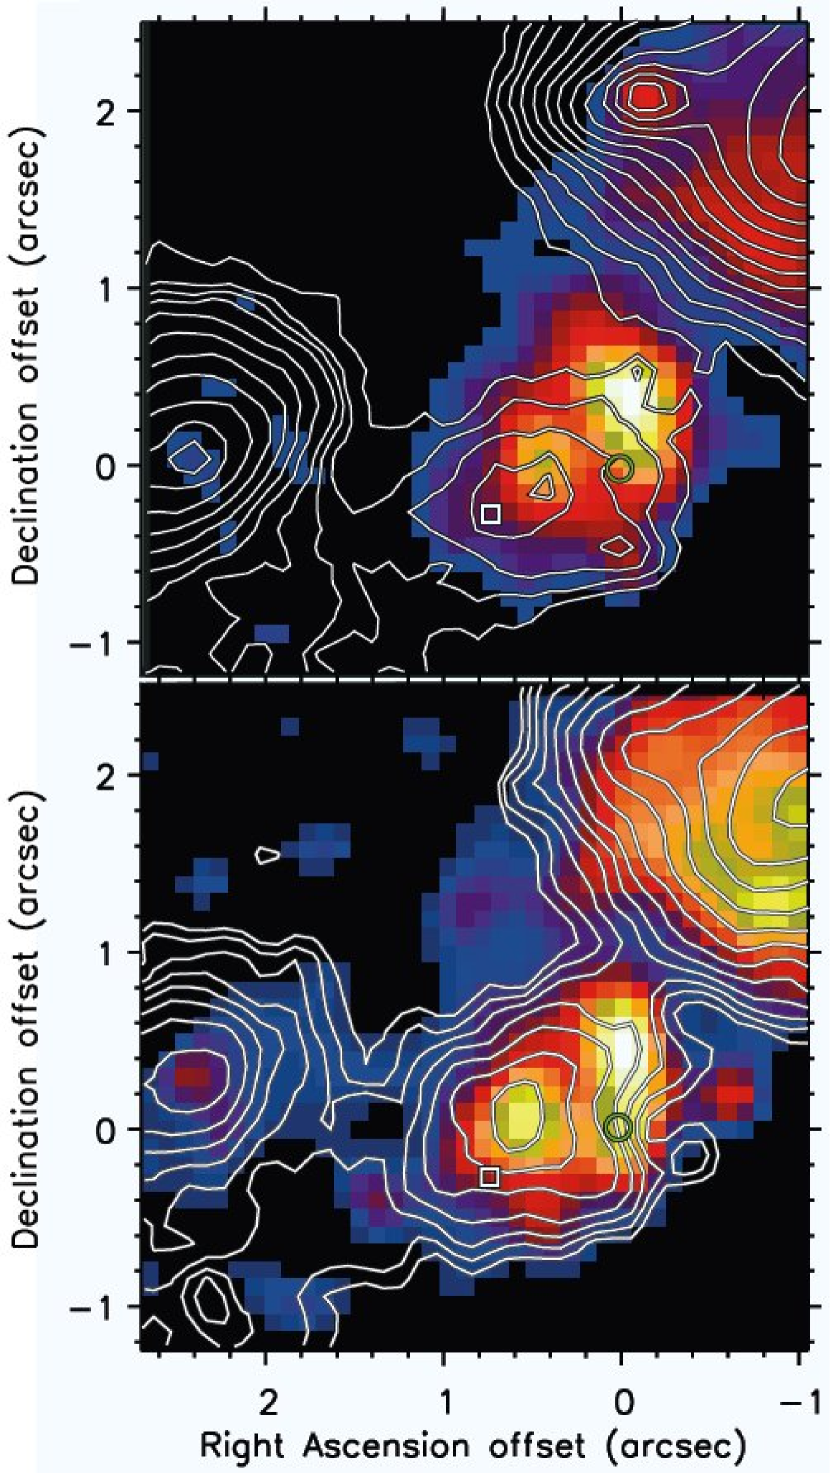
Figure 2 shows that the comparisons between the MIR images and the L and M images of Sridharan et al. (2005). The M peak is coincident with the MIR emission from D06 2. Consequently this means that the M peak is not located in the dark lane as suggested by Sridharan et al. (2005). Since this NIR dark lane is also the location of minimum
| Source | F12.5µm | F18.3µm | LMIRa | Spec |
|---|---|---|---|---|
| (Jy) | (Jy) | L(⊙) | Typea | |
| D06 1 | 0.71 | 3.71 | 58 | B9 |
| D06 2 | 0.34 | 2.97 | 63 | B9 |
| Double Sourceb | 1.06 | 6.45 | 106 | B8 |
| Whole Fieldc | 1.89 | 23.5 | 715 | B5 |
Note: Accuracy of the flux densities: 10% at 12.5, 15% at 18.3 .
a These are lower limits to the luminosity and spectral type
derived from the MIR flux densities and assuming all emission is
from a single stellar source. See De Buizer et al. (2005) for
techniques and assumptions.
b Flux density in a 10 radius aperture
around D06 1 and D06 2 only.
c Flux density in a 80 radius aperture
encompassing all MIR sources.
flux density between the MIR sources D06 1 and D06 2, and D06 2 is coincident with the M peak, the suggestion by Sridharan et al. (2005) that the longer wavelength NIR emission is tracing thermal dust emission from a near edge-on circumstellar disk inside the dark lane between the K band sources is not confirmed.
The secondary peak seen at L by Sridharan et al. (2005) is found to be coincident with a MIR extension to the south of the MIR double source in the deconvolved 12.5 image (labeled the “southern extension” in Figure 1). Another MIR extension to the west of the D06 1 is weak at 12.5 , but is clearly evident and resolved from the double source at 18.3 (labeled the “western extension” in Figure 1). One further difference between the 12.5 and 18.3 deconvolved images is the shape of D06 1. At 18.3 the source is elongated further to the south (0.2) than at 12.5 (see Figure 2).
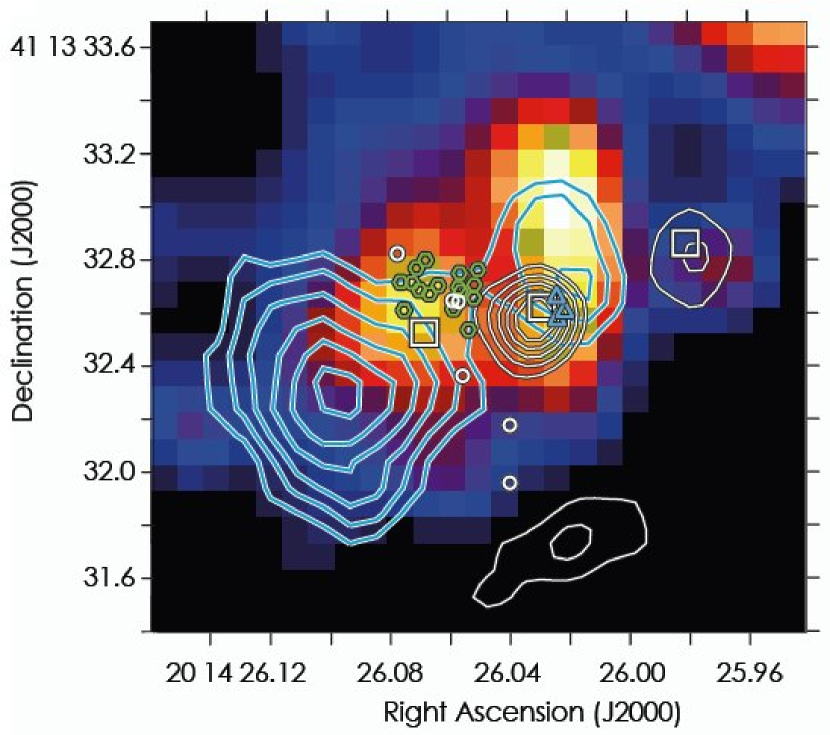
Figure 3 shows the comparison of the 18.3 deconvolved image to several other wavelengths known to have very good (0.15) absolute astrometric accuracy. The K band image (blue contours) of Sridharan et al. (2005) is claimed to be known to an absolute astrometric accuracy of 0.15. Because the relative registration between the NIR and MIR images is shown to be better than 0.1, the absolute position error of the MIR image is therefore the quadrature addition of these two values, namely 0.18.
Also shown in Figure 3 are the locations of OH, water, and methanol masers from Edris et al. (2005). The absolute astrometry of these masers are known to better than 25 mas. Also plotted in Figure 3 are the three water maser locations of Tofani et al. (1995), which appear to be associated with the locations of D06 1 and 2 and the MIR western extension. The 3.6 cm radio continuum (white contours) from Hofner et al. (2006) are also shown in Figure 3. The brightest radio component has a peak near the southern elongation of D06 1 seen at 18.3 . The westernmost radio continuum component lies very close (0.1) to the MIR western extension. The radio continuum component to the south has no associated MIR emission.
Figure 3 shows a complex distribution of multi-wavelength emission, however the astrometric precision of all of these observations facilitates the interpretation of the combined data set. Two possible scenarios will now be forwarded that may explain the observed complexity, though further data will be require to test either scenario. The first scenario is that there is a cluster of young sources resent at the center of IRAS 210126+4104, and the second
is that the different wavelengths of emission are coming from different tracers of the bipolar outflow from this region centered on the dark lane seen in the NIR and MIR.
3.1 Multiple Source Scenario
The heart of IRAS 210126+4104 may contain a small cluster of young stellar sources of various masses and in various stages of formation. There could be several individual sources here, among them could be D06 1, D06 2, each of the 3 radio continuum peaks. These sources would have various associations, for instance, D06 2, which is coincident with the peak seen by Sridharan et al. (2005) at M, as seen in Figure 2. This source is also traced by copious amounts of methanol, OH, and water maser emission, but has no radio continuum emission of its own. Based solely on the MIR luminosity and assuming emission from a single stellar source, a lower limit to the spectral type for D06 2 of B9 was derived (Table 1) using the methods of De Buizer et al. (2005). In contrast, the source associated with the brightest radio continuum peak does not appear to have any directly related MIR emission at 12.5 , and based on the work of Hofner et al. (1999) could be an embedded UCHII region of a star of spectral type B3. However, the MIR emission of D06 1 does extend towards this source at 18.3 and may be marking the weak emission at longer MIR wavelengths from the radio continuum source. In this multiple source scenario, the dark lane seen in the NIR and MIR would simply be a
space separating the various IR sources present, like the “dark lane” between D06 1 and D06 5.
This scenario of having more than one young stellar source at the heart of IRAS 20126+4104 could help to explain the detection of apparently two outflows from this region: one nearly N-S and the other NW-SE, and with red-shifted and blue-shifted lobes reversed in the two cases (Cesaroni et al. 2005). These outflows could come from two independent stellar sources, as has been suggested before (e.g. Lebrón et al. 2006). Given its central location with respect to the overall NIR/MIR emission as well as the H2 outflow, and its association with the majority of the masers in the region, D06 2 could be the dominant young stellar object in the cluster in this scenario.
Hofner et al. (1999) point out that if the three radio peaks are considered to be three ZAMS stars of spectral type B3 (as indicated by their radio continuum emission), there is a problem accounting for the total luminosity of the region at far-infrared (FIR) wavelengths. Three such stars combined would have a luminosity of only 3.0103 L⊙, but the FIR luminosity measured by IRAS is 1.3104 L⊙. But if just one of these MIR sources without radio continuum emission (i.e. D06 2) is an HMPO, then this could explain the higher flux densities at FIR wavelengths since it is at these longer wavelengths that the SEDs of HMPOs peak.
3.2 IR Emission from Outflow Scenario
Sridharan et al. (2005) assert that the dark lane between the K band sources is an “absorption lane” of a silhouette disk of a young massive stellar source and that the longer wavelength IR emission comes from the dust emission of the accretion disk in this absorption lane. However, the NIR and MIR emission share a common dark lane between the northwestern and southeastern sources of IR emission. In this section an alternate scenario is proposed in which this dark lane is indeed an absorption lane of an embedded stellar source, however it is instead argued that both the NIR and MIR are coming from scattered and direct emission, respectively, off the outflow cavities from this stellar source.
Figure 3 shows that all of the maser species are predominantly situated along the inner edges of the absorption lane but are associated with the infrared emission and not the lane itself (contrary to what is claimed by Edris et al. 2005 based on the NIR data alone). Therefore a more simplistic scenario could be that the masers and MIR emission are delineating the walls of the cavities of an outflow coming from the massive embedded star at the center of the absorption lane. The NIR, MIR, radio continuum, and maser emission in this region would be coming from different parts of the NW and SE outflow cavities. The outflow axis seen in H2, SiO, and HCO+ (Cesaroni et al. 1999) has a position angle close to -60∘. The dark lane seen in the MIR lies at 30∘ (Figure 1), perpendicular to the outflow. The other extended MIR emission components in the field (IRAS21026+4104:D06 5, and perhaps D06 3 and D06 4 in Figure 1) lie close to this outflow axis and may be outflow-related MIR emission since they are coincident with K and H2 emission here.
The two northern knots of radio continuum emission in Figure 3 are hypothesized by Hofner et al. (2006) to perhaps be a part of a outflow jet emanating from a stellar source located in the IR dark lane. This jet is aligned slightly more E-W (-70∘) than the outflow seen in H2, SiO, and HCO+, and is much different than the larger scale CO outflow (Lebrón et al. 2006) that appears closer to N-S (-25∘). The high shock temperature required to excite the H2 =1-0 S(1) transition is several thousand degrees, whereas for CO (J=2-1) it is just a few K. H2 rapidly cools below the temperature where it can emit in a time scale of 1 yr (Le Bourlot et al. 1999). However, the CO remains excited in the post-shock gas (since the gas temperature here is in excess of the 5K needed for this to happen), thus providing a fossil record of the outflow shock-interaction. Therefore instead of being due to multiple outflowing sources as described in the last section, there may be one wandering outflow responsible for the apparent array of outflow angles seen. The CO could be indicating the past history of the outflow, whereas the H2 and radio continuum emission is denoting what is occurring more recently.
In this outflow cavity scenario, the southeastern component of the double source at K and the MIR emission from D06 2 would be tracing different parts of the southeastern outflow cavity. Cesaroni et al. (2005) finds that the high-velocity outflowing gas is red-shifted to the southeast and blue-shifted to the northwest. Therefore the disk is not exactly edge-on, and we expect to have a more direct
and unextinguished view of the northwestern outflow cavity than the southeastern. The southeastern NIR and MIR emission is extended on the same scale, however the MIR peak is closer to the absorption lane than the NIR peaks. The emission in the MIR of D06 2 may be seen closer to the dark lane because the MIR emission penetrates more easily through obscured areas and is generally orders of magnitude less efficiently scattered than K emission in an outflow cavity. This holds true under the general assumption that there is not a large variation in the dust composition and size distribution throughout this whole region. Assuming this to be true, the emission in the thermal IR (MIR and M) in the southeastern cavity would appear closest to the absorption lane, at L the peak is further out, and at K even further out.
Given the more favorable viewing angle and with extinction playing less of a role, we have a more direct view of the northwestern outflow cavity. This means we can directly see the hot dust down closer to the stellar source itself at L and M. This, plus resolution effects due to the fact that the emission from above and below the dark lane are closer together at L and M than at K, may account for the fact that the extinction lane is not as prominent at these wavelengths. The K emission may be seen further out due to the efficiency with which it scatters, and MIR emission may be further out because it is tracing the cooler dust. This, combined with the better resolution at these wavelengths may help to enhance the appearance of the dark lane at K and in the MIR.
The MIR southern extension may also be better explained by the outflow cavity scenario. The emission at this location is not apparent at K, bright at L, marginally detected at M, present at 12.5 , and shifted in location at 18.3 . If the emission is coming from a outflow region, it is plausible that line emission, temperature and optical depth gradients, and scattering could cause the infrared emission peaks to move as a function of wavelength within the outflow cavity. However further data, including spectroscopy, will be required to know the true nature of the southern extension. The main point however is that this behavior as a function of wavelength could not be due to a stellar “binary companion”, as suggested by Sridharan et al. (2005), as dusty young stellar sources have increasing flux density as a function of increasing wavelength.
The outflow scenario also fits well the observed maser properties. Moscadelli et al. (2000, 2005) have already shown that their observations of the water maser spots can be well-fit to a model where they are moving outward from the location of the dark lane along the axis of outflow. In a similar fashion, here it is suggested that the methanol maser emission is associated with the inner parts of the southeastern outflow cavity. This matches recent observations indicating that methanol masers are associated with the outflows from young massive stars (e.g., De Buizer 2003, De Buizer 2006).
Assuming the unseen stellar source at the center of the dark lane is responsible for radio continuum emission in outflow, Hofner et al. (1999) derived a B1 spectral type for this central star under the assumption that the radio continuum emission is beamed emission into the jet cavity. All of the extended MIR emission could indeed be heated by a single B1 star as well. The farthest MIR source, D06 4, is 8500 AU away from the radio continuum peak, but assuming smooth astronomical silicates and small grains, it is possible to heat dust to 120K out to this distance (see De Buizer 2006). Therefore, all of the MIR emission observed to be associated with IRAS 21026+4104 requires no more than a single B1 stellar source at its heart, and a multiple source scenario is not necessary. However, it is possible that there are other young stellar sources (perhaps D06 3, 4, and 5) present and helping to heat the dust in the regions farther from the center.
References
- Cesaroni et al. (1997) Cesaroni, R., Felli, M., Testi, L., Walmsley, C. M., & Olmi, L. 1997, A&A, 325, 725
- Cesaroni et al. (1999) Cesaroni, R., Felli, M., Jenness, T., Neri, R., Olmi, L., Robberto, M., Testi, L., & Walmsley, C. M. 1999, A&A, 345, 949
- Cesaroni et al. (2005) Cesaroni, R., Neri, R., Olmi, L., Testi, L., Walmsley, C. M., & Hofner, P. 2005, A&A, 434, 1039
- Cesaroni et al. (2006) Cesaroni, R., Galli, D., Lodato, G., Walmsley, C. M., & Zhang, Q. 2006, in PPV, in print
- De Buizer (2003) De Buizer, J. M. 2003, MNRAS, 341, 277
- De Buizer (2006) De Buizer, J. M. 2006, ApJ, 642, L57
- De Buizer et al. (2005) De Buizer, J. M., Radomski, J. T., Telesco, C. M., & Piña, R. K. 2005, ApJS, 156, 179
- Edris et al. (2005) Edris, K. A., Fuller, G. A., Cohen, R. J., & Etoka, S. 2005, A&A, 434, 213
- Hofner et al. (1999) Hofner, P., Cesaroni, R., Rodríguez, L. F., & Martí, J. 1999, A&A, 345, L43
- Hofner et al. (2006) Hofner, P., Cesaroni, R., olmi, L., Rodríguez, L. F., Martí, J., & Araya, E. 2006, in prep.
- Le Bourlot et al. (1999) Le Bourlot, J., Pineau des Forêts, G., & Flower, D. R. 1999, MNRAS, 305, 802
- Lebrón et al. (2006) Lebrón, M., Beuther, H., Schilke, P., & Stanke, T. 2006, A&A, 448, 1037
- Lucy (1974) Lucy, L. B. 1974, AJ, 79, 745
- Richardson (1972) Richardson, W. H. 1972, Opt. Soc. Am., 62, 55
- Sridharan et al. (2005) Sridharan, T. K., Williams, S. J., & Fuller, G. A. 2005, ApJ, 631, L73
- Tofani et al. (1995) Tofani, G., Felli, M., Taylor, G. B., & Hunter, T. R. 1995, A&AS, 112, 299