The host galaxy of GRB 011121: Morphology and Spectral Energy Distribution ††thanks: Based on observations made with the NASA/ESA Hubble Space Telescope under program with proposal ID 9180, obtained from the data archive at the Space Telescope Science Institute. STScI is operated by the Association of Universities for Research in Astronomy, Inc. under NASA contract NAS 5-26555,††thanks: Based on observations made with ESO Telescopes at the La Silla or Paranal Observatories under program ID 165H.-0464
We present a detailed study of the host galaxy of GRB 011121 (at ) based on high-resolution imaging in 5 broad-band, optical and near-infrared filters with HST and VLT/ISAAC. The surface brightness profile of this galaxy is best fitted by a Sersic law with index – 2.5 and a rather large effective radius ( 7.5 kpc). Both the morphological analysis and the F450W - F702W colour image suggest that the host galaxy of GRB 011121 is either a disk-system with a rather small bulge, or one hosting a central, dust-enshrouded starburst. Hence, we modeled the integrated spectral energy distribution of this galaxy by combining stellar population and radiative transfer models, assuming properties representative of nearby starburst or normal star-forming, Sbc-like galaxies. A range of plausible fitting solutions indicates that the host galaxy of GRB 011121 has a stellar mass of 3.1 – , stellar populations with a maximum age ranging from 0.4 to 2 Gyr, and a metallicity ranging from 1 to 29 per cent of the solar value, as a function of the time elapsed since star formation started. As for the opacity, starburst models suggest this galaxy to be nearly as opaque as local starbursts (with an – 0.76 mag). On the other hand, normal star-forming Sbc-like models suggest a central opacity larger than that of local disks by up to a factor of 8, whereas the attenuation along the line of sight is only – 0.57 mag owing to the galaxy’s low inclination. For this subluminous galaxy (with ), we determine a model-dependent star formation rate (SFR) of 2.4 – , which gives a SFR per unit luminosity of 9.2 – and a SFR per unit stellar mass of 0.4 –. The former specific SFR is high compared to those of most GRB host galaxies, but consistent with those of most of the hosts at similar low redshift. Our results suggest that the host galaxy of GRB 011121 is a rather large disk-system in a relatively early phase of its star formation history.
Key Words.:
gamma rays: bursts – galaxies: fundamental parameters – radiative transfer1 Introduction
1.1 GRB host galaxies
For nearly all localized Gamma-ray bursts (GRBs) an underlying galaxy was detected after the decay of the optical/near-infrared (IR) afterglow. The current sample of long duration GRB (LGRB) host galaxies consists of 80 members spanning a large range in magnitudes, i.e. 22 – 28 mag in R-band. The observed redshifts of the current sample ranges from (Fynbo et al. fyn00 (2000)) to (Berger et al. ber06 (2006))111see also Jochen Greiner’s web page: http://www.mpe.mpg.de/jcg/grb.html.
The analysis of the observed colour of a subsample of GRB host galaxies detected until 2002, showed that these are faint blue galaxies with mag in agreement with their nature of star-forming galaxies (Le Floch et al. lef03 (2003)). The blue colours of GRB host galaxies are indicators of the link between GRBs and massive-star formation. Other indicators of the GRB – massive star connection are Wolf-Rayet-star signatures (Mirabal et al. mir03 (2003)) and the offsets between the locations of the GRBs and their host galaxy centers (Bloom et al. 2002a ; Fruchter et al. fr06 (2006)). For four GRBs, the connection between the GRB and the death of a massive star has been proven unambiguously by the spectroscopic detection of a supernova underlying the GRB afterglow (Galama et al. gal98 (1998); Hjorth et al. hjor03 (2003); Matheson et al. mat03 (2003); Stanek et al. sta03 (2003); Malesani et al. male04 (2004); Mirabal et al. mir06 (2006); Pian et al. pian06 (2006)). Recent studies conclude that the specific star formation rate (SSFR), i.e the SFR per unit stellar mass, is particularly high for GRB host galaxies, indicating that they are among the most efficiently star-forming objects in the universe (Courty et al. cour04 (2004); Christensen et al. 2004b ; Gorosabel et al. gor05 (2005)).
Accurate studies of the morphology, stellar populations, SFRs, and masses of GRB host galaxies are obviously ideally conducted at low redshift, given the better S/N and angular resolution. Photometric and spectroscopic studies of a number of nearby LGRB hosts allowed to explore the fundamental characteristics (luminosity, age, intrinsic extinction, SFR, metallicity) of those galaxies and has proven that detailed host investigations provide important information on the close environment of the GRB explosion site (Fynbo et al. fyn00 (2000); Sollerman et al. sol05 (2005); Rau et al. rsg06 (2006)).
In general, the faintness of the GRB host galaxies represents a limit for good S/N spectroscopy. Broad-band spectral energy distributions (SEDs) are effective substitutes of spectra for determining the galaxy properties. Analysis of the optical/near-IR SEDs of 11 GRB host galaxies revealed that the majority are best fitted with starburst galaxy templates (Sokolov et al. so01 (2001)) using stellar-population models from PÉGASE (Fioc & Rocca-Volmerange f97 (1997)) or again with a starburst type galaxy template (Gorosabel et al. 2003a ; 2003b ; Christensen et al. 2004a ) of Bruzal & Charlot (bc93 (1993)) using HyperZ (Bolzonella et al. bol00 (2000)). This, together with the optical faintness and colours, was recognized as an indication that long duration GRBs with a detected afterglow predominantly trace unobscured star-formation in subluminous blue galaxies.
| Filter | Date | Tele/Instr | Exposure | Sersic index n | Effective radius | Position angle | Ellipticity1 |
|---|---|---|---|---|---|---|---|
| sec | kpc | degree | |||||
| F450W | 2002-04-21 (day 161) | HST/WFPC2 | 4500 | 2.10.3 | 7.41.4 | 30.72.9 | 0.520.03 |
| F555W | 2002-05-02 (day 172) | HST/WFPC2 | 4500 | 1.80.1 | 7.20.5 | 31.67.5 | 0.130.02 |
| F702W | 2002-04-29 (day 169) | HST/WFPC2 | 4500 | 2.70.1 | 9.30.6 | 27.53.0 | 0.150.01 |
| F814W | 2002-04-29 (day 169) | HST/WFPC2 | 4500 | 2.40.1 | 7.60.5 | 20.64.8 | 0.130.02 |
| Js | 2002-02-09 (day 90) | VLT/ISAAC | 1800 | 1.00.5 | 3.92.2 | 192 | 0.123 |
-
1
Defined as 1 - (semi-minor-axis/semi-major-axis).
-
2
The best-fit position angle value with an upper limit of 135.
-
3
The best-fit ellipticity value with an upper limit of 0.42.
1.2 GRB 011121
GRB 011121 was detected by the Gamma-ray Burst Monitor/Wide-field Camera on board BeppoSAX on 2001 November 21, 18:47:21 UT (Piro pir01 (2001)). Piro et al. (piro05 (2005)) suggested that there is absorbing gas associated with a star-forming region within a few parsec around the burst in connection with a decreasing column density from NH = 721022cm-2 to zero during the early phase of the prompt emission. The optical/near-IR afterglow was discovered independently by several groups (e.g., Wyrzykowski et al. wyr01 (2001); Greiner et al. g01 (2001)). Further observations revealed excess emission in the light curve associated with a supernova (Bloom et al. 2002b ; Price et al. pri02 (2002); Garnavich et al. gar03 (2003); Greiner et al. g03 (2003)). The spectroscopic redshift of GRB 011121 is =0.362 from Greiner et al. (g03 (2003)) who determined it by fitting the strong host emission lines, i.e. H, H, [OII], [OIII], underlying the spectrum of the afterglow.
The host galaxy of GRB 011121 is one of the most extensively and deeply imaged hosts. High resolution images are available in optical and near-IR filters covering the rest-frame wavelength range of – . This gives us the unique possibility to study the host galaxy properties through the parameter space from morphology to stellar mass.
Here we present the morphological and spectral energy distribution analysis of the host galaxy of GRB 011121 using archival HST/WFPC2 and VLT/ISAAC data. In Sections 2, 3 and 4 we present the data reduction, morphological analysis and the photometry of this galaxy, respectively. In Sect. 5 we analyse the spectral energy distribution of the host galaxy and derive properties of the stellar population and the interstellar medium (ISM). In Sect. 6 we calculate the SFR and SSFR and compare the values with other galaxies. Finally, we summarize our results in Sect. 7.
We adopt = 0.7, = 0.3 and H0 = 65 km s-1 Mpc-1 throughout this paper. The luminosity distance at the redshift of the host () is DL = 2080.2 Mpc, and 1 arcsecond corresponds to 5.43 kpc.
2 Observations and data
2.1 Data reduction
Imaging of the field of GRB 011121 has been performed at many epochs. For the present analysis we have chosen the data acquired by the HST Wide Field Planetary Camera 2 (WFPC2) and the VLT Infrared Spectrometer And Array Camera (ISAAC), sufficiently late after the GRB so that the afterglow does not contribute significantly to the brightness of the host galaxy. The HST data were acquired approximately 5 months after the burst, using 4 filters: F450W, F555W, F702W and F814W (see Tab.1). These data were obtained as a part of a large program (ID: 9180, PI: Kulkarni) intended to probe the environment of GRBs. The total exposure time in each filter is 4500 seconds. An independent analysis of these data has been published in Bloom et al. (2002b ), concentrating on the supernova signature underlying the afterglow lightcurve.
The HST imaging data were pre-processed via “on the fly” calibration, i.e. with the best bias, dark, and flat-field available at the time of retrieval from the archive. The Wide Field (WF) chips of WFPC2 have a pixel scale of 01/pixel. The images for each filter were dithered by subpixel offsets (resulting in a pixel scale of 005/pixel) using the IRAF/Dither2 package to remove cosmic rays and produce a better-sampled final image. For all HST observations, the host position falls near the serial readout register of WF chip 3 which minimizes the correction for charge transfer efficiency (CTE) to around 5 per cent in count rate, therefore we ignore the CTE correction for the photometry.
The VLT/ISAAC data were obtained in the -band on February 9, 2002 with an exposure of 1800 seconds (see Tab.1), and reported earlier in Greiner et al. (g03 (2003)). These data were also obtained as a part of a large program (ID: 165H.-0464, PI: van den Heuvel) intended to understand the physics of GRBs and the nature of their hosts. The -band images were reduced using the ESO Eclipse package (Devillard dev05 (2005)).
Zero-point magnitudes for the HST filters were taken from Dolphin (2000)222see also http://purcell.as.arizona.edu/wfpc2calib/. For the VLT images, two local photometric standard stars given by Greiner et al. (g03 (2003)) were used to obtain the photometric calibration. Both for the HST and the VLT data, the background values of the images were calculated using IRAF/imexamine in the corresponding filters. The 1 surface brightness limits are calculated using the formula given by Temporin (tem01 (2001)):
| (1) |
where is the standard deviation from the mean of the background, is the zero-point, is the exposure time in seconds and is the pixel scale.
2.2 Astrometry
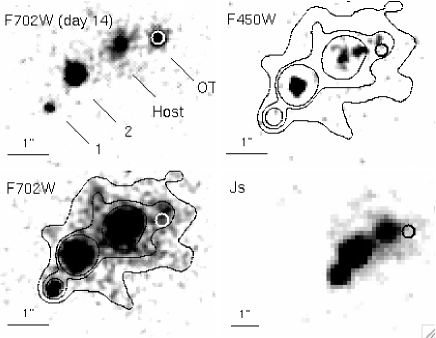
Images obtained at different epochs and different filters were registered relatively to an early F702W image where the OT is clearly visible (top left image of Figure 1), using standard MIDAS routines. We used at least three isolated stars to find the relative shift and rotation of two images. The centers of the stars were computed assuming a point source. We did not re-scale the images since the HST images have the same scale. The estimated accuracy of our relative astrometry is 10 mas given by the rms error of the mapping using MIDAS routines. We note that the uncertainties due to optical distortion for the HST images are rather small and are largely removed by the dithering process (Fruchter & Hook fruh02 (2002)). The relative position of the OT in the , as shown in the bottom right image of Figure 1, is similarly estimated using an early VLT/ISAAC image from Nov 24, 2001 (see Greiner et al. g03 (2003)), with an rms of 30 mas.
2.3 Extinction
As for the necessary correction for Galactic extinction, the study of Schlegel et al. (schl98 (1998)), based on COBE and IRAS extinction maps, gives a value of Galactic reddening along the line of sight of GRB 011121 equal to mag. However, different authors have argued that extinction estimates based on far-IR measurements overpredict the true value by about 30% (Dutra et al. dut03 (2003); Cambrésy et al. cam05 (2005)). In particular, Dutra et al. (dut03 (2003)) recommend to scale the value of given by Schlegel et al. (schl98 (1998)) by a factor of 0.75 for lines of sight corresponding to regions with and mag. This holds for the line of sight of GRB 011121, hence we assume mag as the correct value of Galactic reddening. This value corresponds to a V-band extinction mag for the standard Galactic extinction curve of Cardelli et al. (car89 (1989)), where . We correct the observed photometry of the host-galaxy of GRB 011121 for Galactic extinction according to this law.
Using the broad-band spectral energy distribution of the optical transient (OT) of GRB 011121, Garnavich et al. (gar03 (2003)) estimated mag, and Price et al. (pri02 (2002)) estimated mag for the total (i.e. Galactic plus internal) reddening. These two analyses offer consistent results as for the total extinction and reddening, within the uncertainties. However, note that these authors implicitly assumed that the solution of radiative transfer for the light through the host-galaxy of GRB 011121 is the same as for the light from a star in the Galaxy.
Our assumed values of Galactic reddening and extinction are consistent with the previous total values, within 1 . However, we do not conclude that the extinction produced by dust in the host-galaxy of GRB 011121 is negligible. In fact, the optical spectra of two slightly different regions (due to different slit widths) containing the OT of GRB 011121, taken by Greiner et al. (g03 (2003)) 4 and 21 days after the GRB event, give values of the Balmer-line flux ratio equal to and , respectively, after correcting the line fluxes for foreground extinction. Both Balmer-line flux ratios derived from Greiner et al. (g03 (2003)) are higher (by 2 ) than the value of 2.86 predicted for the standard case B recombination333Although the blast wave of the GRB may cause shock-ionization, Perna et al. prl (2000) showed that it is expected to influence the ionization state of the gas on timescales of hundreds to thousands of years after the burst. Therefore we take the case B recombination as representative of the dust-free case, and assume that the photo-ionization effect of GRB prompt and afterglow emission on the circumburst environment is negligible (see Küpcü Yoldaş et al. aky (2006)). (e.g. Osterbrock os89 (1989)) and implies an AV of 1.6 and 2.5, respectively, derived using the extinction curve of Cardelli et al. (car89 (1989)). Higher than predicted Balmer-line flux ratios are due to dust present in the small-/large-scale environment of H II regions (Cox & Mathews cm69 (1969); Mathis m70 (1970)). Hence the presence of a non-negligible amount of dust extinction in the host-galaxy of GRB 011121 is a feasible working hypothesis.
3 Morphology of the host galaxy
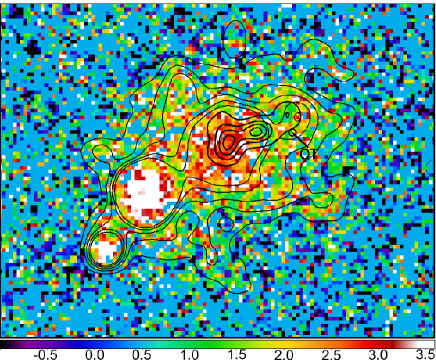
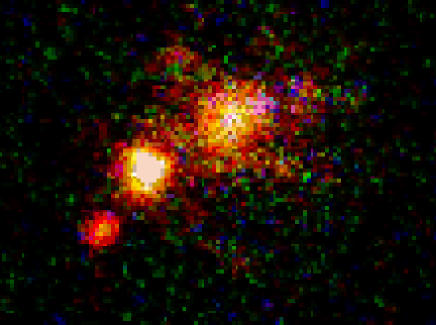
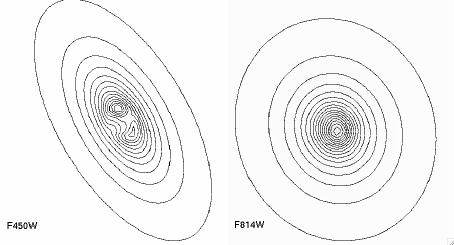
The high-resolution data in 5 broad-band filters allow a colour-resolved morphological analysis. Figure 1 shows images of the host galaxy of GRB 011121 in various filters. This galaxy exhibits a different structure in the F450W band compared to the redder band data (see Fig. 1 top right and bottom left images). In the F702W image we see a nearly face-on extended structure. On the other hand, the F450W image – despite the lower sensitivity – reveals three emission regions , most probably indicating the sites of enhanced star formation in the galaxy, considering that the size of a star forming region ( few pc) is much smaller than the sizes of these blue emission regions (1-2 kpc). The difference of morphology in different filters is reflected in the F450W – F702W color image of the galaxy (see Fig. 2). The center of the galaxy is red with mag, the background value being mag. The three emission regions seen in the F450W filter exhibit equal to 2.60.1 mag, 1.50.1 mag and 0.950.15 mag, respectively.
The morphological analysis of the host galaxy of GRB 011121 was performed using Galfit (Peng et al. peng02 (2002)). Galfit is a 2D galaxy and point-source fitting algorithm which can fit an image with multiple analytical models simultaneously. For the galaxy under investigation, an initial model assuming a classical de Vaucouleurs bulgeexponential disk profile did not provide a good representation. Therefore, we made use of a Sersic profile (Sersic sers (1968)) where all the related parameters (i.e. effective radius, Sersic index, position angle) were left free. The top panel of Figure 4 shows the image of the field of the host galaxy in the F814W band, and the residual image after the subtraction of the galaxy model. The results of the best fits obtained with Galfit for each filter are listed in Table 1.
The best-fit values for ellipticity and position angle are in agreement with each other for all filters, except the ellipticity for the F450W filter (see the bottom panel of Fig. 4). There is a similar agreement for the effective radius and the Sersic index parameters. We note that the values for the F450W fit should be evaluated carefully, considering that the galaxy image has a relatively lower signal-to-noise ratio due to the sensitivity of the detector and therefore probably probes only the high surface brightness regions. Nevertheless, the values except the ellipticity are still in agreement for all images, indicating that we actually trace the profile of the galaxy in a decent way.
Galaxies at cosmological redshifts are commonly classified according to their Sersic index as disk systems () and bulge-dominated systems (, see Ravindranath et al. rav04 (2004)). However, we note that a central, dust-enshrouded starburst can produce a Sersic profile with index of about 2 and a redder colour in the inner region of a disk system as seen for the host of GRB 011121 (see Fig.2). The detection of a bulge can be hindered by the fact that the galaxy is observed nearly face-on, the best-fit ellipticity value being 0.13 (0.50 for F450W). Although the Sersic index of our reddest band data (-band) is consistent with values typical of a disk-dominated galaxy, this is still consistent with an extended disk structure dominating a small, unresolved bulge, since the spatial resolution of the -band image is almost three times worse than that of the HST images. We also inspected the radial colour profile and found that it is constant within the errors, indicating that there is no significant difference in the radial profile of the galaxy in different filters except for F450W. Therefore, the host galaxy of GRB 011121 can be either a disk system with a small bulge as also indicated by the enhanced traces of spiral arms in Figure 3, i.e. an Sbc-like galaxy, or a disk system experiencing dust-enshrouded starburst activity in its central regions.
Similar results on the morphology of the host galaxy of GRB 011121 were obtained by two other groups using different methods. Wainwright et al. (wain05 (2005)) performed a morphological analysis using Galfit on the same HST data as used here plus the F850L filter data; they concluded that the galaxy is a disk system. Our results are generally in agreement with those of Wainwright et al. (wain05 (2005)), except for the F450W filter, for which there is a 4 difference in the effective radius. Note that we cannot quantify the difference since Wainwright et al. did not quote any errors for their results. On the other hand, also Conselice et al. (con05 (2005)) performed a morphological analysis based on the concentration and asymmetry parameters using the F702W filter data taken 3 months after the GRB. They concluded that the host is probably a late-type spiral consistent with our results.
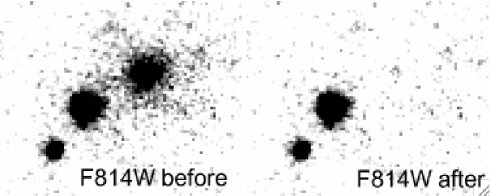
The OT of GRB 011121 was clearly distinguishable in earlier images taken with HST/WFPC2 since it is located in the outskirts of its host galaxy (top left image of Fig.1). None of the emission regions seen in the F450W band data coincides with the OT position (see the top right image Fig.1).
In addition, we investigated the nature of the two objects in the vicinity of the host galaxy. The radial surface brightness profile of these objects is described by the point spread function in the HST images, as estimated from the stars in the field. Furthermore, there was no X-ray emission associated with these objects in the X-ray imaging of the afterglow. Hence we conclude that the objects marked as number 1 and 2 in Figure 1 (top left) are most probably foreground stars. We conducted the photometry of these objects including also the H and K data from Nov 24, 2001 (ID: 165H.-0464, PI: van den Heuvel) acquired by VLT/ISAAC, in order to estimate the spectral type assuming that they are stars. The colors of object 2 are =1.160.10 mag, =0.620.05 mag and = 0.140.03 mag. These colors indicate that object 2 is a main-sequence star of spectral type of M2 (Tokunaga tok00 (2000)). The colors of object 1 are much redder with =2.850.10 mag, =0.170.10 mag and =0.610.12 mag. These colors fit marginally with that of a late M-type or an early L-type star (Tokunaga tok00 (2000); Leggett et al. leg03 (2003)). However, we do not exclude the possibility that object 1 may be an unresolved high-redshift galaxy.
4 Photometry
Photometry was extracted using the IRAF/Ellipse task which performs aperture photometry inside elliptical isophotes. To determine the size of an aperture which covers the galaxy and minimizes the contamination by the background noise, the 1 surface brightness limit and the metric radius were calculated for each image. The metric radius is defined as the radius where the Petrosian index = 0.2, the Petrosian index being the ratio of the average surface brightness within a radius to the surface brightness at (Petrosian pet76 (1976); Djorgovski & Spinrad ds81 (1981)). Both values correspond to a semi-major axis length of 2.1 – 2.4 arcsec for all images except for the F450W filter image for which the surface brightness limit is reached at 1. In order to conduct a consistent analysis, we performed aperture photometry on each image with the same semi-major axis length of 2.25 arcseconds. Table 2 shows the resulting magnitudes and errors. The errors in magnitudes were calculated assuming Poisson noise and include the readout noise and zero-point errors. The background fluctuation values were obtained by calculating the standard deviation from the mean background values measured for several different areas near the galaxy. Then a correction due to dithering was applied to the background noise of the HST images, assuming that the dither pattern is uniform (see Fruchter & Hook fruh02 (2002)).
Magnitudes were computed using i) the best-fit ellipticity and position angle for each filter obtained by Galfit, and ii) fixing the ellipticity and position angle to 0.13 and 275, respectively for all filters. The results were the same for both cases. Ellipse also provides the magnitudes inside a circular area having the same radius of the semi-major axis of the elliptical isophote. We compared the magnitudes determined within the circular and elliptical areas and found that the difference is 0.02 mag. This indicates the reliability of the 225 extent, the position angle and the ellipticity of the galaxy.
| Filter | Brightness1 | Foreground extinction | Absolute magnitude2,3 |
|---|---|---|---|
| mag | mag | mag | |
| F450W | 23.440.04 | 1.43 | -19.5 |
| F555W | 22.640.02 | 1.14 | -20.3 |
| F702W | 21.630.01 | 0.86 | -20.6 |
| F814W | 21.180.02 | 0.67 | -21.1 |
| Js | 19.870.06 | 0.32 | -22.1 |
-
1
Magnitudes are not corrected for Galactic extinction.
-
2
The absolute magnitudes are corrected for Galactic extinction.
-
3
The absolute magnitudes are given for the filters B, V, R, I, J in respective order.
The value of M (uncorrected for dust attenuation) for redshifts between 0 and 0.5 is given by Dahlen et al. (dah05 (2005)) as -21.06 for . It is derived by fitting a Schechter luminosity function and using all types of galaxies, i.e. early type, late type and starbursts. From this value, we determine a luminosity ratio of LB/L = 0.26 for the host galaxy of GRB 011121, which indicates that this galaxy is subluminous.

5 Analysis of the Spectral Energy Distribution
Hereafter we analyze the SED of the host galaxy of GRB 011121 to deduce galaxy properties like characteristic age and metallicity of the stellar populations and the SFR. We apply both the publicly available HyperZ code (Bolzonella et al. bol00 (2000)) as well as our own modelling, to explore the galaxy properties.
5.1 Analysis using HyperZ
Following the seminal work on GRB host galaxies by Christensen et al. (2004a ; 2004b ), we make use of HyperZ (Bolzonella et al. bol00 (2000)). In particular, this code considers a large grid of models based on 8 different synthetic star-formation histories (Bruzual & Charlot bc93 (1993)), roughly matching the observed properties of local field galaxies (starburst, elliptical, spiral, and irregular ones). For all models, metallicity is fixed to the solar value (). The empirical formula of Calzetti et al. (cal00 (2000)) for nearby starbursts is used to describe attenuation by dust in galaxies, independent of the star-formation history and morphology. Finally, a Miller & Scalo (ms79 (1979)) initial mass function with an upper mass limit for star formation of 125 is used.
As a result of the fitting of the broad-band photometry of the host galaxy of GRB 011121 with HyperZ models, we find that old ages (i.e. 1 – 2 Gyr) are not favoured (best-fit values of 45 Myr for starbursts and up to 720 Myr for spirals and irregulars), while the amount of internal extinction is non-negligible ( = 0.80 – 1.0 mag, rest frame) for all models producing equally valid fits with . For a so-called Calzetti law, = 0.80 – 1.0 mag corresponds to – 0.25 mag. We note that this value of reddening by internal dust refers to the whole galaxy and, thus, is not directly comparable in a quantitative way to the values estimated from spectroscopy of the OT region, once the contribution of Galactic reddening is removed.
These results hold independent of the synthetic star-formation history of the model, which mirrors the fact that the 4000 -break is not very prominent in stellar populations younger than 1 Gyr and, thus, does not offer a robust constraint to discriminate different evolutionary patterns. Finally, we note that an even broader range of possible values for age and extinction exists if we consider fits with . This increase in degeneracy of the solutions is not a shortcoming of HyperZ because it was designed to find photometric redshifts and provides only a rough estimate of the SED type (see Bolzonella et al. bol00 (2000)), independent of morphology.
5.2 Broad-band SED fitting
In order to exploit the information on morphology available for the host galaxy of GRB 011121 and better link the mode of star-formation and the properties of dust attenuation, we build our own set of physically motivated models. We combine different, composite stellar population models and models of radiative transfer of the stellar and scattered radiation through different dusty media. We use a tailored grid of parameters in order to probe the very wide parameter space available for models in an efficient way. A large suite of synthetic SEDs is built as a function of total (gasstars) mass, age (i.e. the time elapsed since the onset of star formation) and a characteristic opacity of the model, as described in the following subsections. These three free model parameters are determined from the comparison of synthetic broad-band apparent magnitudes (observed frame) and the apparent magnitudes determined for the host galaxy of GRB 011121 (see Sect. 4) through the standard least-square fitting technique.
5.2.1 Stellar population models
We model the intrinsic (i.e. not attenuated by internal dust) SED of the host galaxy of GRB 011121 as a composite stellar population. We make use of the stellar population evolutionary synthesis code PÉGASE (Fioc & Rocca-Volmerange f97 (1997)) (version 2.0) in order to compute both the stellar continuum emission and the nebular emission. Gas is assumed to be transformed into stars of increasing metallicity as the time elapsed since the onset of star formation increases, the initial metallicity of the ISM being equal to zero. The stellar initial mass function (IMF) is Salpeter (s55 (1955)), with lower and upper masses equal to 0.1 and 120 , respectively. Adopting a different IMF affects mostly the determination of the stellar mass; for instance, a Chabrier (cha03 (2003)) IMF produces stellar masses lower by about 30 per cent than a Salpeter (s55 (1955)) one.
The mass-normalized SFR of the models is assumed either to be constant (starburst models) or to decline exponentially as a function of time (normal star-forming galaxy models). For models of a normal star-forming galaxy, we adopt e-folding times equal to 1 and 5 Gyr to describe the star-formation histories of the bulge and disk components, respectively, the bulge-to-total mass ratio being set equal to 0.05, 0.1, 0.15 or 0.2. For starburst models, a range of 18 ages between 0.1 and 9 Gyr is considered444Models older than 9 Gyr do not offer a physical representation of a galaxy at as the host of GRB 011121., the time step being fine (i.e 0.1 Gyr) up to an age of 1 Gyr and coarse (i.e. 1 Gyr) since then. On the other hand, for normal star-forming galaxy models, a range of 28 ages between 0.5 and 7 Gyr is considered. For these models, a fine time step is adopted for ages between 1 and 3 Gyr in order to better follow the different evolution of the stellar populations of the bulge and disk components. Finally, we assume that the total mass of the system ranges from to , 200 steps in mass being considered.
5.2.2 Dust attenuation models
As a statistical description of dust attenuation in starbursts, we make use of the Monte Carlo calculations of radiative transfer of the stellar and scattered radiation by Witt & Gordon (wit00 (2000)) for the SHELL geometry. In this case, stars are surrounded by a shell where a two-phase clumpy medium hosts dust grains with an extinction curve like that of the Small Magellanic Cloud (SMC), as given by Gordon et al. (gcw97 (1997)). We note that these models describe dust attenuation in nearby starburst galaxies (Gordon et al. gcw97 (1997)) as well as in Lyman Break Galaxies at (Vijh et al. vij03 (2003)). We consider 14 values of the opacity (0.25 – 9), where is the radial extinction optical depth from the center to the edge of the dust environment in the V-band, assuming a constant density, homogeneous distribution.
On the other hand, for the normal star-forming galaxy models we assume that dust attenuation is described by the Monte Carlo calculations of radiative transfer of the stellar and scattered radiation for an axially symmetric disk geometry illustrated in Pierini et al. (2004b ) and based on the DIRTY code (Gordon et al. gor01 (2001)). These models have been applied successfully to interpret multiwavelength photometry of edge-on late-type galaxies in the local Universe (Kuchinski et al. kuc98 (1998)). The physical properties of the dust grains are assumed to be the same as those in the diffuse ISM of the Milky Way (from Witt & Gordon wit00 (2000)). Furthermore, this time we use as a parameter the central opacity , that refers to the face-on extinction optical-depth through the centre of the dusty disk in the V-band. In these disk models, the central opacity is equal to 0.5, 1, 2, 4, 8, and 16.
From the observed ellipticity of the host galaxy of GRB 011121 (see Tab. 1), we determine an inclination of about 18 degrees, for an intrinsic axial ratio of 0.2. Hence we adopt disk galaxy models with only this inclination since inclination effects on the total luminosity are small for inclinations much less than 70 degrees in a disk-dominated system (e.g. Pierini et al. dp03 (2003)) like the host galaxy of GRB 011121. In fact, the Sersic index fitted to different light profiles of the host galaxy of GRB 011121 (see Tab. 1) is consistent with the presence of a small bulge like in Sbc galaxies. Greiner et al. (g03 (2003)) estimated the bulge-to-disk (B/D) -band luminosity ratio to be about 0.28 using a de Vaucouleursexponential model to reproduce the -band surface brightness profile of the host galaxy of GRB 011121. Hence, we use a bulge-to-disk -band luminosity ratio between 0.23 and 0.33 as a further constraint for our bulgedisk models allowing for mismatches between the fitting model of Greiner et al. (g03 (2003)) and the structure of the system described in Pierini et al. (2004b ).
Finally, for all models we assume that the gas emission at a given wavelength is attenuated by the same amount as the stellar emission at that wavelength, independent of whether the gas emission is in a line or in the continuum (see Pierini et al. 2004a for a discussion).
5.2.3 Results
For a suite of 50,400 starburst models plus 124,800 normal star-forming models, synthetic SEDs and magnitudes are computed and evaluated against the observed broad-band SED of the host galaxy of GRB 011121 (see Sect. 4). Reassuringly, each suite of models brackets the best-fit solution although the parameter space is not spanned in a uniform way. Hereafter we illustrate the basic aspects of those fit solutions that are called “plausible”, being characterized by , that corresponds to a probability of 0.001 for two degrees of freedom (given by 5 photometric points minus 3 model parameters).
As Fig. 6 shows, plausible solutions for the starburst case imply ages between 0.4 and 2 Gyr and, accordingly, an opacity decreasing from 1.5 to 0.5. This domain is narrower than the explored parameter space, nevertheless it still expresses the well-known age–opacity degeneracy for starbursts (Takagi et al. tak99 (1999)). At the same time, the bolometric luminosity-weighted metallicity in stars increases from to , while the total mass of the system drops from 18.5 to . The latter range corresponds to a range of 3.1 – in stellar mass. In particular, the best-fit model for the starburst case has an age of 0.5 Gyr, a bolometric luminosity-weighted metallicity in stars equal to , a stellar mass of and an opacity equal to 1.5555The two-phase, clumpy SHELL model of Witt & Gordon (wit00 (2000)) with SMC-type dust and produces an attenuation curve that best matches the so-called Calzetti law for nearby starbursts (see Calzetti et al. cal00 (2000) and references therein).. We note that corresponds to an attenuation of the total flux at V-band (rest frame) and a reddening on the scale of the system.

On the other hand, plausible solutions for the normal star-forming case have a bulge-to-total mass ratio equal to 0.15. They imply ages between 1.3 and 1.9 Gyr and, accordingly, a central opacity of the disk decreasing from 16 to 2 (see Fig. 7). At the same time, the bolometric luminosity-weighted metallicity in stars of the disk increases from to . The total mass of the system drops from 2.5 to from the youngest and most opaque systems to the oldest and least opaque ones. The range in stellar mass spanned by these plausible solutions is 4.9 – . In particular, the best-fit model for the normal star-forming case has an age of 1.3 Gyr, a bolometric luminosity-weighted metallicity in stars of the disk equal to , a stellar mass of and a central opacity of the disk equal to 16. We note that corresponds to an attenuation (along the line of sight) of the total rest-frame V-band flux for an inclination of 18 degrees. In terms of reddening of the stellar component of the only disk, the best-fit Sbc-like model implies on the disk scale. Even smaller values of reddening will apply to a peripheral region of the disk, where the OT of GRB 011121 was actually located. Hence plausible solutions for a normal star-forming bulgedisk system comfortably meet the constraints on a low amount of reddening in the OT region of GRB 011121.

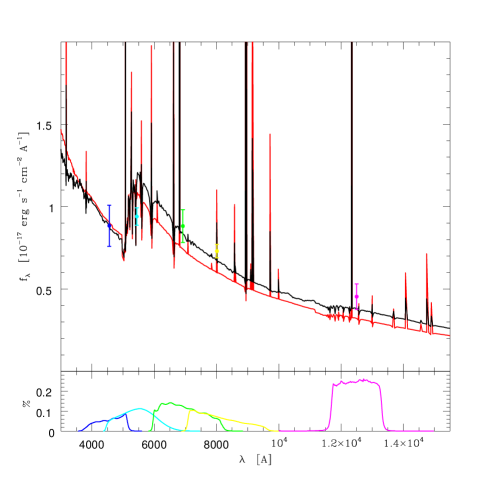
Figure 8 shows how the best-fit models for a starburst system and a normal star-forming bulgedisk system reproduce the observed photometry of the host galaxy of GRB 011121. The comparison with the data reveals that both best-fit models underpredict the observed -band magnitude by about 0.1 mag, i.e. almost 2 . This is the main reason for their rather high values of . A posteriori, we interpret this discrepancy as due to the fact that PÉGASE (version 2.0) does not include the contribution to the total emission from the thermally pulsating asymptotic giant branch (TP-AGB) phase of stellar evolution (see Maraston mar05 (2005)). TP-AGB stars are cool giants exhibiting very red optical/NIR colours (e.g. Persson et al. per83 (1983)). They are expected to play a significant role in the rest-frame visual-to-near-IR emission of galaxies containing 1-Gyr-old stellar populations (Maraston mar98 (1998, 2005)). Now the best-fit models contain stellar populations that are up to 0.5 or 1.3 Gyr old (starburst or Sbc-like model, respectively), hence it is plausible that they can slightly underpredict the flux in the observed -band magnitude666We note that the models of Bruzual & Charlot (bc93 (1993)) included in HyperZ (Bolzonella et al. bol00 (2000)) do not include the contribution to the total emission from the TP-AGB stars (see Maraston mar05 (2005)) as well. However, they have stellar populations with only solar metallicity, which are redder than those with lower metallicity..
We tested that the previous results are not biased by the absence of the contribution to the total emission from the TP-AGB stars in PÉGASE (version 2.0). We performed new fits where the range in the -band B/D allowed by the estimate of Greiner et. al. (g03 (2003)) and/or the -band flux were not used to constrain the solutions. In this case, plausible solutions were characterized by , that corresponds to a probability of at least 0.001 for the only one degree of freedom for both starburst and Sbc-like models. The new plausible solutions for starburst models allowed a slightly larger parameter space but without major changes with the exception that a limited number of plausible solutions with a 1 did exist now (see Table 3). Also for normal star-forming bulgedisk models the parameter space allowed by the new plausible solutions became slightly larger (see Table 4); in particular, the bulge-to-total mass ratio was unconstrained. These new solutions spanned the whole range in central opacity, the least opaque models () having older ages (1.5 – 2.9 Gyr) than the most opaque ones (with and an age of 1.0 – 1.7 Gyr). Models with larger bulge-to-total mass ratios tended to be younger, independent of the central opacity; however, the stellar mass was still a few to several times overall. This time plausible solutions with a did exist also for Sbc-like models, without major changes in terms of properties of the stellar populations and mass of the system.
| age | Z | M⋆ | ||
|---|---|---|---|---|
| Gyr | ||||
| 0.25 – 1.5 | 0.4 – 2.0 | 0.3 – 1.6 | 3.1 – 4.9 | |
| 1 | 0.8 – 0.9 | 0.6 – 0.7 | 3.5 – 3.8 |
| B/T1 | age | Z | M⋆ | ||
|---|---|---|---|---|---|
| Gyr | |||||
| 0.05 | 0.50 – 16 | 1.0 – 2.9 | 3.0 – 8.5 | 3.6 – 6.4 | |
| 0.05 | 4, 16 | 1.3 – 1.5 | 3.9 – 4.6 | 4.8 – 5.0 | |
| 0.10 | 0.50 – 16 | 1.0 – 2.6 | 3.0 – 7.7 | 3.3 – 6.4 | |
| 0.10 | 0.50 – 8 | 1.5 – 2.1 | 4.6 – 6.3 | 4.4 – 5.1 | |
| 0.15 | 0.50 – 16 | 1.0 – 2.5 | 3.0 – 7.5 | 3.9 – 6.9 | |
| 0.15 | 0.50, 4, 8 | 1.3 – 1.8 | 3.9 – 5.5 | 4.4 – 4.9 | |
| 0.20 | 0.50 – 16 | 1.0 – 2.3 | 3.0 – 6.9 | 3.6 – 6.8 | |
| 0.20 | 0.50, 1, 4, 16 | 1.2 – 1.9 | 3.6 – 5.8 | 4.6 – 5.6 |
-
1
Bulge-to-total mass ratio.
6 Star Formation Rate
The previous plausible solutions give values of the SFR equal to 3.1 – (starburst models) or 2.4 – (normal star-forming, Sbc-like models), the value of SFR decreasing as the time elapsed since the start of star formation increases 777For a different region of the host galaxy GRB 011121 containing the OT, Greiner et al. (g03 (2003)) estimated values of the SFR from [OII] and emission-line diagnostics at times when the afterglow was present. These values are: (SFROII) and 0.61 – (SFRHα). It is clear that these values do not refer to the whole galaxy and are not corrected for the intrinsic extinction.. For the same models, the SFR per unit stellar mass is equal to 0.6 – or 0.4 –, respectively. Consistently, for this subluminous galaxy (), the SFR per unit luminosity is equal to 11.9 – or 9.2 – .
These values of the SFR per unit stellar mass are high compared to those of simulated galaxies in Courty et al. (cour04 (2004)), in agreement with their conclusion that the GRB-host galaxies are identified as the most efficient star-forming objects. Other GRB-host galaxies have high values of the SFR per unit luminosity (cf. Christensen et al. 2004a ), though not as high as our estimates. Recent calculations by Gorosabel et al. (gor05 (2005)) and Sollerman et al. (sol05 (2005)) give similar values of the extinction-corrected SFR per unit luminosity for the host galaxies of the two low-redshift GRB 030329 and GRB 031203.
Finally, we compared the values obtained for the SFR per unit galaxy stellar mass of the host galaxy of GRB 011121 with those of observed galaxies selected from the MUNICS and FORS deep field surveys (Bauer et al. bau05 (2005)) in the same redshift range as the previous GRBs and GRB 011121 itself. The values of the specific SFR (SSFR) given by Bauer et al. (bau05 (2005)) were determined from the [OII] line flux without any correction for dust extinction. This comparison confirms that the host galaxy of GRB 011121 is among the galaxies with highest specific SFR at these redshifts even after allowing for an extreme correction factor of 10 for the SSFRs given by Bauer et al. (bau05 (2005)).
7 Summary
The existence of high-resolution imaging in 5 broad-band, optical and near-infrared filters with HST and VLT/ISAAC for the host galaxy of GRB 011121 (at ) allows a detailed study of both the morphology and the spectral energy distribution of this galaxy. Multi-band, high signal-to-noise ratio, high-resolution imaging of GRB host galaxies is still a luxury, only affordable for the brightest and most nearby galaxies.
Firstly, we find that the surface brightness profile of the host galaxy of GRB 011121 is best fitted by a Sersic law with index – 2.5 and a rather large effective radius ( 7.5 kpc). Together with the F450W - F702W colour image, this suggests that this galaxy is either a disk-system with a rather small bulge (like an Sbc galaxy), or one hosting a central, dust-enshrouded starburst.
At variance with previous studies on GRB host galaxies, we combine stellar population models and Monte Carlo calculations of radiative transfer to reproduce the observed SED. Furthermore, we make use of the morphological information to constrain these models. Plausible solutions meeting all the morphological and/or photometric constraints indicate that the host galaxy of GRB 011121 has a stellar mass of a few to several times , stellar populations with a maximum age ranging from 0.4 to 2 Gyr, and a bolometric luminosity-weighted metallicity in stars (of the disk, in case) ranging from 1 to 29 per cent of the solar value.
In particular, normal star-forming, Sbc-like models provide plausible solutions pointing to a system as massive as 4.9 – , with a bulge-to-total mass ratio equal to 0.15, an age of 1.3 – 1.9 Gyr, and a bolometric luminosity-weighted metallicity in stars of the disk equal to 20 – 29 per cent solar. On the other hand, starburst models provide plausible solutions biased towards a lower stellar mass (3.1 – ), a younger age (0.4 – 2.0 Gyr) and a much lower metallicity (1 – 8 per cent solar). As for the opacity, normal star-forming, Sbc-like models indicate the host galaxy of GRB 011121 as a system with a central opacity in the range 2 – 16, i.e. larger than the central opacity of local disks (0.5 – 2, see Kuchinski et al. kuc98 (1998)). Nevertheless, the attenuation along the line of sight is moderate ( – 0.57 mag) on the scale of the system since the host galaxy of GRB 011121 has a low inclination (18 degrees). On the other hand, starburst models suggest this galaxy to be nearly as opaque ( – 1.5) as local starburst galaxies (with , see Gordon et al. gcw97 (1997)), the attenuation along the line of sight being – 0.76 mag on the scale of the system.
The SFR per unit stellar mass is equal to 0.6 – (starburst) or 0.4 – (normal star-forming galaxy), while the SFR per unit luminosity is equal to 11.9 – or 9.2 – , respectively.
This large (effective radius of 7.5 kpc) but subluminous () galaxy exhibits a specific SFR that is larger than that of the average galaxy at the same redshift (e.g. Bauer et al. bau05 (2005)) but consistent with the values determined for two other blue, low-metallicity, low- GRB host galaxies (i.e. GRB 030329 and GRB 031203, see Gorosabel et al. gor05 (2005), Sollerman et al. sol05 (2005)). Therefore, we conclude that the host galaxies of GRB 011121 and, possibly, GRB 030329 and GRB 031203 are cought at relatively early phases of their star formation histories.
Acknowledgements.
We thank to the anonymous referee for extensive comments that helped to improve the paper. AKY acknowledges support from the International Max-Planck Research School (IMPRS) on Astrophysics. MS acknowledges Sonia Temporin for a lively discussion. EP is grateful to the MPE for hospitality and support. AR acknowledges support and collaboration within the EU RTN Contract HPRN-CT-2002-00294.References
- (1) Bauer, A. E., Drory, N., Hill, G. J., & Feulner, G. 2005, ApJ 621, L89
- (2) Bell, E. F., Papovich, C., Wolf, C. et al. 2005, ApJ 625, 23
- (3) Berger, E., Chary, R., Cowie, L. L. et al. 2006, astro-ph/0603689
- (4) Bloom, J. S., Kulkarni, S. R., Djorgovski, S. G. 2002a, AJ 123, 1111
- (5) Bloom, J. S., Kulkarni, S. R., Price, P. A. et al. 2002b, ApJ 572, L45
- (6) Bolzonella, M., Miralles, J.-M., Pelló, R. 2000, A&A 363, 476
- (7) Bruzual, G., & Charlot, S. 1993, ApJ 405, 538
- (8) Calzetti, D., Armus, L., Bohlin, R. C. et al. 2000, ApJ 533, 682
- (9) Cambrésy, L., Jarrett, T. H., Beichman, C. A. 2005, A&A 435, 131
- (10) Cardelli, J. A., Clayton, G. C., & Mathis, J. S. 1989, ApJ 345, 245
- (11) Chabríer, G. 2003, PASP, 115, 763
- (12) Chary, R., Becklin, E. E., & Armus, L. 2002, ApJ 566, 229
- (13) Christensen, L., Hjorth, J., Gorosabel, J. et al. 2004a, A&A 413, 121
- (14) Christensen, L., Hjorth, J., & Gorosabel, J. 2004b, A&A 425, 913
- (15) Conselice, C. J., Vreeswijk, P. M., Fruchter, A. S. et al. 2005, ApJ 633, 29
- (16) Courty, S., Björnsson, G., Gudmundsson, E. H. 2004, MNRAS 354, 581
- (17) Cox, D. P., Mathews, W. G. 1969, ApJ 155, 859
- (18) Dahlen, T., Mobasher, B., Somerville, R. S. et al. 2005, ApJ 631, 126
- (19) Devillard, N., 2005, Eclipse Users Guide, at URL http://www.eso.org/projects/aot/eclipse/eug/index.html
- (20) Djorgovski, S. & Spinrad, H. 1981, ApJ 251, 417
- (21) Dopita, M. A., Sutherland, R. S. 1996, ApJS 102, 161
- (22) Dutra, C. M., Ahumada, A. V., Clariá, J. J., Bica, E., Barbuy, B. 2003, A&A 408, 287
- (23) Fioc, M., & Rocca-Volmerange, B. 1997, A&A, 326, 950
- (24) Fruchter, A. S. & Hook, R. N. 2002, PASP 114, 144
- (25) Fruchter, A. S., Levan, A. J., Strogler, L. et al. 2006, Nature 441, 463
- (26) Fynbo, J. U., Holland, S., Andersen, M. I. et al. 2000, ApJ 542, 89
- (27) Galama, T. J., Vreeswijk, P. M., van Paradijs, J. et al. 1998, Nature 395, 670
- (28) Garnavich, P. M., Stanek, K. Z., Wyrzykowski, L. et al. 2003, ApJ 582, 924
- (29) Gordon, K.D., Calzetti, D., Witt, A. N. 1997, ApJ 487, 625
- (30) Gordon K. D., Misselt K. A., Witt A. N., Clayton G. C. 2001, ApJ 551, 277
- (31) Gorosabel, J., Klose, S., Christensen, L. et al. 2003a, A&A 409, 123
- (32) Gorosabel, J., Christensen, L., Hjorth, J. et al. 2003b, A&A 400, 127
- (33) Gorosabel, J., Pérez-Ramírez, D., Sollerman, J. et al. 2005, A&A 444, 711
- (34) Greiner, J., Klose, S., Zeh, A. et al. 2001, GCN Circ. 1166
- (35) Greiner, J., Klose, S., Salvato, M. et al. 2003, ApJ 599, 1223
- (36) Hjorth, J., Sollerman, J., Mller, P. et al. 2003, Nature 423, 847
- (37) Kennicutt, R. C. 1998, ApJ 498, 541
- (38) Küpcü Yoldaş, A., Greiner, J. & Perna, R. 2006, A&A accepted, astro-ph/0607195
- (39) Kuchinski L. E., Terndrup, D. M., Gordon, K. D., Witt, A. N. 1998, AJ 115, 1438
- (40) Le Floch, E., Duc, P.-A., Mirabel, I. F. et al. 2003, A&A 400, 127
- (41) Leggett S.K., Golimowski D.A., Fan X., Geballe T.R., Knapp G.R., 2003, in ”Cool stars, stellar systems and the Sun”, Proc. 12th Cambridge workshop, University of Colorado, p. 120
- (42) Malesani, D., Tagliaferri, G., Chincarini, G. et al. 2004, ApJ 609, 5
- (43) Maraston, C. 1998, MNRAS 300, 872
- (44) Maraston, C. 2005, MNRAS 362, 799
- (45) Matheson, T., Garnavich, P. M., Stanek, K. Z. et al. 2003, ApJ 599, 394
- (46) Mathis, J. S. 1970, ApJ 159, 263
- (47) Miller, G. E., & Scalo, J. M. 1979, ApJS 41, 513
- (48) Mirabal, N., Halpern, J. P., Chornock, R. et al. 2003, ApJ 595, 935
- (49) Mirabal, N., Halpern, J. P., An, D., Thorstensen, J. R., Terndrup, D. M. 2006, ApJ 643, 99
- (50) Osterbrock, D. E. 1989, Astrophysics of gaseous nebulae and active galactic nuclei, University Science Books
- (51) Peng, C. Y., Ho, L. C., Impey, C. D., & Rix H-W. 2002, AJ 124, 266
- (52) Perna, R., Raymond, J. & Loeb, A. 2000, ApJ 533, 658
- (53) Persson, S. E., Aaronson, M., Cohen, J. G., Frogel, J. A., Matthews, K. 1983, ApJ 266, 105
- (54) Petrosian, V. 1976, ApJ 209, L1
- (55) Pian, E., Mazzali, P. A., Masetti, N. et al. 2006, astro-ph/0603530
- (56) Pierini D., Gordon K. D., Witt A. N. 2003, in Galaxy Evolution: Theory & Observations, eds. V. Avila-Reese, C. Firmani, C. S. Frenk & C. Allen, RMxAC, 17, p. 200
- (57) Pierini, D., Maraston, C., Bender, R., Witt, A. N. 2004a, MNRAS 347, 1
- (58) Pierini, D., Gordon, K. D., Witt, A. N., Madsen, G. J. 2004b, ApJ 617, 1022
- (59) Piro, L. 2001, GCN Circ. 1147
- (60) Piro, L., De Pasquale, M., Soffitta, P. et al. 2005, ApJ 623, 314
- (61) Price, P. A., Berger, E., Reichart, D. E. et al. 2002, ApJ 572, L51
- (62) Rau, A., Salvato, M., Greiner, J. 2006, A&A 444, 425
- (63) Ravindranath, S., Ferguson, H.C., Conselice, C. et al. 2004, ApJ 604, L9
- (64) Reid, I.N., Kirkpatrick, J.D., Gizis, J.E., et al. 2000, AJ 119, 369
- (65) Salpeter, E. 1955, ApJ, 121, 161
- (66) Schlegel, D., Finkbeiner, D., & Davis, M. 1998, ApJ 500, 525
- (67) Sersic, J. L. 1968, Atlas de Galaxias Australes (Cordoba: Obs. Astron.)
- (68) Sokolov, V. V., Fatkhullin, T. A., Castro-Tirado, A. J. et al. 2001, A&A 372, 438
- (69) Sollerman, J., Östlin, G., Fynbo, J. P. U. et al. 2005, New Astr. 11, 103
- (70) Stanek, K. Z., Matheson, T., Garnavich, P. M. et al. 2003, ApJ 591, L17
- (71) Takagi, T., Arimoto, N., Vansevicius, V. 1999, ApJ 523, 107
- (72) Temporin, S. G. 2001, PhD Thesis, Leopold-Franzens-Universität Innsbruck (Austria)
- (73) Tokunaga A.T., 2000, in Allen’s ”Astrophysical Quantities”, 4th edition, ed. A.N. Cox, Springer-Verlag, NY, p. 143
- (74) Vijh, U., Gordon, K. D., Witt, A. N. 2003, ApJ 587, 533
- (75) Wainwright, C., Berger, E., & Penprase, B. E. 2005, AAS 207, 1908
- (76) Witt, A. N., Gordon, K. D. 2000, ApJ 528, 799
- (77) Wyrzykowski, L., Stanek, K. Z., & Garnavich, P. M. 2001, GCN Circ. 1150