The early and late-time spectral and temporal evolution of GRB 050716
Abstract
We report on a comprehensive set of observations of Gamma Ray Burst 050716, detected by the Swift satellite and subsequently followed-up rapidly in X-ray, optical and near infra-red wavebands. The prompt emission is typical of long-duration bursts, with two peaks in a time interval of seconds (15 – 350 keV). The prompt emission continues at lower flux levels in the X-ray band, where several smaller flares can be seen, on top of a decaying light curve that exhibits an apparent break around 220 seconds post trigger. This temporal break is roughly coincident with a spectral break. The latter can be related to the extrapolated evolution of the break energy in the prompt -ray emission, and is possibly the manifestation of the peak flux break frequency of the internal shock passing through the observing band. A possible 3 change in the X-ray absorption column is also seen during this time. The late-time afterglow behaviour is relatively standard, with an electron distribution power-law index of ; there is no noticable temporal break out to at least 10 days. The broad-band optical/nIR to X-ray spectrum indicates a redshift of for this burst, with a host-galaxy extinction value of that prefers an SMC-like extinction curve.
keywords:
gamma-rays: bursts – radiation mechanisms: non-thermal1 Introduction
One of the main goals of the Swift mission (Gehrels et al., 2004) is to obtain early-time information for gamma-ray burst (GRB) afterglows in X-ray and optical/UV wavelengths, using its rapid and autonomous slewing capability. In addition, longer term monitoring, especially in X-rays, has become more feasible than previously, with a dedicated facility like Swift.
Results of the early observations include the rapid decline of (X-ray) afterglows in the first tens of minutes (Tagliaferri et al., 2005; Goad et al., 2006). An explanation for this behaviour is prompt emission seen from angles further away from our line of sight (Kumar & Panaitescu, 2000). It is likely that emission from the afterglow itself has not risen enough so early to contribute significantly to the measured flux, although there are some exceptions where the (X-ray) flux of the late-time external forward shock is already visible from early times on (eg O’Brien et al., 2006). A thorough understanding of this phenomenon requires detailed descriptions of the light curve (and broad-band spectral) behaviour early on, preferentially with as little as possible interference from other phenomena such as X-ray flares. These X-ray flares are seen in a number of bursts (eg Burrows et al., 2005a), and are now generally interpreted as continuing activity of the inner engine (King et al. 2005; but see also Piro et al. 2005, who interpreted the X-ray rebrightenings as the result of the beginning of the afterglow). Late time monitoring allows the construction of multiple epochs of combined near infra-red/optical/UV and X-ray broad-band spectra (occasionally including radio data), building a more complete picture of GRB afterglows than before.
We present here a full analysis of GRB 050716. This includes the prompt (burst) emission in gamma-rays and early X-ray data, for which we performed time-resolved spectroscopy. We present the late time X-ray behaviour of the afterglow, as well as late time optical observations, which we then combine to form a broad-band spectrum. The observations and their analysis are described in Section 2, and in Section 3 we discuss the results of the observations. In Section 4, we summarise our findings and draw our conclusions.
In the following, errors are used except where noted. The temporal and spectral power law indices and are defined by , and the photon index . All Swift data have been reduced using the Swift software version 2.4 within the HEAsoft software (version 6.0.5), and the corresponding CALDB files.
2 Observations and analysis
GRB 050716 was detected by the Swift Burst Alert Telescope (BAT, Barthelmy et al. 2005) on July 16, 2005, at 12:36:04 UT. All times mentioned in this text are relative to this , except where noted. The spacecraft slewed and started observing in the X-ray and optical/UV bands 96 and 99 seconds later, respectively. The XRT (Burrows et al., 2005b) was able to immediately locate a position for the X-ray afterglow on-board, allowing ground-based telescopes to perform rapid, deep follow-up observations.
2.1 BAT analysis
BAT data were reduced using the BAT software tools within the Swift software package. A PHA to PI energy conversion was performed first with the bateconvert tool, which ensures the conversion is quadratic, rather than linear. We subsequently corrected the data for hot pixels. An additional systematic error correction was applied before spectral fitting. The 15–350 keV light curve is shown in Figure 1.
The light curve shows an increase similar to the typical Fast-Rise Exponential-Decay (FRED) behaviour seen for many other bursts, with a peak around 9 seconds after trigger and the start of the rise of the light curve some 30 seconds earlier. A notable difference is that the rise is not as steep as usually seen for a FRED. A similar FRED light curve is superposed on the tail of the first one, producing a second peak 39 seconds after the trigger. After 80 seconds, most of the prompt emission has disappeared in the 15–350 keV energy band. in this energy band for this burst is seconds. A 4-second binned light curve shows some emission still apparent past 80 seconds, up to 200 seconds, which is mostly found in the lower energy bands.
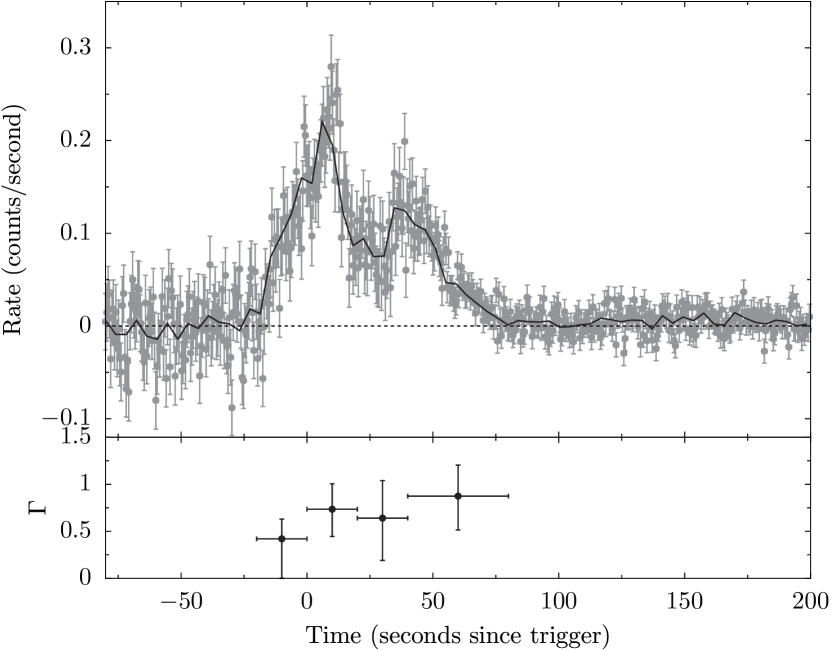
We have subdivided the gamma-ray data into 4 temporal sections and obtained spectral fits for each of these. The spectral shape was fitted with a power law, which results in an acceptable fit. A power law with an exponential cut-off, however, provides a better fit, while a fit with a Band model (Band et al., 1993) does not improve the fit compared to either one of those models. The BAT spectral energy range and low number of energy bins do not allow an accurate determination of the cut-off energy in the cut-off power law model (for the first section, it is in fact a lower limit), but there is an indication that the spectrum softens, with gradually becoming lower, and the photon index changing from about 0.4 to 0.9 during the prompt gamma-ray emission, over a period of seconds.
To verify this spectral evolution, we have fitted the later time sections (C & D) with the model parameters (other than the normalisation) fixed at those obtained from the earlier sections (A & B). By then freeing the parameters and applying an F-test, we find that there is indeed a change in the spectrum at a 99.9% level. Performing a similar test to the first and last sections (A & D), with the results obtained from the fit to the total section (-20 – 80 s), also indicates a changing spectrum at a 99.9% confidence level.
Such softening behaviour of the prompt spectrum has been commonly found before in other bursts (Ford et al., 1995). The results are detailed in Table 1, and include the result of a spectral fit to the whole time span. Figure 1 shows the spectral evolution of the prompt emission between 15 and 150 keV as well.
| Section | Time | cutoff energy | ||
|---|---|---|---|---|
| (sec) | (keV) | |||
| A | -20 – 0 | 0.42 | 221 () | 1.05 |
| B | 0 – 20 | 0.74 | 125 | 0.86 |
| C | 20 – 40 | 0.64 | 105 | 0.86 |
| D | 40 – 80 | 0.87 | 65.6 | 0.95 |
| A – D | -20 – 80 | 0.85 | 150 | 0.76 |
2.2 XRT analysis
XRT data were reduced from level 1 to level 2 with the Swift software task xrtpipeline. Data obtained in Windowed Timing (WT) mode and Photon Counting (PC) mode have been used in all our following analysis. Counts were grouped by 20 per bin for the spectra. WT mode data for the light curve have been grouped by 40 counts per bin, and PC mode light curve data have been grouped by 20 counts per bin.
We have subdivided our analysis into an early-time part and a late-time part. We designate the early-time part as the section of the X-ray afterglow that shows flares (probably related to inner engine activity, see also the discussion below), while the late-time part shows a relatively smooth decay and is presumed to be the afterglow emission from a forward shock. The data for the early part extends up to almost 1ks, with most of the data having been obtained in WT mode. The late-time part starts some 4ks after the trigger and extends out to almost three weeks.
2.3 Early XRT data
WT mode observations started at 103 seconds, and extended up to 516 seconds. After this, the count-rate was low enough for the instrument to automatically switch to PC mode. WT mode data were extracted using a rectangular region with a length of 93″ centred on the source and along the readout direction, with an equally sized region off-source serving as the background determination. PC mode data have been extracted with a 47″ circular aperture instead of the default 71″ because of a contaminating close-by source. The first few 100 seconds of PC mode data are piled-up and we used an annular extraction region, with a 12″ inner radius and a 47″ outer radius. In addition, some bad columns are located near the source centre. We used default grades for WT mode (grades 0 to 2), while we used only grade 0 for the first few 100 seconds of PC-mode observations.
To determine the combined correction factor for the annular aperture and bad column loss, we modelled the PSF using ximage, and calculated the ratio of the integrated response between an unmodified PSF and that masked out by an inner 12″ circle and the bad columns. In the same manner, we correct for the expected loss of using only a 47″ circular aperture. The combined correction factor is 4.47.
2.3.1 Spectral evolution
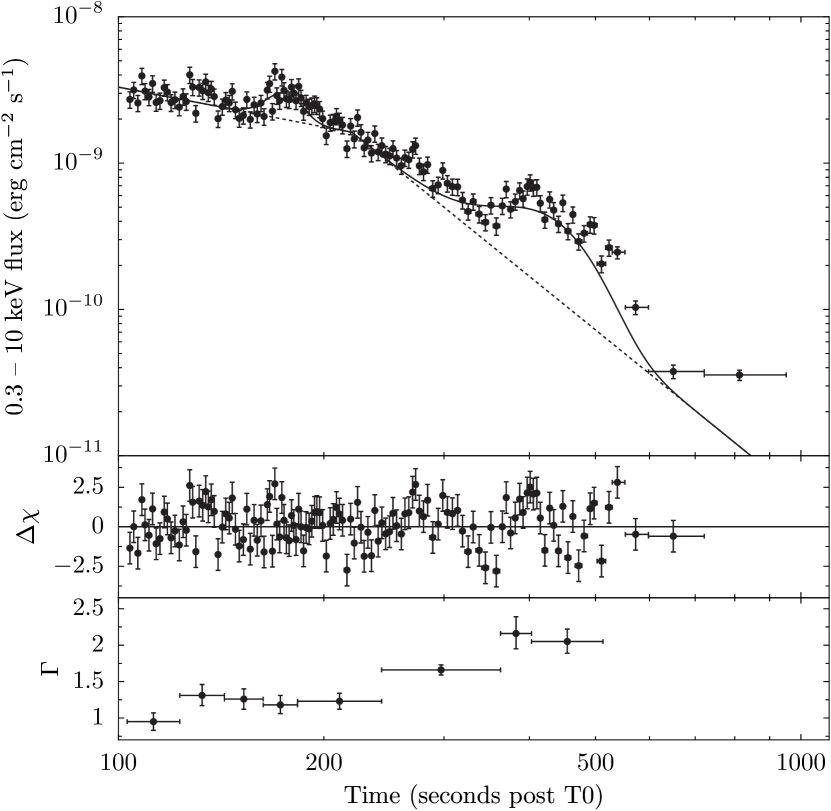
Similar to the BAT observations, we find evidence for a change in the spectral slope over time. Modelling the spectrum with a simple power law, we find that the X-ray spectrum starts with (0.3 – 10 keV), and the slope then evolves to , with a change between 250 and 400 seconds post trigger.
If a break is expected in the X-ray band, a broken power law model for the spectra around this time is preferred. Fits with broken power law models, however, do not show a significant improvement in the fit, and we have therefore used the results from the single power law fits above.
Because there is still some flux in the BAT light curve coincident with the first 100 seconds or so of WT mode data, we have performed a joined fit to the BAT and XRT data between 100 and 200 seconds post trigger. A single power law fit has a of (degrees of freedom (DOF) = 61), but a Band model does a much better job (, DOF = 59), and results in keV, or a peak energy of keV. The spectral indices are and .
Because of the low number of counts in the BAT data, the fit is dominated by the XRT data and the outcome should be taken somewhat cautiously.
2.3.2 Light curve
Since there is a change in the spectral slope halfway through the light curve, we cannot simply fit the count-rate light curve: a flux calibrated light curve has to be used. To derive the count-rate to flux conversion factors, we have used the spectra between 103 and 223 seconds and between 263 and 513 seconds (see also Table 2), which provide the conversion values for the first and last part of the light curve, respectively. For the middle section we have used the average of these values: the rapid change in spectrum does not allow for a good spectral fit. In all our following fits, we have modelled the two most pronounced flares with two simple Gaussians. We also left out the last data point of the light curve: it is likely that this point is the onset of the later-time light curve (see Section 2.4), or possibly even the start of another flare.
A fit to the flux light curve with a single power law results in (DOF = 123), while a broken power law fit gives (DOF = 121). Neither fit is good, but the broken power law does provide a significant improvement. A fit with a smoothly broken power law (either with the sharpness of the break fixed or free) hardly improves this ( for both, DOF = 121 and 120, respectively), and an exponential fit is worse (, DOF = 123).
The broken power law fit results in decay parameters and . The temporal break is found at seconds, just before the time of the spectral break. This coincidence strengthens the suggestion that a broken power law is a reasonable model for the underlying light curve. See Section 3.1 for a more detailed exploration of this break.
The light curve and the spectral evolution are shown in Figure 2. As commonly seen in other early X-ray light curves (eg Burrows et al., 2005a; Nousek et al., 2006; O’Brien et al., 2006), this one exhibits a few flares, which most likely indicates activity of the burst engine itself. This would agree with the possible emission seen in the BAT 15–350 keV range between 100 and 200 seconds. Also visible is the deviation of the underlying decay from a power law.
2.3.3 X-ray absorption change?
For the combined WT-mode data, we find no evidence for excess above that of the estimated Galactic column of (Dickey & Lockman, 1990). Subdividing the WT-mode into a pre- and a post- spectral break section indicates, however, a modest amount of excess absorption at early times, while no excess absorption is measured past the break: and for the total at the two respective epochs. While the observed change in photon index could correlate with this change in , a contour plot (Figure 3) indicates it is likely that the column density did change. Something similar has been seen, for example, in the early (prompt) X-ray emission for GRB 000528 (Frontera et al., 2004), or claimed for GRB 050730 (Starling et al., 2005). An F-test for a model with fixed at the later time value (see also Section 2.4), compared to a model with free to fit, gives a probability of 6.7e-5 for the two models to be consistent. See the second part of Table 2 for more details.

| time | |||
| (sec) | ( cm-2) | ||
| 103 – 123 | 0.509 (12.2/24) | ||
| 123 – 143 | 0.899 (15.3/17) | ||
| 143 – 163 | 0.518 (9.84/19) | ||
| 163 – 183 | 0.698 (16.8/24) | ||
| 183 – 243 | 0.801 (25.6/32) | ||
| 243 – 363 | 1.09 (63.3/58) | ||
| 363 – 403 | 1.12 (13.5/12) | ||
| 403 – 513 | 1.09 (22.9/21) | ||
| variation | |||
| 103 – 223 | 0.890 (111.2/125) | ||
| 263 – 513 | 1.053 (73.69/70) | ||
2.4 Late time XRT observations
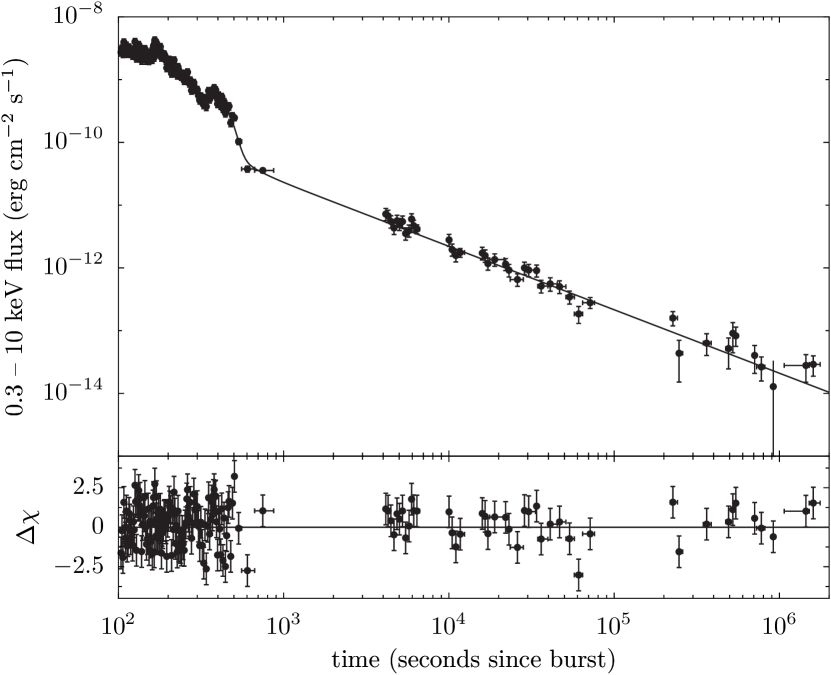
The XRT data after 4ks are not piled-up, and were extracted using a circular aperture of 47″radius and the default grades (0 to 12). The resulting 0.3 – 10 keV light curve follows a smooth power-law decline, with a power-law decay index of 0.99. The full light curve is shown in Figure 4 and includes the early time light curve as well. There is no indication of a shallow part () in the light curve between the steep early decay and the later time decay, as often seen around this time in the light curve (eg Nousek et al., 2006); this may have been missed if it was relatively short and between the early and late-time part. There has been, however, no need to include such a section in our fits to obtain good results. There is also no indication of a late-time break before the light curve is lost in the background noise, up to seconds. A spectral fit to the data between 10ks and 100ks, with fixed at its Galactic value, results in a good fit (), with a photon index of .
2.5 Optical observations
Optical observations were automatically performed with the Swift Ultra Violet and Optical Telescope (UVOT, Roming et al. 2005) in the filters and without a filter. The prompt dissemination of the position also triggered the Faulkes Telescope North (FTN), which began the first observations of its automatic follow-up procedure (Guidorzi et al., 2006) 243 seconds after the Swift trigger. Finally, near infra-red observations at the United Kingdom Infrared Telescope (UKIRT) started 56 minutes post trigger, in the bands, and Gemini NIRI -band observations were obtained 22 hours after . The log of our observations can be found in Table 3.
A faint, fading source was detected in the UKIRT data, just outside the 90% XRT error circle, and identified as the IR afterglow (Tanvir et al., 2005). The IR data also gives the best position for the GRB and its afterglow. This is RA = 22:34:20.73, Dec = +38:41:03.6 (J2000), with an estimated error of 0.4″. This position is derived from the NIRI -band image, calibrated with respect to the 2MASS survey (Skrutskie et al., 2006).
A single power law fit to the three -band points results in a power law decay index of , with . While different from the X-ray decay slope at these times, the paucity of data points does not allow a strong quantification of this difference. A fit with fixed at , however, results in .
We calculated the spectral index by shifting the data to a common epoch using the previously calculated decay index, and correcting for the estimated Galactic extinction (Schlegel et al., 1998). Conversion to flux was performed using the Vega fluxes from Fukugita et al. (1995) for the optical and from Tokunaga & Vacca (2005) for the nIR filters. The fit shows the spectrum to be inconsistent with a power-law spectrum (, but ), indicative of intrinsic reddening. We address this in Section 3.2.
| Start date | days since burst | exposure time | filter | magnitude | telescope/instrument |
| (days UT, July 2005) | (mid-time) | (seconds) | |||
| 16.529991 | 0.01954 | 400 | FTN | ||
| 16.527721 | 0.00306 | 30 | FTN | ||
| 16.527721 | 0.02239 | 540 | FTN | ||
| 16.529911 | 0.02236 | 520 | FTN | ||
| 16.526169 | 0.4315 | 5799 | Swift/UVOT | ||
| 16.527859 | 0.4042 | 5507 | Swift/UVOT | ||
| 16.527697 | 0.3988 | 5477 | Swift/UVOT | ||
| 16.527534 | 0.4416 | 5053 | Swift/UVOT | ||
| 16.527373 | 0.4374 | 5486 | Swift/UVOT | ||
| 16.528044 | 0.4084 | 4383 | Swift/UVOT | ||
| 19.055751 | 2.7699 | 9480 | ’white’ | Swift/UVOT | |
| 16.579109 | 0.05594 | 300 | UKIRT/UFTI | ||
| 16.581678 | 0.05937 | 450 | UKIRT/UFTI | ||
| 16.564178 | 0.04272 | 600 | UKIRT/UFTI | ||
| 16.583727 | 0.06055 | 300 | UKIRT/UFTI | ||
| 17.421337 | 0.9275 | 3600 | Gemini/NIRI |
3 Discussion
| data section | |||
|---|---|---|---|
| X-ray, 103 – 223 seconds | 0.26 0.05 | 0.91 | |
| X-ray, 263 – 513 seconds | 0.86 | 3.78 | |
| X-ray, post 1 hour | 1.01 | 0.99 0.02 | |
| optical, post 1 hour | 2.941 | 0.80 | |
| 1 , therefore no error has been calculated. |
Here we discuss the results obtained above. A short summary of the results is given in Table 4.
3.1 Early emission
GRB 050716 shows characteristics as seen in previous (Swift) bursts, both in its prompt emission and the (early) afterglow (Nousek et al., 2006; O’Brien et al., 2006). The flares, combined with the multiple peaks in the gamma-ray emission, imply several shocks, likely indicative of prolonged engine activity (King et al., 2005). The early X-ray data show a power-law decline, that appears to be unrelated to the later afterglow emission and which is often explained as prompt emission originating from higher latitudes at the emission source, after the emission at smaller angles has faded away.
In the context of this model, we can test the curvature effect (Kumar & Panaitescu, 2000). We used the values pre- and post-break in the XRT data, showing that by this relation, the observed is too shallow and too steep. Zhang et al. (2006) list several possible causes why this relation would not hold. Most important are the effect of using the trigger time instead of the time of the last emission peak (thereby assigning an incorrect zeropoint for a power law fit), and that of superposition of tails of several emission peaks. Both causes could be valid here, since the last significant emission peaks some 40 seconds after the trigger. However, applying such a correction for both effects would effectively produce an ever shallower decay, making the discrepancy larger. Possible causes for being too shallow are the fact that one is looking at a structured jet (Rossi et al., 2002) or when the observed (X-ray) wavelength regime is still below the cooling break. In the latter case, the decay is given by (Zhang et al., 2006). Only the very early section of the X-rays agrees with this relation, with and (Section 2.3.2, Table 2). Post-break, however, the discrepancy is even larger in this scenario. Potentially, both the peak frequency and the cooling break have passed the X-ray band at this time. While this could explain the relatively long spectral transition, there is no direct evidence for this. The discrepancy at later times, for either relation, might more likely be attributed to an increasing influence of the external shock (which likely dominates the last data), and the last flare, which hamper a good fit to the steeper tail of the early light curve.
Evolution of the early emission in the X-ray to gamma-ray energy range has been studied before, eg by Frontera et al. (2000), who looked at the spectral evolution for eight BeppoSAX bursts which had been detected by both the Gamma-Ray Burst Monitor and one of the Wide-Field Cameras. While their findings are similar, an important advantage here is that we have an early X-ray light curve which, with provisions for some flaring, can be fit with a broken power law; the break time of this power law is roughly coincident with the moment passes through the X-ray band. The WFC data generally cover only the very early part of the burst, and any underlying (broken) power law is not visibile. As a result, the evolution could only be deduced from the spectral changes for the BeppoSAX data.
Variable X-ray absorption at early times in the X-ray spectra of GRBs has been noted before in other GRBs (Frontera et al., 2000; Amati et al., 2000; in’t Zand et al., 2001; Starling et al., 2005). Lazzati & Perna (2002) have suggested that ionisation strongly modifies the absorption properties of the surrounding material. For this effect to be noticable, the material should be in a compact region surrounding the GRB ( parsec), and have an initial column density . The change detected here is at redshift 0. For a redshift of (see below), the column density would be (at Solar meticallicity), large enough to fulfill the criterion.
3.2 The late-time light curve and broad-band spectrum
From the combination of the X-ray temporal and spectral index around 5ks, we can infer a electron power law index of within the standard fireball model (eg Mészáros & Rees, 1997; Sari et al., 1999; Chevalier & Li, 1999). This assumes that 1) the afterglow is in the slow-cooling regime (), 2) is below the X-rays and 3) the jet-break has not manifested itself at this time. Other scenarios are easily ruled out by invalidating relations between the two indices (see eg Table 1 in Zhang & Mészáros 2004). There is still a degeneracy between the type of circumburst environment (a constant density medium or a medium with a dependency ( the distance from the centre) such as a stellar wind), which can potentially be resolved by looking at the temporal and spectral indices below ; in our case the only candidate for that is the optical band, which is generally found to be below at these times. To verify this is indeed the case, we compared the X-ray and optical decay indices.
There is a 1.5 difference between the afterglow decay slope in optical and X-rays, which is only marginally significant and does allow to be below optical wavelengths. However, a cooling break between the optical and X-ray waveband makes the picture self-consistent: for an ISM-like, the decay index in optical should be 0.25 lower than that in X-ray, 0.74, which is certainly compatible with obtained from our fit to the -band data. On the other hand, for a wind-like medium, the optical decay index would have to be 0.25 higher than that in X-ray, 1.24, and is therefore incompatible with .
The non power-law behaviour of the near infra-red (nIR) spectrum indicates reddening, which we estimate by examining the broad-band spectral behaviour, by combining the X-ray, optical and nIR data. For this, we have extrapolated the optical and X-ray data to a common epoch: we choose 0.04 days (3.5ks) after trigger, which is central to the optical FTN and nIR UKIRT data, and lies just at the beginning of the late-time X-ray data. We obtained an unabsorbed X-ray flux from the data between 4ks and and 12ks (orbits 2 and 3 combined), which were then extrapolated back to 0.04 days using the power law decay index of . The optical and nIR data were corrected for Galactic extinction and converted to fluxes as before. We then extrapolated to 0.04 days post trigger using our estimate for the optical power law decay index.
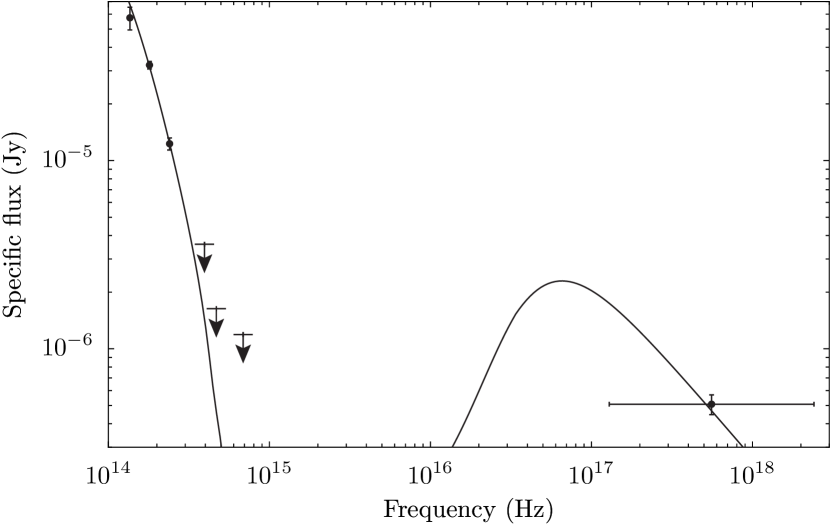
With the scaled fluxes, we constructed the broad-band spectrum of GRB 050716 at 0.04 days (Figure 5). We then tried to fit the data with models available within the standard fireball model, allowing for intrinsic (UV/optical) extinction within the host galaxy and a Lyman cutoff resulting from its redshift. No spectroscopic redshift is known, however. While in principal one can obtain a photometric redshift, there are too many free parameters with the few available data to do this accurately. We have therefore obtained an estimate of the intrinsic extinction for an afterglow positioned at various redshifts (1, 2, 3, …, 7). We have further constrained the power law slope connecting the X-ray and optical/nIR regime to be equal to that obtained by the X-ray spectral fit alone, .
A single power law, absorbed by host-galaxy extinction or intergalactic Lyman extinction, is not able to reproduce the observed broad-band spectrum. A spectral break between optical and X-ray is required, as already found from the fits to the optical and X-ray light curves. With the assumption that this break is indeed the cooling break (with ), we have kept the lower end of this break fixed at a power law index of , and the higher end at ). Reasonable fits are then obtained for redshifts above , with host-galaxy extinction that follows an SMC-like extinction curve ( = 0.5 – 0.7, = 1.5 – 2.1, with lower values for higher redshifts. See Figure 5). This estimate for the host-galaxy is higher than on average found for GRB host galaxies, but not unknown (eg Levan et al., 2006). However, localised extinction or a line-of-sight through an edge-on galaxy could easily explain the somewhat larger than average host extinction.
The reduced is in all cases (for redshifts above 4, it becomes much less than 1), resulting in a lower limit on the redshift of . A Galactic-type extinction curve results in a steeper nIR slope than measured here, and provides a worse fit. The same gradual nIR slope also implies that host-galaxy extinction should be present, and cannot be explained by a Lyman break alone. We further looked at the resultant extinction value for small changes () in our assumed spectral index, which results in changes of about 0.1 magnitude in (the value for , however, also increases considerably doing so). Finally, from our best fit we find that the cannot be located directly below the X-ray frequencies, but is restricted to Hz.
An of with an SMC-like extinction curve would imply an of (Martin et al., 1989) in the host galaxy. Correcting for an assumed SMC-metallicity of Solar and adjusting for the redshift of , this turns out to be not measurable above the estimated Galactic extinction in our data, and indeed, no excess extinction is measured past 300 seconds.
We can obtain a lower limit on the fluence and burst energy from the BAT spectrum, which results in erg cm-2 and erg, respectively. Both values are in the 15 – 150 keV energy range in the observers frame. With a lower limit of , the relation found by Amati (Amati et al., 2002; Amati, 2006) gives keV in the observers frame, while we find keV from the spectral fit (Table 1, after conversion of the cut-off energy to ). Note that the latter uses a power law with an exponential cut-off, not the Band function. Using the previous fit values with a Band function, fixing , and extrapolating outside the BAT spectral range (0.001 – keV), we obtain an estimate of the isotropic energy of , which is almost four times larger than the 15 – 150 keV estimate. Using the Amati relation, this would put the peak energy at keV in the observer frame, assuming . This redshift estimate therefore agrees reasonably well with the results expected from the Amati relation, and indicates is a likely good estimate for the redshift of this burst.
4 Summary
We have presented here a comprehensive analysis of the data available on GRB 050716. The most remarkable feature of the early emission is the spectral change, clearly visible in the X-rays, which can possibly be traced back to the gamma-ray emission. The temporal break coincident with the spectral break points to the peak-flux frequency passing through the X-rays at this time. In addition, the X-ray absorption before the break appears to be higher than after. While this could be an artificial result related to the break, care has been taken to eliminate instrumental effects and the result appears to be significant, possibly indicating ionisiation of surrounding medium.
At later times, our multi-wavelength data of GRB 050716 shows a fairly standard afterglow: the X-ray light curve and spectrum indicate , with no evidence for a break related to the broadening of the jet outflow. The optical data are rather limited, partly because the optical afterglow is relatively faint: host-galaxy extinction with = 1.5 – 2.1 can account for the obtained upper limits. Though no spectroscopic redshift has been obtained for GRB 050716, we obtain a lower limit of , which appears to be in agreement with the Amati relation.
Acknowledgements
We thank the referee for a careful reading of the manuscript, which improved it overall. ER, JPO, KLP, APB, AJL and NRT acknowledge financial support from PPARC. The authors like to thank Simon Vaughan for additional help with parts of the data analysis. This work is also supported at Pennsylvania State University (PSU) by NASA contract NAS5-00136 and NASA grant NNG05GF43G, and at the Osservatorio Astronomico di Brera (OAB) by funding from ASI on grant number I/R/093/04. ”The United Kingdom Infrared Telescope is operated by the Joint Astronomy Centre on behalf of the U.K. Particle Physics and Astronomy Research Council.” This publication makes use of data products from the Two Micron All Sky Survey, which is a joint project of the University of Massachusetts and the Infrared Processing and Analysis Center/California Institute of Technology, funded by the National Aeronautics and Space Administration and the National Science Foundation. We gratefully appreciate the contributions of all members of the Swift team.
References
- Amati (2006) Amati, L., 2006. MNRAS, 372, 233
- Amati et al. (2000) Amati, L., et al., 2000. Science, 290, 953
- Amati et al. (2002) Amati, L., et al., 2002. A&A, 390, 81
- Band et al. (1993) Band, D., et al., 1993. ApJ, 413, 281
- Barthelmy et al. (2005) Barthelmy, S. D., et al., 2005. Space Science Reviews, 120, 143
- Burrows et al. (2005a) Burrows, D. N., et al., 2005a. Science, 309, 1833
- Burrows et al. (2005b) Burrows, D. N., et al., 2005b. Space Science Reviews, 120, 165
- Chevalier & Li (1999) Chevalier, R. A., Li, Z., 1999. ApJ, 520, 29
- Dickey & Lockman (1990) Dickey, J. M., Lockman, F. J., 1990. ARA&A, 28, 215
- Ford et al. (1995) Ford, L. A., et al., 1995. ApJ, 439, 307
- Frontera et al. (2000) Frontera, F., et al., 2000. ApJS, 127, 59
- Frontera et al. (2004) Frontera, F., et al., 2004. ApJ, 614, 301
- Fukugita et al. (1995) Fukugita, M., Shimasaku, K., Ichikawa, T., 1995. PASP, 107, 945
- Gehrels et al. (2004) Gehrels, N., et al., 2004. ApJ, 611, 1005
- Goad et al. (2006) Goad, M. R., et al., 2006. A&A, 449, 89
- Guidorzi et al. (2006) Guidorzi, C., et al., 2006. PASP, 118, 288
- in’t Zand et al. (2001) in’t Zand, J. J. M., et al., 2001. ApJ, 559, 710
- King et al. (2005) King, A., O’Brien, P. T., Goad, M. R., Osborne, J., Olsson, E., Page, K., 2005. ApJ, 630, L113
- Kumar & Panaitescu (2000) Kumar, P., Panaitescu, A., 2000. ApJ, 541, L51
- Lazzati & Perna (2002) Lazzati, D., Perna, R., 2002. MNRAS, 330, 383
- Levan et al. (2006) Levan, A., et al., 2006. ApJ, 647, 471
- Martin et al. (1989) Martin, N., Maurice, E., Lequeux, J., 1989. A&A, 215, 219
- Mészáros & Rees (1997) Mészáros, P., Rees, M. J., 1997. ApJ, 476, 232
- Nousek et al. (2006) Nousek, J. A., et al., 2006. ApJ, 642, 389
- O’Brien et al. (2006) O’Brien, P. T., et al., 2006. ApJ, 647, 1213
- Piro et al. (2005) Piro, L., et al., 2005. ApJ, 623, 314
- Roming et al. (2005) Roming, P. W. A., et al., 2005. Space Science Reviews, 120, 95
- Rossi et al. (2002) Rossi, E., Lazzati, D., Rees, M. J., 2002. MNRAS, 332, 945
- Sari et al. (1999) Sari, R., Piran, T., Halpern, J. P., 1999. ApJ, 519, 17
- Schlegel et al. (1998) Schlegel, D. J., Finkbeiner, D. P., Davis, M., 1998. ApJ, 500, 525
- Skrutskie et al. (2006) Skrutskie, M. F., et al., 2006. AJ, 131, 1163
- Starling et al. (2005) Starling, R. L. C., et al., 2005. A&A, 442, L21
- Tagliaferri et al. (2005) Tagliaferri, G., et al., 2005. Nature, 436, 985
- Tanvir et al. (2005) Tanvir, N., et al., 2005. GCN Circular, 3632, 1
- Tokunaga & Vacca (2005) Tokunaga, A. T., Vacca, W. D., 2005. PASP, 117, 421
- Wilms et al. (2000) Wilms, J., Allen, A., McCray, R., 2000. ApJ, 542, 914
- Zhang et al. (2006) Zhang, B., Fan, Y. Z., Dyks, J., Kobayashi, S., Mészáros, P., Burrows, D. N., Nousek, J. A., Gehrels, N., 2006. ApJ, 642, 354
- Zhang & Mészáros (2004) Zhang, B., Mészáros, P., 2004. International Journal of Modern Physics A, 19, 2385