,
The Physics and Early History of the Intergalactic Medium
Abstract
The intergalactic medium – the cosmic gas that fills the great spaces between the galaxies – is affected by processes ranging from quantum fluctuations in the very early universe to radiative emission from newly-formed stars. This gives the intergalactic medium a dual role as a powerful probe both of fundamental physics and of astrophysics. The heading of fundamental physics includes conditions in the very early universe and cosmological parameters that determine the age of the universe and its matter content. The astrophysics refers to chapters of the long cosmic history of stars and galaxies that are being revealed through the effects of stellar feedback on the cosmic gas. This review describes the physics of the intergalactic medium, focusing on recent theoretical and observational developments in understanding early cosmic history. In particular, the earliest generation of stars is thought to have transformed the universe from darkness to light and to have had an enormous impact on the intergalactic medium. Half a million years after the big bang the universe was filled with atomic hydrogen. As gravity pulled gas clouds together, the first stars ignited and their radiation turned the surrounding atoms back into free electrons and ions. From the observed spectral absorption signatures of the gas between us and distant sources, we know that the process of reionization pervaded most of space a billion years after the big bang, so that only a small fraction of the primordial hydrogen atoms remained between galaxies. Knowing exactly when and how the reionization process happened is a primary goal of cosmologists, because this would tell us when the early stars and black holes formed and in what kinds of galaxies. The distribution and clustering of these galaxies is particularly interesting since it is driven by primordial density fluctuations in the dark matter.
Cosmic reionization is beginning to be understood with the help of theoretical models and computer simulations. Numerical simulations of reionization are computationally challenging, as they require radiative transfer across large cosmological volumes as well as sufficiently high resolution to identify the sources of the ionizing radiation in the infant universe. Rapid progress in our understanding is expected with additional observational input. A wide variety of instruments currently under design – including large-aperture infrared telescopes on the ground or in space (JWST), and low-frequency radio telescope arrays for the detection of red shifted 21-cm radiation – will probe the first sources of light during an epoch in cosmic history that has been largely unexplored so far. The new observations and the challenges for theoretical models and numerical simulations will motivate intense work in this field over the coming decade.
type:
Review Articlepacs:
95.85.Bh, 97.20.Wt, 98.54.Kt, 98.62.Ai, 98.62.Ra, 98.65.Dx, 98.80.Bp, 98.80.Es1 Introduction
1.1 The cosmic history of the intergalactic medium
When we look at our image reflected off a mirror at a distance of 1 meter, we see the way we looked 6.7 nanoseconds ago, the light travel time to the mirror and back. If the mirror is spaced pc away, we will see the way we looked twenty one years ago. Light propagates at a finite speed, and so by observing distant regions, we are able to see what the Universe looked like in the past, a light travel time ago (Figure 1). The statistical homogeneity of the Universe on large scales guarantees that what we see far away is a fair statistical representation of the conditions that were present in in our region of the Universe a long time ago.
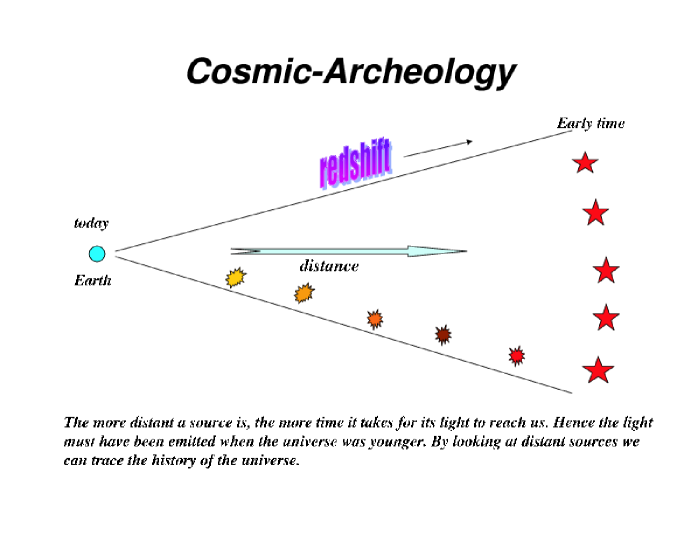
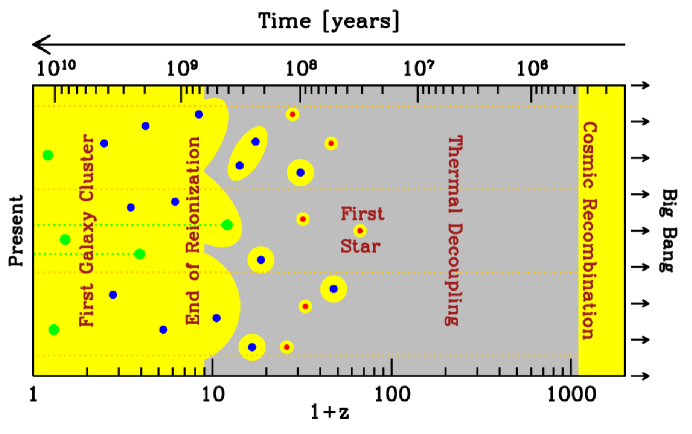
This fortunate situation makes cosmology an empirical science. We do not need to guess how the Universe evolved. Using telescopes we can simply see how it appeared at earlier cosmic times. In principle, this allows the entire 13.7 billion year cosmic history of our universe to be reconstructed by surveying the galaxies and other sources of light to large distances (Figure 2). Since a greater distance means a fainter flux from a source of a fixed luminosity, the observation of the earliest sources of light requires the development of sensitive instruments and poses challenges to observers.
To measure distance, astronomers use the characteristic emission patterns of hydrogen and other chemical elements in the spectrum of each galaxy to measure its cosmological redshift . As the universe expands, photon wavelengths get stretched as well, so that the spectrum we observe today is shifted from the emitted one by a factor of in wavelength. This then implies that the universe has expanded by a factor of in linear dimension since that time, and cosmologists can calculate the corresponding distance and cosmic age for the source galaxy. Large telescopes have allowed astronomers to observe faint galaxies that are so far away that we see them more than ten billion years in the past. Thus, we know directly that galaxies were in existence as early as 850 million years after the Big Bang, at a redshift of (Hu et al2002, White et al2003, Iye et al2006).
We can in principle image the Universe only if it is transparent. Earlier than years after the big bang, the cosmic gas was ionized and the Universe was opaque to Thomson scattering by the free electrons in the dense plasma. Thus, telescopes cannot be used to image the infant Universe at earlier times (or redshifts ). The earliest possible image of the Universe was recorded by the COBE and WMAP satellites (Bennett et al1996; Spergel et al2006), which recorded the temperature distribution of the cosmic microwave background (CMB) on the sky (Figure 3).
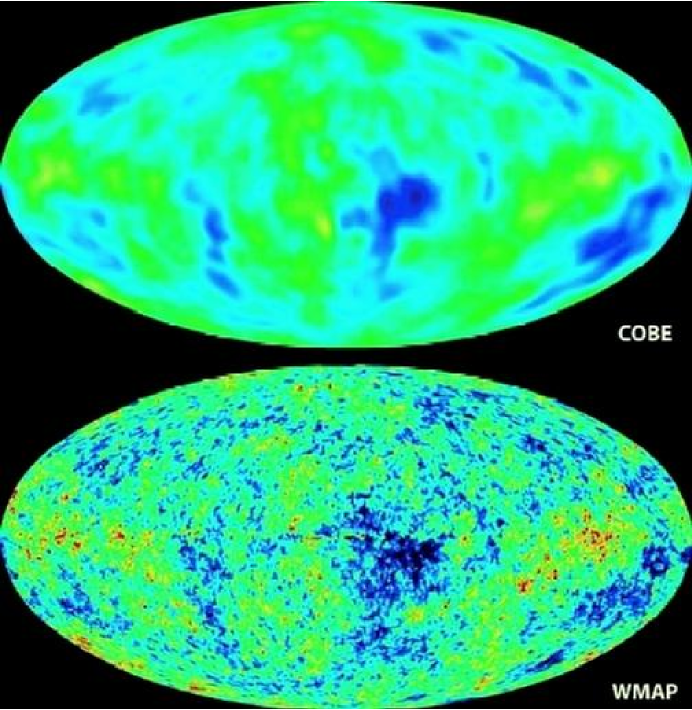
The CMB, the relic radiation from the fiery beginning of the universe, is indeed another major probe of observational cosmology. The universe cools as it expands, so it was initially far denser and hotter than it is today. For hundreds of thousands of years the cosmic gas consisted of a plasma of protons, electrons, and a slight mix of light nuclei, sustained by the intense thermal motion of these particles. Just like the plasma in our own Sun, the ancient cosmic plasma emitted and scattered a strong field of visible and ultraviolet photons. As mentioned above, about years after the Big Bang the temperature of the universe dipped for the first time below a few thousand degrees Kelvin. The protons and electrons were now moving slowly enough that they could attract each other and form hydrogen atoms, in a process known as cosmic recombination. With the scattering of the energetic photons now much reduced, the photons continued traveling in straight lines, mostly undisturbed except that cosmic expansion has redshifted them into the microwave regime. The emission temperature of the observed spectrum of these CMB photons is the same in all directions to one part in (Figure 3), which reveals that conditions were extremely uniform in the early universe.
It was just before the moment of cosmic recombination (when matter started to dominate in energy density over radiation) that gravity entered the scene. Since that time, gravity has amplified the tiny fluctuations in temperature and density observed in the CMB data (Spergel et al2006). Regions that started out slightly denser than average began to contract because the gravitational forces were also slightly stronger than average in these regions. Eventually, after hundreds of millions of years of contraction, galaxies and the stars within them were able to form. This process, however, would have taken too long to explain the abundance of galaxies today, if it involved only the observed cosmic gas. Instead, gravity is strongly enhanced by the presence of dark matter – an unknown substance that makes up the vast majority (84%) of the cosmic density of matter. The motion of stars and gas around the centers of nearby galaxies indicates that each is surrounded by an extended mass of dark matter, and so dynamically-relaxed dark matter concentrations are generally referred to as “halos”.
According to the standard cosmological model, the dark matter is cold (abbreviated as CDM), i.e., it behaves as a collection of collisionless particles that started out at matter domination with negligible thermal velocities and have evolved exclusively under gravitational forces. The model explains how both individual galaxies and the large-scale patterns in their distribution originated from the small initial density fluctuations. On the largest scales, observations of the present galaxy distribution have indeed found the same statistical patterns as seen in the CMB, enhanced as expected by billions of years of gravitational evolution (Eisenstein et al2005; Cole et al2005). On smaller scales, the model describes how regions that were denser than average collapsed due to their enhanced gravity and eventually formed gravitationally-bound halos, first on small spatial scales and later on larger ones. In this hierarchical model of galaxy formation, the small galaxies formed first and then merged or accreted gas to form larger galaxies. At each snapshot of this cosmic evolution, the abundance of collapsed halos, whose masses are dominated by dark matter, can be computed from the initial conditions using numerical simulations. The common understanding of galaxy formation is based on the notion that stars formed out of the gas that cooled and subsequently condensed to high densities in the cores of some of these halos.
Gravity thus explains how some gas is pulled into the deep potential wells within dark matter halos and forms the galaxies. One might naively expect that the gas outside halos would remain mostly undisturbed. However, observations show that it has not remained neutral (i.e., in atomic form) until the present. To learn about diffuse gas pervading the space outside and between galaxies [referred to as the intergalactic medium, or IGM (Field 1972)], astronomers study its absorption signatures in the spectra of distant quasars, the brightest long-lived astronomical objects. Quasars’ great luminosities are believed to be powered by gas accretion onto black holes weighing up to a few billion times the mass of the Sun that are situated in the dense centers of massive galaxies. As the surrounding gas spirals in toward the black hole sink, its excess rotation yields viscous dissipation of heat that makes the gas glow brightly into space, creating a luminous source visible from afar.
The Lyman-alpha (Ly) resonance line of hydrogen at a wavelength of 1216 Å has been widely used to trace hydrogen gas through its absorption of quasar light (Gunn & Peterson 1965). The expansion of the universe gives this tool an important advantage common to all spectral absorption probes. Since the wavelength of every photon is stretched as the universe expands, the rest-frame absorption at 1216 Å by a gas element at redshift is observed today at a wavelength of 1216 Å. The absorptions of the different gas elements along the line of sight are therefore distributed over a broad range of wavelengths, making it possible to measure the distribution of intergalactic hydrogen.
Ly absorption shows that the IGM has been a hot plasma at least from a cosmic age of 850 million years () until today (White et al2003). Thus, the hydrogen must have been ionized for a second time after it became neutral at cosmic recombination. Radiation from the first generations of stars is a plausible source for the ionizing photons that transformed the IGM.
Absorption at the Ly resonance is so strong that it becomes difficult to use as observations approach the reionization epoch where the density of neutral hydrogen becomes high (White et al2003). As described below, cosmologists believe that a different method, termed “21-cm cosmology”, will allow us to measure how the reionization process developed over time and to test theoretical predictions of the properties of the earliest galaxies (Barkana & Loeb 2001; Loeb 2006).
1.2 The expanding universe
The modern physical description of the Universe as a whole can be traced back to Einstein, who argued theoretically for the so-called “cosmological principle”: that the distribution of matter and energy must be homogeneous and isotropic on the largest scales. Today isotropy is well established (see the review by Wu, Lahav, & Rees 1999) for the distribution of faint radio sources, optically-selected galaxies, the X-ray background, and most importantly the cosmic microwave background (hereafter, CMB; see, e.g., Bennett et al1996). The constraints on homogeneity are less strict, but a cosmological model in which the Universe is isotropic but significantly inhomogeneous in spherical shells around our special location, is also excluded (Goodman et al1995).
Cosmological solutions of General Relativity predict the evolution of the cosmic scale factor , defined so that the physical separation between observers at rest (with respect to the general expansion) increases with time in proportion to . A given observer sees a nearby observer at physical distance receding at the Hubble velocity , where the Hubble constant at time is . Light emitted by a source at time with an emitted wavelength is observed at with a redshifted wavelength ; the source redshift , defined from , is related to the cosmic scale factor at the time of emission by , where we set for convenience.
The Einstein field equations of General Relativity yield the Friedmann equation (e.g., Weinberg 1972; Kolb & Turner 1990)
| (1) |
which relates the expansion of the Universe to its matter-energy content. The constant determines the geometry of the universe; it is positive in a closed universe, zero in a flat universe, and negative in an open universe. For each component of the energy density , with an equation of state , the density varies with according to the equation of energy conservation
| (2) |
With the critical density
| (3) |
defined as the density needed for , we define the ratio of the total density to the critical density as
| (4) |
With , , and denoting the present contributions to from matter (including cold dark matter as well as a contribution from baryons), vacuum density (cosmological constant), and radiation, respectively, the Friedmann equation becomes
| (5) |
where we define and to be the present values of and , respectively, and we let
| (6) |
In the particularly simple Einstein-de Sitter model (, ), the scale factor varies as . Even models with non-zero or approach the Einstein-de Sitter behavior at high redshift, i.e. when (as long as can be neglected). In this high- regime the age of the Universe is
| (7) |
Recent observations confine the standard set of cosmological parameters to a relatively narrow range. In particular, we seem to live in a CDM cosmology (with so small that it is usually assumed to equal zero) with an approximately scale-invariant primordial power spectrum of density fluctuations, i.e., where the initial power spectrum is in terms of the wavenumber . Also, the Hubble constant today is written as in terms of , and the overall normalization of the power spectrum is specified in terms of , the root-mean-square amplitude of mass fluctuations in spheres of radius Mpc. For example, the best-fit cosmological parameters matching the three-year WMAP data together with large-scale gravitational lensing observations (Spergel et al2006) are , , , , and . A different cosmological parameter set, also based on the CMB data together with other large-scale structure measurements is (Viel et al2006): , , , , and . The difference between these two parameter sets roughly represents current parameter uncertainties.
2 Atomic physics of the intergalactic medium
2.1 Radiative absorption and scattering
Resonant Ly absorption has thus far proved to be the best probe of the state of the IGM. The optical depth to absorption by a uniform intergalactic medium is (Gunn & Peterson 1965)
where is the Hubble parameter at redshift ; and Å are the oscillator strength and the wavelength of the Ly transition; is the neutral hydrogen density at (assuming primordial abundances); and are the present-day density parameters of all matter and of baryons, respectively; and is the average fraction of neutral hydrogen. In the second equality we have implicitly considered high redshifts.
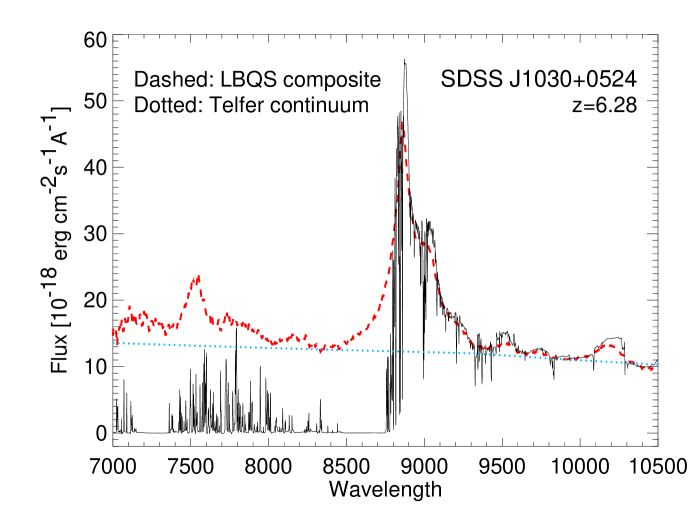
Ly absorption is thus highly sensitive to the presence of even trace amounts of neutral hydrogen. The lack of full absorption in quasar spectra then implies that the IGM has been very highly ionized during much of the history of the universe, from the present out to high redshift. At redshifts approaching six, however, the optical depth increases, and the observed absorption becomes very strong. An example of this is shown in Figure 4, taken from White et al(2003), where an observed quasar spectrum is compared to the unabsorbed expectation for the same quasar. The prominent Ly emission line, which is produced by radiating hot gas near the quasar itself, is centered at a wavelength of 8850Å, which for the redshift (6.28) of this quasar corresponds to a rest-frame 1216Å. Above this wavelength, the original emitted quasar spectrum is seen, since photons emitted with wavelengths higher than 1216Å redshift to higher wavelengths during their journey toward us and never encounter resonance lines of hydrogen atoms. Shorter-wavelength photons, however, redshift until they hit the local 1216Å and are then absorbed by any existing hydrogen atoms. The difference between the unabsorbed expectation and the actual observed spectrum can be used to measure the amount of absorption, and thus to infer the atomic hydrogen density. In this particular quasar, this difference is very large (i.e., the observed flux is near zero) just to the blue of the Ly emission line.
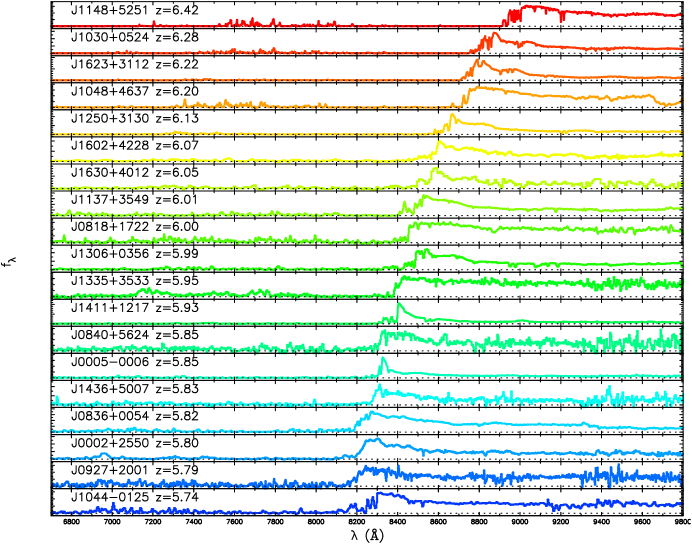
Several quasars beyond show in their spectra such a Gunn-Peterson trough, a blank spectral region at wavelengths shorter than Ly at the quasar redshift (Figure 5). The detection of Gunn-Peterson troughs indicates a rapid change (Fan et al2002, White et al2003, Fan et al2006b) in the neutral content of the IGM at , and hence a rapid change in the intensity of the background ionizing flux. However, even a small atomic hydrogen fraction of would still produce nearly complete Ly absorption. The lower absorption efficiencies of higher Lyman transitions allow much stronger constraints to be derived from observations of Ly and Ly absorption (Fan et al2006a).
While only resonant Ly absorption is important at moderate redshifts, the damping wing of the Ly line plays a significant role when neutral fractions of order unity are considered at . The scattering cross-section of the Ly resonance line by neutral hydrogen is given by (Section 23 of Peebles 1993)
| (9) |
where is the Ly () decay rate, is the oscillator strength, and Å and are the wavelength and frequency of the Ly line. The term in the numerator is responsible for the classical Rayleigh scattering.
While reionization is a quite inhomogeneous process (as we discuss below), we consider here a simple illustrative case of instantaneous reionization. Consider a source at a redshift beyond the redshift of reionization, , and the corresponding scattering optical depth of a uniform, neutral IGM of hydrogen density between the source and the reionization redshift. The optical depth is a function of the observed wavelength ,
| (10) |
where and
| (11) | |||||
At wavelengths longer than Ly at the source, the optical depth obtains a small value; these photons redshift away from the line center along its red wing and never resonate with the line core on their way to the observer. Considering only the regime in which , we may ignore the second term in the denominator of equation (9). This leads to an analytical result for the red damping wing of the Gunn-Peterson trough (Miralda-Escudé 1998).
At wavelengths shorter than 912Å, the photons are absorbed when they photoionize atoms of hydrogen or helium. The detailed absorption cross-sections are summarized in Barkana & Loeb (2001). For rough estimates, the average photoionization cross-section for a mixture of hydrogen and helium with cosmic abundances can be approximated in the range of eV as , where (Miralda-Escudé 2000). Before reionization, in a universe filled with atoms, this yields a very high optical depth for the absorption of ionizing photons with tens of eV’s in energy. The bound-free optical depth only becomes of order unity in the extreme ultraviolet (UV) to soft X-rays, around keV, a regime which is unfortunately difficult to observe due to Galactic absorption (Miralda-Escudé 2000).
2.2 The spin temperature of the 21-cm transition of hydrogen
The ground state of hydrogen exhibits hyperfine splitting involving the spins of the proton and the electron. The state with parallel spins (the triplet state) has a slightly higher energy than the state with anti-parallel spins (the singlet state). The 21-cm line associated with the spin-flip transition from the triplet to the singlet state is often used to detect neutral hydrogen in the local universe. At high redshift, the occurrence of a neutral pre-reionization IGM offers the prospect of detecting the first sources of radiation and probing the reionization era by mapping the 21-cm emission from neutral regions. While its energy density is estimated to be only a correction to that of the CMB, the redshifted 21-cm emission should display angular structure as well as frequency structure due to inhomogeneities in the gas density field (Hogan & Rees 1979; Scott & Rees 1990), hydrogen ionized fraction, and spin temperature (Madau et al1997). Indeed, a full mapping of the distribution of H I as a function of redshift is possible in principle.
The basic physics of the hydrogen spin transition is determined as follows (for a more detailed treatment, see Madau et al. 1997 and Furlanetto et al2006). The ground-state hyperfine levels of hydrogen tend to thermalize with the CMB background, making the IGM unobservable. If other processes shift the hyperfine level populations away from thermal equilibrium, then the gas becomes observable against the CMB in emission or in absorption. The relative occupancy of the spin levels is usually described in terms of the hydrogen spin temperature , defined by
| (12) |
where and refer respectively to the singlet and triplet hyperfine levels in the atomic ground state (), and K is defined by , where the energy of the 21 cm transition is eV, corresponding to a frequency of 1420 MHz. In the presence of the CMB alone, the spin states reach thermal equilibrium with K on a time-scale of yr, where s-1 is the spontaneous decay rate of the hyperfine transition. This time-scale is much shorter than the age of the universe at all redshifts after cosmological recombination.
The IGM is observable when the kinetic temperature of the gas differs from and an effective mechanism couples to . Collisional de-excitation of the triplet level (Purcell & Field 1956) dominates at very high redshift, when the gas density (and thus the collision rate) is still high, but once a significant galaxy population forms in the universe, the spin temperature is affected also by an indirect mechanism that acts through the scattering of Ly photons (Wouthuysen 1952; Field 1958). Continuum UV photons produced by early radiation sources redshift by the Hubble expansion into the local Ly line at a lower redshift. These photons mix the spin states via the Wouthuysen-Field process whereby an atom initially in the state absorbs a Ly photon, and the spontaneous decay which returns it from to can result in a final spin state which is different from the initial one. Since the neutral IGM is highly opaque to resonant scattering, and the Ly photons receive Doppler kicks in each scattering, the shape of the radiation spectrum near Ly is determined by (Field 1959b; but see also Hirata 2006; Chuzhoy & Shapiro 2006), and the resulting spin temperature (assuming ) is then a weighted average of and (Field 1959a):
| (13) |
where is the sum of the radiative and collisional threshold parameters. These parameters are
| (14) |
and
| (15) |
where is the indirect de-excitation rate of the triplet state via the Wouthuysen-Field process, related to the total scattering rate of Ly photons by (Field 1958). Also, the atomic coefficient is tabulated as a function of (Allison & Dalgarno 1969; Zygelman 2005). Collisions can be particularly important in collapsed halos (Iliev et al. 2003). Note that we have adopted the modified notation (i.e., in terms of and ) of Barkana & Loeb (2005b). The coupling of the spin temperature to the gas temperature becomes substantial when ; in particular, defines the thermalization rate (Madau et al. 1997) of :
| (16) |
A patch of neutral hydrogen at the mean density and with a uniform produces (after correcting for stimulated emission) an optical depth at a present-day (observed) wavelength of cm,
| (17) |
assuming a high redshift . The observed spectral intensity relative to the CMB at a frequency is measured by radio astronomers as an effective brightness temperature of blackbody emission at this frequency, defined using the Rayleigh-Jeans limit of the Planck radiation formula: .
The brightness temperature through the IGM is , so the observed differential antenna temperature of this region relative to the CMB is (Madau et al. 1997, with the dependence added)
| (18) | |||||
where is assumed and has been redshifted to redshift zero. Note that the combination that appears in is
| (19) |
In overdense regions, the observed is proportional to the overdensity, and in partially ionized regions is proportional to the neutral fraction. Also, if then the IGM is observed in emission at a level that is independent of . On the other hand, if then the IGM is observed in absorption at a level that is enhanced by a factor of . As a result, a number of cosmic events are expected to leave observable signatures in the redshifted 21-cm line, as discussed below in further detail.
3 Galaxy Formation
3.1 Growth of linear perturbations
As noted in the Introduction, observations of the CMB show that the universe at cosmic recombination (redshift ) was remarkably uniform apart from spatial fluctuations in the energy density and in the gravitational potential of roughly one part in . The primordial inhomogeneities in the density distribution grew over time and eventually led to the formation of galaxies as well as galaxy clusters and large-scale structure. In the early stages of this growth, as long as the density fluctuations on the relevant scales were much smaller than unity, their evolution can be understood with a linear perturbation analysis.
Different physical processes contributed to the perturbation growth (e.g., Peebles 1980; Ma & Bertschinger 1995). In the absence of other influences, gravitational forces due to density perturbations imprinted by inflation would have driven parallel perturbation growth in the dark matter, baryons and photons. However, since the photon sound speed is of order the speed of light, the radiation pressure produced sound waves on a scale of order the horizon and suppressed sub-horizon perturbations in the photon density. The baryonic pressure similarly suppressed perturbations in the gas below the (much smaller) so-called baryonic Jeans scale. Since the formation of hydrogen at recombination had decoupled the cosmic gas from its mechanical drag on the CMB, the baryons subsequently began to fall into the pre-existing gravitational potential wells of the dark matter.
Spatial fluctuations developed in the gas temperature as well as in the gas density. Both the baryons and the dark matter were affected on small scales by the temperature fluctuations through the gas pressure. Compton heating due to scattering of the residual free electrons (constituting a fraction ) with the CMB photons remained effective, keeping the gas temperature fluctuations tied to the photon temperature fluctuations, even for a time after recombination. The growth of linear perturbations can be calculated with the standard CMBFAST code (Seljak & Zaldarriaga 1996; see http://www.cmbfast.org), after a modification to account for the fact that the speed of sound of the gas also fluctuates spatially (Yamamoto et al1997, 1998; Naoz & Barkana 2005).
The magnitude of the fluctuations in the CDM and baryon densities, and in the baryon and photon temperatures, is shown in Figure 6, in terms of the dimensionless combination , where is the corresponding power spectrum of fluctuations in terms of the comoving wavenumber of each Fourier mode. After recombination, two main drivers affect the baryon density and temperature fluctuations, namely, the thermalization with the CMB and the gravitational force that attracts the baryons to the dark matter potential wells. As shown in the figure, the density perturbations in all species grow together on scales where gravity is unopposed, outside the horizon (i.e., at Mpc-1 at ). At the perturbations in the baryon-photon fluid oscillate as acoustic waves on scales of order the sound horizon (), while smaller-scale perturbations in both the photons and baryons are damped by photon diffusion (Silk damping) and the drag of the diffusing photons on the baryons. On sufficiently small scales the power spectra of baryon density and temperature roughly assume the shape of the dark matter fluctuations (except for the gas-pressure cutoff at the very smallest scales), due to the effect of gravitational attraction on the baryon density and of the resulting adiabatic expansion on the gas temperature. After the mechanical coupling of the baryons to the photons ends at , the baryon density perturbations gradually grow towards the dark matter perturbations because of gravity. Similarly, after the thermal coupling ends at , the baryon temperature fluctuations are driven by adiabatic expansion towards a value of 2/3 of the baryon density fluctuations. As the figure shows, by the baryon infall into the dark matter potentials is well advanced and adiabatic expansion is becoming increasingly important in setting the baryon temperature.

3.2 Formation of the First Stars
Theoretical expectations for the properties of the first galaxies (Barkana & Loeb 2001) are based on the standard cosmological model outlined in the Introduction. The formation of the first bound objects marked the central milestone in the transition from the initial simplicity (discussed in the previous subsection) to the present-day complexity. Stars and quasars output copious radiation and also produced explosions and outflows that brought into the IGM chemical products from stellar nucleosynthesis and enhanced magnetic fields. However, the formation of the very first stars, in a universe that had not yet suffered such feedback, remains a well-specified problem for theorists.
Stars form when huge amounts of matter collapse to enormous densities. However, the process can be stopped if the pressure exerted by the hot intergalactic gas prevents outlying gas from falling into dark matter concentrations. As the gas falls into a dark matter halo, it forms shocks due to converging supersonic flows and in the process heats up and can only collapse further by first radiating its energy away. This restricts this process of collapse to very large clumps of dark matter that are around times the mass of the Sun. Inside these clumps, the shocked gas loses energy by emitting radiation from excited molecular hydrogen that formed naturally within the primordial gas mixture of hydrogen and helium (Peebles 1984; Haiman et al1996; Tegmark et al1997).
The first stars are expected to have been quite different from the stars that form today in the Milky Way. The higher pressure within the primordial gas due to the presence of fewer cooling agents suggests that fragmentation only occurred into relatively large units, in which gravity could overcome the pressure. Due to the lack of carbon, nitrogen, and oxygen – elements that would normally dominate the nuclear energy production in modern massive stars – the first stars must have condensed to extremely high densities and temperatures before nuclear reactions were able to heat the gas and balance gravity. These unusually massive stars produced high luminosities of UV photons, but their nuclear fuel was exhausted after 2–3 million years, resulting in a huge supernova or in collapse to a massive black hole. For additional details about the properties of the first stars, see the review by Bromm & Larson (2004).
Advances in computing power have made possible detailed numerical simulations of how the first stars formed (Bromm et al2002; Abel et al2002; Bromm & Loeb 2004; Yoshida et al2006). These simulations begin in the early universe, in which dark matter and gas are distributed uniformly, apart from tiny variations in density and temperature that are statistically distributed according to the patterns observed in the CMB. In order to span the vast range of scales needed to simulate an individual star within a cosmological context, the latest code (Yoshida et al2006) follows a box 0.3 Mpc in length and zooms in repeatedly on the densest part of the first collapsing cloud that is found within the simulated volume. The simulation follows gravity, hydrodynamics, and chemical processes in the primordial gas, and resolves a scale 10 orders of magnitudes smaller than that of the simulated box. While the resolved scale is still three orders of magnitudes larger than the size of the Sun, these simulations have established that the first stars formed within halos containing in total mass, and indicate that the first stars most likely weighed each.
To estimate when the first stars formed we must remember that the first solar mass halos collapsed in regions that happened to have a particularly high density enhancement very early on. There was initially only a small abundance of such regions in the entire universe, so a simulation that is limited to a small volume is unlikely to find such halos until much later. Simulating the entire universe is well beyond the capabilities of current simulations, but analytical models predict that the first observable star in the universe (Figure 7) probably formed 30 million years after the Big Bang (Naoz et al2006), less than a quarter of one percent of the Universe’s total age of 13.7 billion years.
Although stars were extremely rare at first, gravitational collapse increased the abundance of galactic halos and star formation sites with time (Figure 2). Radiation from the first stars is expected to have eventually dissociated all the molecular hydrogen in the intergalactic medium, leading to the domination of a second generation of larger galaxies where the gas cooled via radiative transitions in atomic hydrogen and helium (Haiman et al1997). Atomic cooling occurred in halos of mass above , in which the infalling gas was heated above 10,000 K and became ionized. The first galaxies to form through atomic cooling are expected to have formed around redshift 45 (Naoz et al2006), and such galaxies were likely the main sites of star formation by the time reionization began in earnest. As the IGM was heated above 10,000 K by reionization, its pressure jumped and prevented the gas from accreting into newly forming halos below (Rees 1986). The first Milky-Way-sized halo is predicted to have formed 400 million years after the Big Bang (Naoz et al2006), but such halos have become typical galactic hosts only in the last five billion years.
3.3 Gamma-ray Bursts: Probing the First Stars One Star at a Time
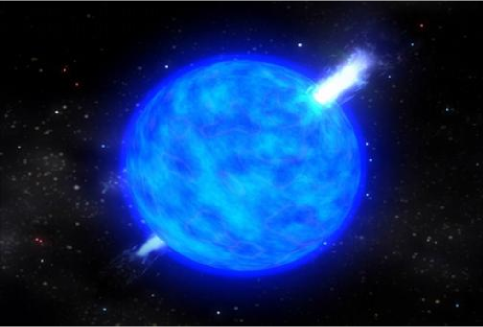
Gamma-Ray Bursts (GRBs) are believed to originate in compact remnants (neutron stars or black holes) of massive stars. Their high luminosities make them detectable out to the edge of the visible Universe (Lamb & Reichart 2000; Ciardi & Loeb 2000). GRBs offer the opportunity to detect the most distant (and hence earliest) population of massive stars, the so-called Population III (or Pop III), one star at a time (Figure 8). In the hierarchical assembly process of halos that are dominated by cold dark matter (CDM), the first galaxies should have had lower masses (and lower stellar luminosities) than their more recent counterparts. Consequently, the characteristic luminosity of galaxies or quasars is expected to decline with increasing redshift (but note that star formation may favor more massive halos due to feedback effects, similar to the ”downsizing” observed at low redshift; e.g., Bundy et al. 2006). GRB afterglows, which already produce a peak flux comparable to that of quasars or starburst galaxies at , are therefore expected to outshine any competing source at the highest redshifts, when the first dwarf galaxies formed in the Universe.
GRBs, the electromagnetically-brightest explosions in the Universe, should be detectable out to redshifts . High-redshift GRBs can be identified through infrared photometry, based on the Ly break induced by absorption of their spectrum at wavelengths below . Follow-up spectroscopy of high-redshift candidates can then be performed on a 10-meter-class telescope. GRB afterglows offer the opportunity to detect stars as well as to probe the metal enrichment level (Furlanetto & Loeb 2003) of the intervening IGM. Recently, the ongoing Swift mission (Gehrels et al2004) has detected a GRB originating at (e.g., Haislip et al2006), thus demonstrating the viability of GRBs as probes of the early Universe.
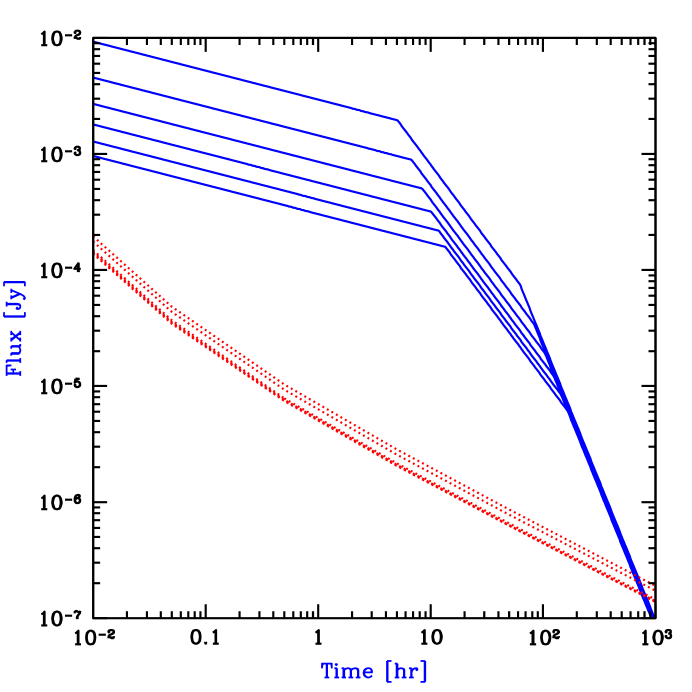
Another advantage of GRBs is that the GRB afterglow flux at a given observed time lag after the -ray trigger is not expected to fade significantly with increasing redshift, since higher redshifts translate to earlier times in the source frame, during which the afterglow is intrinsically brighter (Ciardi & Loeb 2000). For standard afterglow lightcurves and spectra, the increase in the luminosity distance with redshift is compensated by this cosmological time-stretching effect (Barkana & Loeb 2004a) as shown in Figure 9.
GRB afterglows have smooth (broken power-law) continuum spectra unlike quasars which show strong spectral features (such as broad emission lines or the so-called “blue bump”) that complicate the extraction of IGM absorption features. In particular, the continuum extrapolation into the Ly damping wing (see section 2.1) during the epoch of reionization is much more straightforward for the smooth UV spectra of GRB afterglows than for quasars with an underlying broad Ly emission line (Barkana & Loeb 2004a). However, the interpretation may be complicated by the presence of damped Ly absorption by dense neutral hydrogen in the immediate environment of the GRB within its host galaxy. Since GRBs originate from the dense environment of active star formation, such damped absorption is expected and indeed has been seen, including in the most distant GRB at (Totani et al2006).
3.4 The epoch of reionization
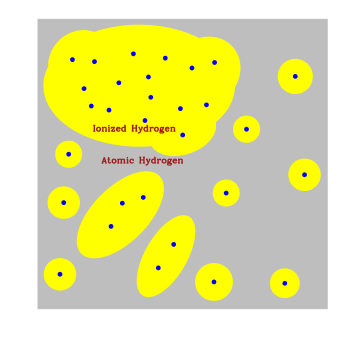
Given the understanding described above of how many galaxies formed at various times, the course of reionization can be determined universe-wide by counting photons from all sources of light (Arons & Wingert 1972; Shapiro & Giroux 1987; Meiksin & Madau 1993; Miralda-Escudé & Ostriker 1990; Tegmark et al1994; Kamionkowski et al1994; Fukugita & Kawasaki 1994; Shapiro et al1994; Haiman & Loeb 1997). Both stars and black holes contribute ionizing photons, but the early universe is dominated by small galaxies which in the local universe have central black holes that are disproportionately small, and indeed quasars are rare above redshift 6 (Fan et al2003). Thus, stars most likely dominated the production of ionizing UV photons during the reionization epoch [although high-redshift galaxies should have also emitted X-rays from accreting black holes and accelerated particles in collisionless shocks (Oh 2001)]. Since most stellar ionizing photons are only slightly more energetic than the 13.6 eV ionization threshold of hydrogen, they are absorbed efficiently once they reach a region with substantial neutral hydrogen (e.g., see section (2.1)). This makes the IGM during reionization a two-phase medium characterized by highly ionized regions separated from neutral regions by sharp ionization fronts (see Figure 10).
We can obtain a first estimate of the requirements of reionization by demanding one stellar ionizing photon for each hydrogen atom in the IGM. If we conservatively assume that stars within the early galaxies were similar to those observed locally, then each star produced ionizing photons per baryon. Star formation is observed today to be an inefficient process, but even if stars in galaxies formed out of only of the available gas, it was still sufficient to accumulate a small fraction (of order ) of the total baryonic mass in the universe into galaxies in order to reionize the entire IGM. More accurate estimates of the actual required fraction account for the formation of some primordial stars (which were massive, efficient ionizers, as discussed above), and for recombinations of hydrogen atoms at high redshifts and in dense regions.
From studies of quasar absorption lines at we know that the IGM is highly ionized a billion years after the big bang (see the review by Fan et al2006b). There are hints, however, that some large neutral hydrogen regions persist at these early times (Wyithe & Loeb 2004a; Mesinger & Haiman 2004; Lidz et al2006) and so this suggests that we may not need to go to much higher redshifts to begin to see the epoch of reionization. (Interestingly, these inferences were deduced long before the latest WMAP results were announced, when it was widely believed that reionization occurred much earlier.) We now know that the universe could not have fully reionized earlier than an age of 300 million years, since WMAP observed the effect of the freshly created plasma at reionization on the large-scale polarization anisotropies of the CMB and this limits the reionization redshift (Spergel et al2006); an earlier reionization, when the universe was denser, would have created a stronger scattering signature that would be inconsistent with the WMAP observations. In any case, the redshift at which reionization ended only constrains the overall cosmic efficiency of ionizing photon production. In comparison, a detailed picture of reionization as it happens will teach us a great deal about the population of young galaxies that produced this cosmic phase transition.
A key point is that the spatial distribution of ionized bubbles is determined by clustered groups of galaxies and not by individual galaxies. At such early times galaxies were strongly clustered even on very large scales (up to tens of Mpc), and these scales therefore dominate the structure of reionization (Barkana & Loeb 2004b). The basic idea is simple (Kaiser 1984). At high redshift, galactic halos are rare and correspond to rare, high density peaks. As an analogy, imagine searching on Earth for mountain peaks above 5000 meters. The 200 such peaks are not at all distributed uniformly but instead are found in a few distinct clusters on top of large mountain ranges. Given the large-scale boost provided by a mountain range, a small-scale crest need only provide a small additional rise in order to become a 5000 meter peak. The same crest, if it formed within a valley, would not come anywhere near 5000 meters in total height. Similarly, in order to find the early galaxies, one must first locate a region with a large-scale density enhancement, and then galaxies will be found there in abundance.
The ionizing radiation emitted from the stars in each galaxy initially produces an isolated ionized bubble. However, in a region dense with galaxies the bubbles quickly overlap into one large bubble, completing reionization in this region while the rest of the universe is still mostly neutral (Figure 10). Most importantly, since the abundance of rare density peaks is very sensitive to small changes in the density threshold, even a large-scale region with a small enhanced density (say, 10% above the mean density of the universe) can have a much larger concentration of galaxies than in other regions (e.g., a 50% enhancement). On the other hand, reionization is harder to achieve in dense regions, since the protons and electrons collide and recombine more often in such regions, and newly-formed hydrogen atoms need to be reionized again by additional ionizing photons. However, the overdense regions end up reionizing first since the number of ionizing sources in these regions is increased so strongly (Barkana & Loeb 2004b). The large-scale topology of reionization is therefore inside out, with underdense voids reionizing only at the very end of reionization, with the help of extra ionizing photons coming in from their surroundings (which have a higher density of galaxies than the voids themselves). This is a key prediction awaiting observational testing.
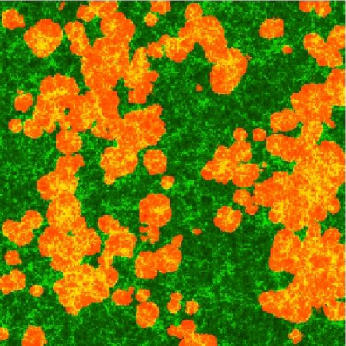
Detailed analytical models that account for large-scale variations in the abundance of galaxies (Furlanetto et al2004) confirm that the typical bubble size starts well below a Mpc early in reionization, as expected for an individual galaxy, rises to 5–10 Mpc during the central phase (i.e., when the universe is half ionized), and then by another factor of 5 towards the end of reionization. These scales are given in comoving units that scale with the expansion of the universe, so that the actual sizes at a redshift were smaller than these numbers by a factor of . Numerical simulations have only recently begun to reach the enormous scales needed to capture this evolution (Ciardi et al2003; Mellema et al2006; Zahn et al2006). Accounting precisely for gravitational evolution on a wide range of scales but still crudely for gas dynamics, star formation, and the radiative transfer of ionizing photons, the simulations confirm that the large-scale topology of reionization is inside out, and that this topology can be used to study the abundance and clustering of the ionizing sources (Figures 10 and 11).
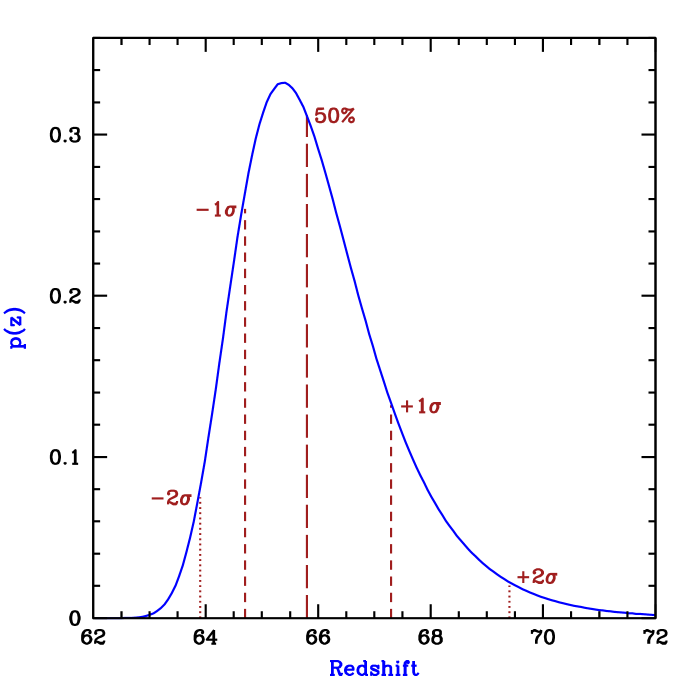
Wyithe & Loeb (2004b) showed that the characteristic size of the ionized bubbles at the end reionization can be calculated based on simple considerations that only depend on the power-spectrum of density fluctuations and the redshift. As the size of an ionized bubble increases, the time it takes a 21-cm photon to traverse it gets longer. At the same time, the variation in the time at which different regions reionize becomes smaller as the regions grow larger. Thus, there is a maximum size above which the photon crossing time is longer than the cosmic variance in ionization time. Regions bigger than this size will be ionized at their near side by the time a 21-cm photon will cross them towards the observer from their far side. They would appear to the observer as one-sided, and hence signal the end of reionization. These “light cone” considerations imply a characteristic size for the ionized bubbles of physical Mpc at (equivalent to 70 Mpc today). This result implies that future radio experiments should be tuned to a characteristic angular scale of tens of arcminutes and have a minimum frequency band-width of 5-10 MHz for an optimal detection of 21-cm brightness fluctuations near the end of reionization.
3.5 Post-reionization suppression of Low Mass Galaxies
After the ionized bubbles overlapped in each region, the ionizing background increased sharply, and the IGM was heated by the ionizing radiation to a temperature K. Due to the substantial increase in the IGM pressure, the smallest mass scale into which the cosmic gas could fragment, the so-called Jeans mass, increased dramatically, changing the minimum mass of forming galaxies (Rees 1986; Efstathiou 1992; Gnedin & Ostriker 1997; Miralda-Escudé & Rees 1998; Benson et al. 2003).
Gas infall depends sensitively on the Jeans mass. When a halo more massive than the Jeans mass begins to form, the gravity of its dark matter overcomes the gas pressure. Even in halos below the Jeans mass, although the gas is initially held up by pressure, once the dark matter collapses its increased gravity pulls in some gas (Haiman et al1996). Thus, the Jeans mass is generally higher than the actual limiting mass for accretion. Before reionization, the IGM is cold and neutral, and the Jeans mass plays a secondary role in limiting galaxy formation compared to cooling. After reionization, the Jeans mass is increased by several orders of magnitude due to the photoionization heating of the IGM, and hence begins to play a dominant role in limiting the formation of stars. Gas infall in a reionized and heated Universe has been investigated in a number of numerical simulations. Thoul & Weinberg (1996) inferred, based on a spherically-symmetric collapse simulation, a reduction of in the collapsed gas mass due to heating, for a halo of circular velocity at , and a complete suppression of infall below . Kitayama & Ikeuchi (2000) also performed spherically-symmetric simulations but included self-shielding of the gas, and found that it lowers the circular velocity thresholds by . Three dimensional numerical simulations (Quinn et al1996; Weinberg et al1997; Navarro & Steinmetz 1997) found a significant suppression of gas infall in even larger halos (), but this was mostly due to a suppression of late infall at .
When a volume of the IGM is ionized by stars, the gas is heated to a temperature K. If quasars dominate the UV background at reionization, their harder photon spectrum leads to K. Including the effects of dark matter, a given temperature results in a linear Jeans mass corresponding to a halo circular velocity of
| (20) |
In halos with a circular velocity well above , the gas fraction in infalling gas equals the universal mean of , but gas infall is suppressed in smaller halos. A simple estimate of the limiting circular velocity, below which halos have essentially no gas infall, is obtained by substituting the virial overdensity for the mean density in the definition of the Jeans mass. The resulting estimate is
| (21) |
This value is in rough agreement with the numerical simulations mentioned before. A more recent study by Dijkstra et al. (2004) indicated that at the high redshifts of gas could nevertheless assemble into halos with circular velocities as low as , even sometime after the establishment of a UV background.
Although the Jeans mass is closely related to the rate of gas infall at a given time, it does not directly yield the total gas residing in halos at a given time. The latter quantity depends on the entire history of gas accretion onto halos, as well as on the merger histories of halos, and an accurate description must involve a time-averaged Jeans mass. The gas content of halos in simulations is well fit by an expression which depends on the filtering mass, a particular time-averaged Jeans mass (Gnedin & Hui 1998; Gnedin 2000).
The reionization process was not perfectly synchronized throughout the Universe. Large-scale regions with a higher density than the mean tended to form galaxies first and reionized earlier than underdense regions. The suppression of low-mass galaxies by reionization is therefore modulated by the fluctuations in the timing of reionization (Babich & Loeb 2005). Inhomogeneous reionization imprints a signature on the power-spectrum of low-mass galaxies. Future high-redshift galaxy surveys hoping to constrain inflationary parameters must properly model the effects of reionization; conversely, they will also place new constraints on the thermal history of the IGM during reionization.
4 21-cm cosmology
4.1 A handy tool for studying cosmic reionization
The prospect of studying reionization by mapping the distribution of atomic hydrogen across the universe using its prominent 21-cm spectral line has motivated several teams to design and construct arrays of low-frequency radio telescopes; the Low Frequency Array (http://www.lofar.org/), the Mileura Wide-Field Array (http://www.haystack.mit.edu/ast/arrays/mwa/site/index.html), the Primeval Structure Telescope (http://arxiv.org/abs/astro-ph/0502029), and ultimately the Square Kilometer Array (http://www.skatelescope.org) will search over the next decade for 21-cm emission or absorption from –15, redshifted and observed today at relatively low frequencies which correspond to wavelengths of 1.5 to 4 meters.
The idea is to use the resonance associated with the hyperfine splitting in the ground state of hydrogen (see Section 2.2). While the CMB spectrum peaks at a wavelength of 2 mm, it provides a still-measurable intensity at meter wavelengths that can be used as the bright background source against which we can see the expected 1% absorption by neutral hydrogen along the line of sight (Hogan & Rees 1979; Scott & Rees 1990). The hydrogen gas produces 21-cm absorption if its spin temperature is colder than the CMB and excess emission if it is hotter. Since the CMB covers the entire sky, a complete three-dimensional map of neutral hydrogen can in principle be made from the sky position of each absorbing gas cloud together with its redshift .
Because the smallest angular size resolvable by a telescope is proportional to the observed wavelength, radio astronomy at wavelengths as large as a meter has remained relatively undeveloped. Producing resolved images even of large sources such as cosmological ionized bubbles requires telescopes which have a kilometer scale. It is much more cost-effective to use a large array of thousands of simple antennas distributed over several kilometers, and to use computers to cross-correlate the measurements of the individual antennas and combine them effectively into a single large telescope. The new experiments are being placed mostly in remote sites, because the cosmic wavelength region overlaps with more mundane terrestrial telecommunications.
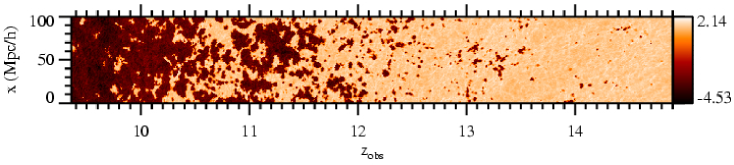
In approaching redshifted 21-cm observations, although the first inkling might be to consider the mean emission signal, the signal is orders of magnitude fainter than foreground synchrotron emission from relativistic electrons in the magnetic field of our own Milky Way (Furlanetto et al2006) as well as other galaxies (Di Matteo et al2002). Thus cosmologists have focused on the expected characteristic variations in , both with position on the sky and especially with frequency, which signifies redshift for the cosmic signal. The synchrotron foreground is expected to have a smooth frequency spectrum, and so it is possible to isolate the cosmological signal by taking the difference in the sky brightness fluctuations at slightly different frequencies (as long as the frequency separation corresponds to the characteristic size of ionized bubbles). The 21-cm brightness temperature depends on the density of neutral hydrogen. As explained in the previous subsection, large-scale patterns in the reionization are driven by spatial variations in the abundance of galaxies; the 21-cm fluctuations reach 5 mK (root mean square) in brightness temperature (Figure 11) on a scale of 10 Mpc (comoving). While detailed maps will be difficult to extract due to the foreground emission, a statistical detection of these fluctuations (through the power spectrum) is expected to be well within the capabilities of the first-generation experiments now being built (Bowman et al2006; McQuinn et al2006). Current work suggests that the key information on the topology and timing of reionization can be extracted statistically.
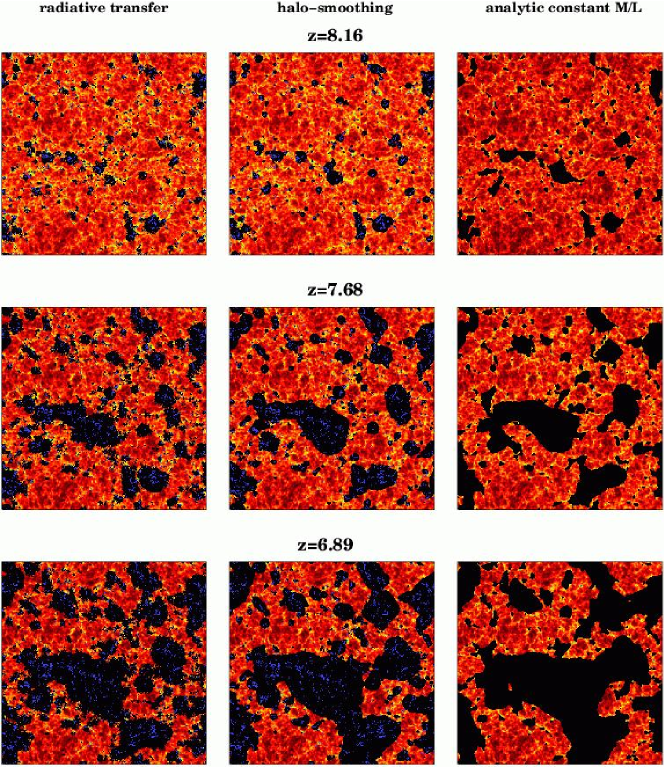
While numerical simulations of reionization are now reaching the cosmological box sizes needed to predict the large-scale topology of the ionized bubbles, they do this at the price of limited small-scale resolution. These simulations cannot yet follow in any detail the formation of individual stars within galaxies, or the feedback that stars produce on the surrounding gas, such as photoheating or the hydrodynamic and chemical impact of supernovae, which blow hot bubbles of gas enriched with the chemical products of stellar nucleosynthesis. Thus, the simulations cannot directly predict whether the stars that form during reionization are similar to the stars in the Milky Way and nearby galaxies or to the primordial behemoths. They also cannot determine whether feedback prevents low-mass dark matter halos from forming stars. Thus, models are needed that make it possible to vary all these astrophysical parameters of the ionizing sources and to study the effect on the 21-cm observations. For example, Furlanetto et al(2004) developed an analytical model that allows the calculation of the one-point bubble distribution, i.e., the probability distribution (at a given redshift) of the size of the ionizing bubble surrounding a random point in space. Zahn et al(2006) have considered numerical schemes that apply the Furlanetto et al(2004) model to either the initial conditions of their simulation or to part of its results (Figure 12). Barkana (2007) has generalized the Furlanetto et al(2004) model and presented an analytical model that calculates the 21-cm two-point correlation (or equivalently, the power spectrum), a quantity of interest for the upcoming 21-cm observations (Figure 13).

The theoretical expectations presented here for reionization and for the 21-cm signal are based on rather large extrapolations from observed galaxies to deduce the properties of much smaller galaxies that formed at an earlier cosmic epoch. Considerable surprises are thus possible, such as an early population of quasars or even unstable exotic particles that emitted ionizing radiation as they decayed. In any case, the forthcoming observational data in 21-cm cosmology should make the next few years a very exciting time.
4.2 Multiple uses in the era before reionization
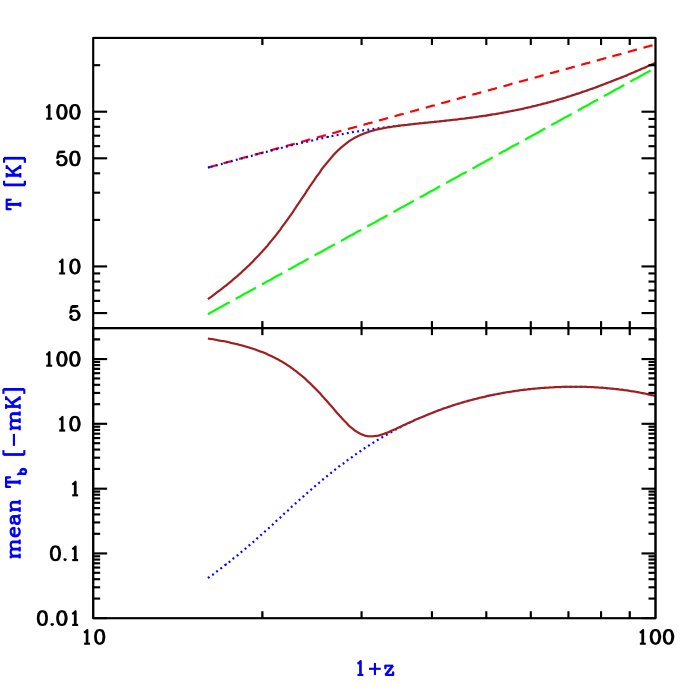
A detection of the cosmological 21-cm signal will open a new window on the universe and likely motivate a second generation of more powerful telescopes. These will be used to obtain three-dimensional maps of atomic hydrogen during reionization as well as statistical power-spectrum measurements at even higher redshifts (using wavelengths at which the foregrounds are brighter and thus more difficult to remove). Since the 21-cm measurements are sensitive to any difference between the hydrogen temperature and the CMB temperature, the potential reach of 21-cm cosmology extends down to a cosmic age of 6 million years , when the IGM first cooled below the CMB temperature (an event referred to as “thermal decoupling”) due to the cosmic expansion. At those very high redshifts, the cosmic gas was so dense that atomic collisions kept the 21-cm spin temperature near that of the gas. As the universe expanded, if there were no stars, CMB scattering would overcome the decreasing collision rate, drive the spin temperature to the CMB temperature, and eliminate the 21-cm signal at (Figure 14). Instead, the formation of a significant galaxy population by redshift 30 is expected to drive the spin temperature back toward the gas temperature through the indirect mechanism of Ly scattering (Wouthuysen 1952; Field 1958; Madau et al. 1997; Chen & Miralda-Escudé 2004). Thus, it should be possible to detect a 21-cm signal throughout this redshift range, in absorption (as long as the gas is cooler than the CMB).
At high redshifts prior to reionization, spatial perturbations in the thermodynamic gas properties are linear and can be predicted precisely (see section 3.1). While early collapsed mini-halos are expected to produce a 21-cm signal (Iliev et al. 2003), in most scenarios this signal is swamped by that from the IGM (Oh & Mack 2003; Furlanetto & Oh 2006). Thus, if the gas is probed with the 21-cm technique then it becomes a promising tool of fundamental, precision cosmology, able to probe the primordial power spectrum of density fluctuations imprinted in the very early universe, perhaps in an era of cosmic inflation. The 21-cm fluctuations can be measured down to the smallest scales where the baryon pressure suppresses gas fluctuations, while the CMB anisotropies are damped on small scales (through the so-called Silk damping). This difference in damping scales can be seen by comparing the baryon-density and photon-temperature power spectra in Figure 6. Since the 21-cm technique is also three-dimensional (while the CMB yields a single sky map), there is a much large potential number of independent modes probed by the 21-cm signal: compared to (Loeb & Zaldarriaga 2004). This larger number should provide a measure of non-Gaussian deviations to a level of , constituting a test of the inflationary origin of the primordial inhomogeneities which are expected to possess non-Gaussian deviations .
An important cross-check on these measurements is possible by measuring the particular form of anisotropy, expected in the 21-cm fluctuations, that is caused by gas motions along the line of sight (Kaiser 1987; Bharadwaj & Ali 2004; Barkana & Loeb 2005a). This anisotropy, expected in any measurement of density that is based on a spectral resonance or on redshift measurements, results from velocity compression. Consider a photon traveling along the line of sight that resonates with absorbing atoms at a particular point. In a uniform, expanding universe, the absorption optical depth encountered by this photon probes only a narrow strip of atoms, since the expansion of the universe makes all other atoms move with a relative velocity that takes them outside the narrow frequency width of the resonance line. If there is a density peak, however, near the resonating position, the increased gravity will reduce the expansion velocities around this point and bring more gas into the resonating velocity width. This effect is sensitive only to the line-of-sight component of the velocity gradient of the gas, and thus causes an observed anisotropy in the power spectrum even when all physical causes of the fluctuations are statistically isotropic. Barkana & Loeb (2005a) showed that this anisotropy is particularly important in the case of 21-cm fluctuations. When all fluctuations are linear, the 21-cm power spectrum takes the form (Barkana & Loeb 2005a)
| (22) |
where in terms of the angle between the wavevector of a given Fourier mode and the line of sight, is the isotropic power spectrum that would result from all sources of 21-cm fluctuations without velocity compression, is the 21-cm power spectrum from gas density fluctuations alone, and is the Fourier transform of the cross-correlation between the density and all sources of 21-cm fluctuations. The three power spectra can also be denoted , , and , according to the power of that multiplies each term. The prediction for these power spectra at high redshift (), neglecting the effects of any stellar radiation, are shown in Figure 15. At these redshifts, the 21-cm fluctuations probe the infall of the baryons into the dark matter potential wells (Barkana & Loeb 2005c). The power spectrum shows remnants of the photon-baryon acoustic oscillations on large scales, and of the baryon pressure suppression on small scales (Naoz & Barkana 2005).

Once stellar radiation becomes significant, many processes can contribute to the 21-cm fluctuations. The contributions include fluctuations in gas density, temperature, ionized fraction, and Ly flux. These processes can be divided into two broad categories: The first, related to “physics”, consists of probes of fundamental, precision cosmology, and the second, related to “astrophysics”, consists of probes of stars. Both categories are interesting – the first for precision measures of cosmological parameters and studies of processes in the early universe, and the second for studies of the properties of the first galaxies. However, the astrophysics depends on complex non-linear processes (collapse of dark matter halos, star formation, supernova feedback), and must be cleanly separated from the physics contribution, in order to allow precision measurements of the latter. As long as all the fluctuations are linear, the anisotropy noted above allows precisely this separation of the physics from the astrophysics of the 21-cm fluctuations (Barkana & Loeb 2005a). In particular, the is independent of the effects of stellar radiation, and is a clean probe of the gas density fluctuations. Once non-linear terms become important, there arises a significant mixing of the different terms; in particular, this occurs on the scale of the ionizing bubbles during reionization (McQuinn et al. 2006).
The 21-cm fluctuations are affected by fluctuations in the Ly flux from stars, a result that yields an indirect method to detect and study the early population of galaxies at (Barkana & Loeb 2005b). The fluctuations are caused by biased inhomogeneities in the density of galaxies, along with Poisson fluctuations in the number of galaxies. Observing the power-spectra of these two sources would probe the number density of the earliest galaxies and the typical mass of their host dark matter halos. Furthermore, the enhanced amplitude of the 21cm fluctuations from the era of Ly coupling improves considerably the practical prospects for their detection. Precise predictions account for the detailed properties of all possible cascades of a hydrogen atom after it absorbs a photon (Hirata 2006; Pritchard & Furlanetto 2006a). Around the same time, X-rays may also start to heat the cosmic gas and to indirectly generate Ly photons, producing strong 21-cm fluctuations due to fluctuations in the X-ray flux (Chuzhoy et al. 2006, Pritchard & Furlanetto 2006b).
5 Future prospects
Understandably, astronomers are eager to start tuning into the cosmic radio channels of 21-cm cosmology. The main challenge involves the Galactic synchrotron foreground which is several orders of magnitude brighter than the cosmic signal (for details, see Furlanetto et al2006). Removal of the bright foreground is made feasible by the fact that it does not change for slight shifts in observed wavelength while the cosmological signal does (because different wavelengths correspond to different slices through the “swiss cheese” structure of the cosmic hydrogen). Primordial hydrogen produced 21-cm absorption against the CMB sky within the redshift interval . Density fluctuations in the gas produced variable absorption, and corresponding 21-cm brightness fluctuations during that epoch. Probing these fluctuations in three dimensions down to small scales would offer the biggest data set about the initial conditions of the universe, with orders of magnitude more bits of information than the CMB anisotropies or galaxy surveys could ever provide. Such information has the potential to bring new clues about small deviations from Gaussianity in the initial density field or about new species of cosmic matter. At redshifts , the cosmic gas is expected to be heated above the CMB temperature by radiation from the first galaxies, and if so its 21-cm brightness would exceed that of the CMB. At this stage, the 21-cm fluctuations are sourced by the first galaxies which produce ionization fraction fluctuations, Ly intensity fluctuations, temperature fluctuations, or direct 21-cm emission from mini-halos.
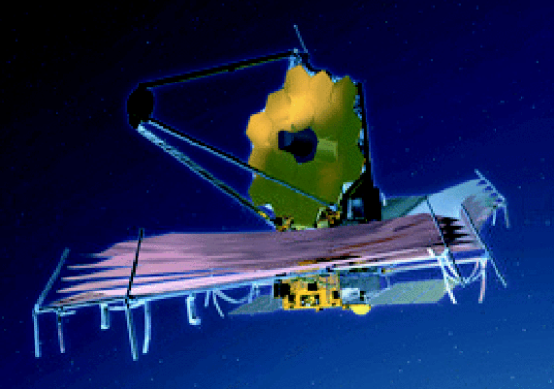

In parallel to the search for redshifted 21-cm fluctuations, future infrared telescopes will search directly for the early galaxies that sculpted the “swiss cheese” topology in the primordial hydrogen. Within the next decade, NASA plans to launch an infrared space telescope (JWST; Figure 16) that will image some of the earliest sources of light (stars and black holes) in the Universe. In parallel, there are several initiatives to construct large-aperture infrared telescopes on the ground with the same goal in mind (see http://www.eso.org/projects/owl/; http://celt.ucolick.org/; http://www.gmto.org/).
The next generation of ground-based telescopes will have an effective diameter of 20-30 meters (Figure 17), and together with the JWST (which will not be affected by the atmosphere) they will be able to image and make spectral studies of the early galaxies at redshifts 10-30. Given that these galaxies also ionized their environments, their locations should correlate with cavities in the 21-cm emission (Wyithe et al2005; Wyithe & Loeb 2006). Within a decade it should be possible to explore the environmental influence of the first galaxies by using both radio and infrared instruments in concert. The challenge is for the theorists to predict this interaction reliably through models and numerical simulations before it is actually observed.
References
References
- [1]
- [2] [] Abel T L, Bryan G L, Norman M L 2002 Science 295 93
- [3]
- [4] [] Allison A C and Dalgarno A 1969 Astrophys. J. 158 423
- [5]
- [6] [] Arons J and Wingert D W 1972 Astrophys. J. 177 1
- [7]
- [8] [] Babich D and Loeb A 2006 Astrophys. J. 640 1
- [9]
- [10] [] Barkana R 2006a Science 313 931
- [11]
- [12] [] Barkana R 2007 Mon. Not. Roy. Astron. Soc. in press
- [13]
- [14] [] Barkana R and Loeb A 2001 Phys. Rep. 349 125
- [15]
- [16] [] Barkana R and Loeb A 2004a Astrophys. J. 601 64
- [17]
- [18] [] Barkana R and Loeb A 2004b Astrophys. J. 609 474
- [19]
- [20] [] Barkana R and Loeb A 2005a Astrophys. J. Lett. 624 L65
- [21]
- [22] [] Barkana R and Loeb A 2005b Astrophys. J. 626 1
- [23]
- [24] [] Barkana R and Loeb A 2005c Mon. Not. Roy. Astron. Soc. Lett. 363 L36
- [25]
- [26] [] Bennett C L et al1996 Astrophys. J. Lett. 464 L1
- [27]
- [28] [] Benson A J, Bower, R G, Frenk C S, Lacey C G, Baugh C M and Cole S 2003 Astrophys. J. 599 38
- [29]
- [30] [] Bharadwaj S and Ali S S 2004 Mon. Not. Roy. Astron. Soc. 352 142
- [31]
- [32] [] Bowman J D, Morales M F and Hewitt J N 2006 Astrophys. J. 638 20
- [33]
- [34] [] Bromm V, Coppi P S, Larson R B 2002 Astrophys. J. 564 23
- [35]
- [36] [] Bromm V and Larson R B 2004 Ann. Rev. Astron. & Astrophys. 42 79
- [37]
- [38] [] Bromm V and Loeb A 2004 New Astronomy 9 353
- [39]
- [40] [] Bundy K et al. 2006 Astrophys. J. 651 120
- [41]
- [42] [] Chen X and Miralda-Escudé J 2004 Astrophys. J. 602 1
- [43]
- [44] [] Chuzhoy L, Alvarez M A and Shapiro P R 2006 Astrophys. J. Lett. 648 L1
- [45]
- [46] [] Chuzhoy L and Shapiro P R 2006 Astrophys. J. 651 1
- [47]
- [48] [] Ciardi B, Ferrara A and White S D M 2003 Mon. Not. Roy. Astron. Soc. 344 L7
- [49]
- [50] [] Ciardi B and Loeb A 2000 Astrophys. J. 540 687
- [51]
- [52] [] Cole S et al2005 Mon. Not. R. Astron. Soc. 362 505
- [53]
- [54] [] Dijkstra M, Haiman Z, Rees M J and Weinberg D H 2004 Astrophys. J. 601 666
- [55]
- [56] [] Di Matteo T, Perna R, Abel T and Rees M J 2002 Astrophys. J. 564 576
- [57]
- [58] [] Efstathiou G 1992 Mon. Not. Roy Astron. Soc. 256 43
- [59]
- [60] [] Eisenstein D J et al2005 Astrophys. J. 633 560
- [61]
- [62] [] Fan X et al2002 Astron. J. 123 1247
- [63]
- [64] [] Fan X et al2003 Astron. J. 125 1649
- [65]
- [66] [] Fan X et al2005 (available at http://www.arxiv.org/abs/astro-ph/0512082)
- [67]
- [68] [] Fan X et al2006a Astron. J. 132 117
- [69]
- [70] [] Fan X, Carilli C L and Keating B 2006b Ann. Rev. Astron. & Astrophys. 44 415
- [71]
- [72] [] Field G B 1958 Proc. IRE 46 240
- [73]
- [74] [] Field G B 1959a Astrophys. J. 129 536
- [75]
- [76] [] Field G B 1959b Astrophys. J. 129 551
- [77]
- [78] [] Field G B 1972 Ann. Rev. Astr. & Astrophys. 10 227
- [79]
- [80] [] Fukugita M and Kawasaki M 1994 Mon. Not. Roy. Astron. Soc. 269 563
- [81]
- [82] [] Furlanetto S R and Loeb A 2003 Astrophys. J. 588 18
- [83]
- [84] [] Furlanetto S R and Oh S P 2006 Astrophys. J. 652 849
- [85]
- [86] [] Furlanetto, S R, Oh, S P and Briggs, F 2006 Phys. Rep. in press (available at http://arxiv.org/abs/astro-ph/0608032)
- [87]
- [88] [] Furlanetto S R, Zaldarriaga M and Hernquist L 2004 Astrophys. J. 613 1
- [89]
- [90] [] Gehrels N et al2004 Astrophys. J. 611 1005
- [91]
- [92] [] Gnedin N Y 2000 Astrophys. J. 542 535
- [93]
- [94] [] Gnedin N Y and Hui L 1998 Mon. Not. Roy Astron. Soc. 296 44
- [95]
- [96] [] Gnedin N Y and Ostriker J P 1997 Astrophys. J. 486 581
- [97]
- [98] [] Goodman J 1995 Phys. Rev. D 52 1821
- [99]
- [100] [] Gunn J E, Peterson B A 1965 Astrophys. J. 142 1633
- [101]
- [102] [] Haiman Z and Loeb A 1997 Astrophys. J. 483 21
- [103]
- [104] [] Haiman Z, Rees M J, Loeb A 1997 Astrophys. J. 476 458; erratum – Astrophys. J. 484 985
- [105]
- [106] [] Haiman Z, Thoul A A and Loeb A 1996 Astrophys. J. 464 52
- [107]
- [108] [] Haislip J et al2006 Nature 440 181
- [109]
- [110] [] Hirata C M 2006 Mon. Not. Roy. Astron. Soc. 367 259
- [111]
- [112] [] Hogan C J and Rees M J 1979 Mon. Not. Roy. Astron. Soc. 188 791
- [113]
- [114] [] Hu E M, Cowie L L, McMahon R G, Capak P, Iwamuro F, Kneib J-P, Maihara T and Motohara K 2002 Astrophys. J. Lett. 568 L75
- [115]
- [116] [] Iliev I T, Scannapieco E, Martel H and Shapiro P R 2003 Mon. Not. Roy. Astron. Soc. 341 81
- [117]
- [118] [] Iye M et al2006 Nature 443 186
- [119]
- [120] [] Kaiser N 1984 Astrophys. J. Lett. 284 L9
- [121]
- [122] [] Kaiser N 1987 Mon. Not. Roy. Astron. Soc. 227 1
- [123]
- [124] [] Kamionkowski M, Spergel D N and Sugiyama N 1994 Astrophys. J. Lett. 426 L57
- [125]
- [126] [] Kitayama T and Ikeuchi S 2000 Astrophys. J. 529 615
- [127]
- [128] [] Kolb E W and Turner M S 1990 The Early Universe (Redwood City, CA: Addison-Wesley)
- [129]
- [130] [] Lamb D Q and Reichart D E 2000 Astrophys. J. 536 1
- [131]
- [132] [] Lidz A, Oh S P and Furlanetto S R 2006 Astrophys. J. Lett. 639 L47
- [133]
- [134] [] Loeb A 2006 First Light, SAAS-Fee lecture notes, to be published by Springer Verlag (available at http://arxiv.org/abs/astro-ph/0603360)
- [135]
- [136] [] Loeb A and Zaldarriaga M 2004 Phys. Rev. Lett. 92 211301
- [137]
- [138] [] Ma C and Bertschinger E 1995 Astrophys. J. 455 7
- [139]
- [140] [] Madau P, Meiksin A and Rees M J 1997 Astrophys. J. 475 429
- [141]
- [142] [] McQuinn M, Zahn O, Zaldarriaga M, Hernquist L and Furlanetto S R 2006 Astrophys. J. in press (available at http://www.arxiv.org/abs/astro-ph/0512263)
- [143]
- [144] [] Meiksin A and Madau P 1993 Astrophys. J. 412 24
- [145]
- [146] [] Mellema G, Iliev I T, Pen U-L and Shapiro P R 2006 Mon. Not. Roy. Astron. Soc. in press (available at http://www.arxiv.org/abs/astro-ph/0603518)
- [147]
- [148] [] Mesinger A and Haiman Z 2004 Astrophys. J. Lett. 611 69
- [149]
- [150] [] Miralda-Escudé J 1998 Astrophys. J. 501 15
- [151]
- [152] [] Miralda-Escudé J 2000 Astrophys. J. Lett. 528 L1
- [153]
- [154] [] Miralda-Escudé J and Ostriker J P 1990 Astrophys. J. 350 1
- [155]
- [156] [] Miralda-Escudé J and Rees M J 1998 Astrophys. J. 497 21
- [157]
- [158] [] Naoz S and Barkana R 2005 Mon. Not. Roy. Astron. Soc. 362 1047
- [159]
- [160] [] Naoz S, Noter S and Barkana R 2006 Mon. Not. Roy. Astron. Soc. Lett. in press (available at http://www.arxiv.org/abs/astro-ph/0604050).
- [161]
- [162] [] Navarro J F and Steinmetz M 1997 Astrophys. J. 478 13
- [163]
- [164] [] Oh S P 2001 Astrophys. J. 553 499
- [165]
- [166] [] Oh S P and Mack K J 2003 Mon. Not. Roy. Astron. Soc. 346 871
- [167]
- [168] [] Peebles P J E 1980 The Large-Scale Structure of the Universe (Princeton: Princeton University Press)
- [169]
- [170] [] Peebles P J E 1984 Astrophys. J. 277 470
- [171]
- [172] [] Peebles P J E 1993 Principles of Physical Cosmology (Princeton: Princeton University Press)
- [173]
- [174] [] Peebles P J E and Yu J T 1970 Astrophys. J. 162 815
- [175]
- [176] [] Pritchard J R and Furlanetto S R 2006a Mon. Not. Roy. Astron. Soc. 367 1057
- [177]
- [178] [] Pritchard J R and Furlanetto S R 2006b Mon. Not. Roy. Astron. Soc. submitted, astro-ph/0607234
- [179]
- [180] [] Purcell E M and Field G B 1956 Astrophys. J. 124 542
- [181]
- [182] [] Quinn T, Katz N and Efstathiou G 1996 Mon. Not. Roy Astron. Soc. Lett. 278 49
- [183]
- [184] [] Rees M J 1986 Mon. Not. Roy. Astron. Soc. 222 27
- [185]
- [186] [] Rees M J and Sciama D W 1968 Nature 217 511
- [187]
- [188] [] Sachs R K and Wolfe A M 1967 Astrophys. J. 147 73
- [189]
- [190] [] Scott D and Rees M J 1990 Mon. Not. Roy. Astron. Soc. 247 510
- [191]
- [192] [] Seljak U and Zaldarriaga M 1996 Astrophys. J. 469 437
- [193]
- [194] [] Shapiro P R, Giroux M L 1987 Astrophys. J. Lett. 321 L107
- [195]
- [196] [] Shapiro P R, Giroux M L and Babul A 1994, Astrophys. J. 427 25
- [197]
- [198] [] Silk J 1968 Astrophys. J. 151 459
- [199]
- [200] [] Spergel D N et al2006 Astrophys. J. in press (available at http://www.arxiv.org/abs/astro-ph/0603449)
- [201]
- [202] [] Sunyaev R A and Zeldovich Y B 1970 APSS 7 3
- [203]
- [204] [] Tegmark M et al1997 Astrophys. J. 474 1
- [205]
- [206] [] Tegmark M, Silk J and Blanchard A 1994 Astrophys. J. 420 484
- [207]
- [208] [] Thoul A A and Weinberg D H 1996 Astrophys. J. 465 608
- [209]
- [210] [] Totani T, Kawai N, Kosugi G, Aoki K, Yamada T, Iye M, Ohta K and Hattori T 2006 Pub. Astron. Soc. Japan 58 485
- [211]
- [212] [] Viel M, Haehnelt M G and Lewis A 2006 Mon. Not. Roy. Astron. Soc. Lett. 370 L51
- [213]
- [214] [] Weinberg D H, Hernquist L and Katz N 1997 Astrophys. J. 477 8
- [215]
- [216] [] Weinberg S 1972 Gravitation and Cosmology (New York: Wiley)
- [217]
- [218] [] White R L, Becker R H, Fan X, Strauss M A 2003 Astron. J. 126 1
- [219]
- [220] [] Wouthuysen S A 1952 Astron. J. 57 31
- [221]
- [222] [] Wu K K S, Lahav O and Rees M J 1999 Nature 397 225
- [223]
- [224] [] Wyithe J S B and Loeb A 2004a Nature 427 815
- [225]
- [226] [] Wyithe J S B and Loeb A 2004b Nature 432 194
- [227]
- [228] [] Wyithe J S B and Loeb A 2006 Mon. Not. Roy. Astron. Soc submitted (available at http://arxiv.org/abs/astro-ph/0609734)
- [229]
- [230] [] Wyithe J S B, Loeb A and Barnes D G 2005 Astrophys. J. 634 715
- [231]
- [232] [] Yamamoto K, Sugiyama N and Sato H 1997 Phys. Rev. D 56 7566
- [233]
- [234] [] Yamamoto K, Sugiyama N and Sato H 1998 Astrophys. J. 501 442
- [235]
- [236] [] Yoshida N, Omukai K, Hernquist L, and Abel T 2006 Astrophys. J. in press (available at http://www.arxiv.org/abs/astro-ph/0606106).
- [237]
- [238] [] Zahn O, Lidz A, McQuinn M, Dutta S, Hernquist L, Zaldarriaga M and Furlanetto S R 2006 Astrophys. J. in press (available at http://www.arxiv.org/abs/astro-ph/0604177)
- [239]
- [240] [] Zhang W, Woosley S and MacFadyen A I 2003, Astrophys. J. 586 356
- [241]
- [242] [] Zygelman B 2005 Astrophys. J. 622 1356
- [243]