A Near-Infrared Study of 2MASS Bars in Local Galaxies: An Anchor for High Redshift Studies
Abstract
We have measured the fraction of bars in nearby spiral galaxies using near-infrared , , and images of 151 spiral galaxies from 2MASS. This local sample provides an anchor for the study of the evolution of the bar fraction and bar properties with redshift. We identify bars by analyzing the full two-dimensional light distribution and requiring a combined ellipticity and position angle signature. The combined bar signature is found in 59% of the galaxies. The bar fraction increases to 67% when we include “candidate” bars, where only the ellipticity signature is present. We also measure the change in the bar fraction as a function of bar size; the bar fraction drops to 36% for bars with a semi-major axis larger than 4 kpc. We find that infrared bars typically extend to one-third of the galactic disk, with a deprojected relative size of . Early-type spirals host significantly larger bars, consistent with earlier studies. The is two times larger in early-types than in late-types. The typical bar axial ratio (b/a) is 0.5, with a weak trend of higher axial ratios for larger bars.
Subject headings:
galaxies: spiral galaxies: structure infrared: galaxies methods: data analysis technique: photometric1. INTRODUCTION
Bars play a central role in the evolution of galaxies. The non-axisymmetry of the bar induces large-scale streaming motions in the stars and the gas (Athanassoula, 1992a; Piner, Stone & Teuben, 1995; Teuben, 1995). Unlike stars, the gas is collisional and dissipative, losing angular momentum and flowing inwards down the bar dust lanes (Combes & Gerin, 1985; Athanassoula, 1992b; Regan, Vogel & Teuben, 1997; Regan, Sheth & Vogel, 1999; Sheth et al., 2000, 2002, 2005). This inflow leads to dramatic changes in the host galaxy such as accumulation of molecular gas in the central kiloparsec (Sakamoto et al., 1999; Sheth et al., 2005), smoothing of the chemical abundance gradient (Martin & Roy, 1994), inducement of circumnuclear star formation (see Ho, Filippenko, & Sargent 1997a, b and references therein) and (possibly) the formation of bulges and pseudo-bulges (Norman, Sellwood, & Hasan, 1996; Kormendy & Kennicutt, 2004; Sheth et al., 2005), fueling of active galactic nuclei (Shlosman, Frank, & Begelman, 1989), and perhaps the destruction of the bar itself (Norman, Sellwood, & Hasan, 1996; Das et al., 2003). Understanding the bar fraction and bar properties is therefore critical to understanding the evolution of spiral galaxies.
As early as 1963, using photographic plates that are sensitive to blue light, de Vaucouleurs (de Vaucouleurs, 1963) found that 35% of all nearby spiral galaxies (S0/a-Sd) are strongly barred (SB). An additional 29% were classified as “intermediately”-barred (SAB) spirals. With the advent of near-infared (NIR) detectors, previously undiscovered bars were seen at infrared wavelengths (e.g., Hackwell & Schweizer 1983; Scoville et al. 1988; Thronson et al. 1989; Mulchaey & Regan 1997; Seigar & James 1998; Jarrett et al. 2003); these were typically small nuclear bars at the centers of nearby spirals, where dust obscuration can be high and variable. In hindsight these discoveries are not surprising since bars are stellar structures that are best seen at longer wavelengths, where the veiling effects of dust extinction and star formation are minimized compared to optical wavelengths. The NIR light is dominated by old stars which constitute the bulk of the stellar mass; the NIR, therefore, is a more reliable tracer of a galaxy’s gravitational potential than optical light. Although large format NIR cameras have become more common over the last decade, there are only a few large and homogeneous NIR surveys of nearby spirals, and of these, only the Ohio State University Bright Spiral Galaxy Survey (OSUBSGS; Eskridge et al. 2002), with 205 spirals with T , B and D has been used to examine the fraction of bars in the H-band (Eskridge et al. 2000; Whyte et al. 2002; Laurikainen, Salo & Buta 2004, hereafter E2000, W2002 and LSB04, respectively). Several other studies have examined the bar fraction in the optical and NIR between active and non-active galaxies, to determine the role of bars in feeding AGN (Mulchaey & Regan, 1997; Knapen et al., 2000; Laine et al., 2002; Laurikainen, Salo & Buta, 2004).
The advent of large, deep extragalactic surveys such as COSMOS, GOODS, and GEMS (Scoville et al., 2006; Dickinson & Giavalisco, 2002; Rix et al., 2004) has triggered studies that explore the evolution of the bar fraction with redshift (Sheth et al., 2003, 2004; Elmegreen et al., 2004; Jogee et al., 2004). A prerequisite for evaluating the results of these high redshift studies is a well-determined bar fraction in the local universe.
Using H-band imaging of 186 and 113 nearby galaxies respectively, E2000 and W2002 classified of the spirals as barred. E2000 relied on visual inspection to identify bars, like earlier optical studies (e.g., Third Reference Catalog of Bright Galaxies, de Vaucouleurs et al. 1991, hereafter, RC3), while W2002 relied on an automated method of measuring a bar based on the difference in the axial ratio and position angles of a best-fit ellipse to one interior and one exterior isophote; this method is a refinement of the bar identification method used by Abraham et al. (1996).
Although the eye is an excellent classification tool, visual inspection of images is unreliable for poor quality and low signal-to-noise data. Especially in the context of high redshift galaxies, visual classification quickly becomes difficult in view of the significant decline in the spatial resolution (e.g. Figure 3 of Sheth et al. 2003) or decreased signal to noise (due to the cosmological surface brightness dimming) with increasing redshift. Classification by eye is also tedious for large data sets and is subjective when comparing datasets of varying quality. In such cases an automated method for bar identification is more useful as it has the advantage of reproducibility and can be applied to large datasets. Moreover, an automated algorithm that uses the full two-dimensional light distribution is likely more robust than one that relies on a small number of isophotes.
An accurate measurement of the bar fraction also depends on a variety of selection biases such as surface brightness limits, signal to noise ratio, inclination and spatial resolution (Sheth et al., 2003, 2004). The measurement of the bar fraction is particularly sensitive to the spatial resolution of the data. Sheth et al. (2003) show how the bar fraction measured in the Hubble Deep Field North using the coarse NICMOS data is comparable to the local RC3 fraction when the bar size is taken into account. It is, therefore, critical to have accurate measurement of the bar size distribution.
A number of studies have looked at the bar size distribution of optically-selected (i.e. RC3 SB/SAB) local bars (Kormendy, 1979; Elmegreen & Elmegreen, 1985; Martin, 1995; Erwin, 2005). These optical studies have found that bars in early-type spirals tend to be longer than those found in late-types. Laine et al. (2002) and LSB04 have compared properties of H-band selected bars in active and non-active galaxies.
In this paper we present a detailed NIR morphological analysis of the local spiral population imaged by the Two Micron All Sky Survey (Skrutskie et al., 2006) Large Galaxy Atlas (hereafter, 2MASS LGA, Jarrett et al. 2003). We identify bars and characterize their sizes and ellipticities with a widely-used technique of fitting ellipses (e.g., Wozniak et al. 1991; Regan & Elmegreen 1997; Zheng et al. 2005 in the optical; Knapen et al. 2000, Laine et al. 2002, Laurikainen, Salo & Rautiainen 2002 and Sheth et al. 2000, 2002, 2003 in the NIR) to the full two-dimensional light distribution of the spirals in our 2MASS sample.
2MASS is one of the largest and most homogeneous NIR surveys. It allows us to measure the local bar fraction and characterize the bar properties and their relationship to their disks. This work provides a local anchor for studies of the evolution of the bar fraction with redshift.
2. OBSERVATIONS and ANALYSIS
2.1. Defining a Local Sample
2MASS imaged the entire sky in the NIR bands, (m), (m), and (m) down to a limiting sensitivity of 21.6, 20.6 and 20.0 mag/arcsec2 (), respectively, with a typical angular resolution of . From the image data set, which contains galaxies with mag, Jarrett et al. (2003) assembled the LGA. The LGA consists of individual and co-added (to improve signal-to-noise) , and band images of over five hundred large galaxies imaged in the 2MASS, with sizes ranging from to .
In the absence of an established NIR morphological classification system, we used the optical RC3 morphological classification for our sample selection. We selected all 339 LGA galaxies with good signal-to-noise that were identified as spirals (S0/a-Sd) in the RC3. From these, we excluded 165 highly inclined galaxies (, where inclination is derived from the disk axial ratio). We excluded galaxies classified as irregulars, mergers or otherwise strongly interacting. We also limited our sample to the 151 closest galaxies ( Mpc) so that we may easily resolve potential bars. Distances to these spirals were taken from the NASA Extragalactic Database (NED). The median distance of our sample of galaxies is 18 Mpc. There is an inherent bias towards large, massive and bright galaxies in 2MASS because it is relatively shallow (see Figure 1). The list of galaxies selected and their global properties are listed in Table 1.
2.2. The Bar Signature
We detect the presence of a bar within a galaxy disk from the ellipticity and position angle (hereafter, PA) profiles traced by the galaxy isophotes. We applied the IRAF task (Jedrzejewski, 1987) on the combined LGA images for all the galaxies in our sample, with a step size of (the 2MASS angular resolution). The transition from the (round) bulge-dominated center to the disk is typically characterized by an increase in ellipticity, . For a disk or a bar, the PA remains constant unless there are spiral arms, which force the PA to change continuously. In absence of these arms, the ellipticity increases monotonically at a constant PA within the bar region. At the end of the bar, the ellipticity drops abruptly and the PA changes sharply as the isophotes transition from the bar into the disk. An example of what we term an ideal bar signature is shown in Figure 2 for NGC 1300. In this case, within the bar region, the bar isophotes show a continuous increase in ellipticity, maintaining a constant PA. At the end of the bar, the ellipticity of the image isophotes decreases and the PA changes sharply, denoting the difference between the bar and the disk PA. Cases in which the bar and the disk have the same PA are discussed below.
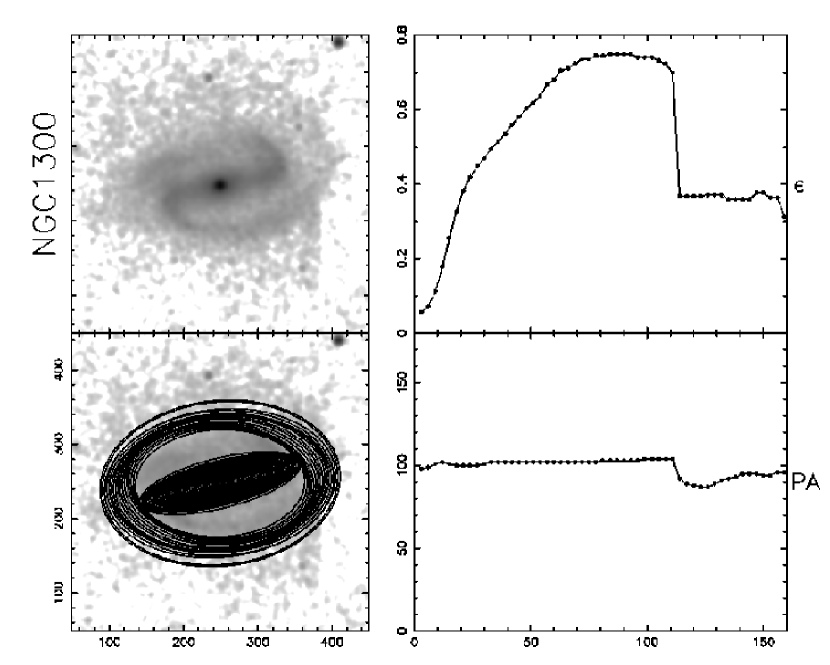
The change in ellipticity and the change in PA are moderated by the spiral arms that may retard the corresponding PA drop to occur further out in the disk, outside the bar region. For this reason we choose the semi-major axis (sma) of the isophote maximum ellipticity () to be the size of the bar, . Due to spiral arms, the ellipticity peak is often broadened into a “flat-top” (see Figure 2). To account for the uncertainty in defining which sma corresponds to the maximum ellipticity, we characterize the error in the bar size measurement by the sma range encompassing the tip of the ellipticity peak in the bar signature, over which , where we chose .
In order to automate our bar identification method, we required a bar to have a projected ellipticity, , greater than , and the end of the bar to be marked by a change in ellipticity, , with an accompanying change in the position angle, PA . We do not identify a bar signature in the first three points of the ellipticity profile, which corresponds to 3 times the PSF FWHM (). More than 95% of all bars in our sample are longer than 5 times the PSF FWHM. Therefore, a more realistic threshold to our bar detection method for identifying bars is , which corresponds to 1.3 kpc at the median distance of 18 Mpc in our sample. This size scale makes this study an ideal comparison sample for high redshift galaxies where similar spatial resolution is typically achieved. We discuss this issue in more detail in §3.2.1. Our reason for choosing is to distinguish between bars and oval structures (e.g., flattened bulges or inner disks). Our choices for the , PA are based on previous studies which have used these criteria to identify bars (Knapen et al., 2000; Laine et al., 2002; Sheth et al., 2003).
Some of the galaxies in our sample have ellipticity profiles that conform to the bar signature described above, but have PA profiles that do not111In our sample, (22/151) of all spirals fell into this category.. Visual inspection of these images shows that some appear to contain a bar, while others do not. These cases require special consideration as discussed here and illustrated in Figure 3a–e. The PA profiles of these galaxies deviate from the PA bar signature in one of two ways: (1) the change in PA that accompanies the drop in ellipticity is less than , or (2) the PA varies continuously within the region where there is a monotonic increase in ellipticity.
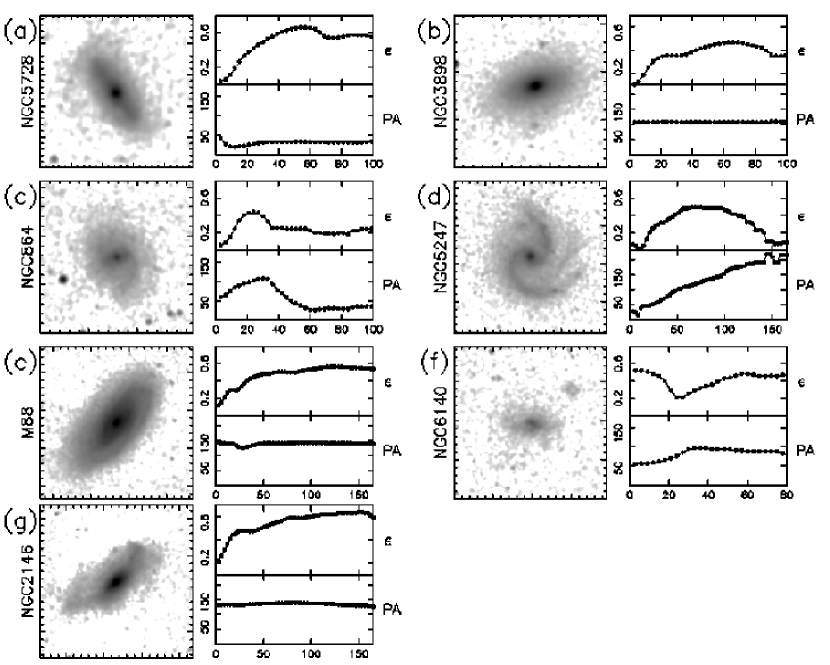
There are two possibilities for the first case: (a) a bar is present, but it has a PA similar to that of the disk (e.g. Figure 3a), or (b) there is no bar and the bar-like ellipticity signature traces the presence of an inner disk embedded within the galaxy disk (e.g. Figure 3b). Since bars are expected to be randomly oriented with respect to the underlying disk and PA may vary within ; we expect that, based strictly on geometric considerations, of bars will have a PA within of the host galaxy disk PA.
In the second case, the PA does not remain constant within the region where the ellipticity increases monotonically, but varies continuously. Two scenarios are responsible for this behavior, both involving the presence of spiral arms: (a) spiral arms originating within the bar region twist the bar isophotes, producing a progressive change in PA like the example shown in Figure 3c; or (b) no bar is present but the ellipticity profile is instead produced by the progressive stretching of disk isophotes by fairly open, bright spiral arms. This is shown in Figure 3d.
If we were to consider solely the ellipticity signature, all of the cases with these different PA signatures would be classified as barred galaxies, even though they probably do not all host bars. Instead, we adopt a separate category for these galaxies, introduced by Sheth et al. (2003): we classify these galaxies as barred spirals and will hereafter be referred to as . We visually inspected each individual candidate to determine whether a real bar was present or not. Candidates for which the ellipticity signature is produced by spiral arms (Figure 3d) or an inner disk (Figure 3b) are classified as . The remaining candidates are classified as .
Galaxies that do not show a monotonic rise and fall in ellipticity are classified as galaxies. An example of an unbarred galaxy is shown in Figure 3e, the nearby spiral, M88.
3. RESULTS
3.1. Bar Fraction
We successfully applied the ellipse-fit technique to the 151 galaxies in our sample. We found that 89 (59%) of all galaxies in our sample display both an ellipticity and PA bar signature, and are therefore identified as barred spirals. This fraction represents a lower limit to the NIR bar fraction measured in our 2MASS sample. Of the candidate barred spirals, where only one of the two bar signatures is present, 12/22 appear to have bars upon visual inspection. Thus, the fraction of galaxies with bars in our 2MASS sample increases to 101/151 (67%). For the remainder of the paper, we refer to this 67% sample as barred spirals. Our classification and notes for each galaxy, as well as their RC3 classifications are presented in Table 2.
We identify 86% of all SB galaxies and 80% of all SAB galaxies from the RC3 as barred spirals (see Table 2). In addition, we classify 11 galaxies within the RC3 SA category as barred spirals. With our exclusion of highly inclined galaxies (), our sample has 64 galaxies in common with those of E2000. Our classification agrees in 85% of the cases with the visual classification by E2000. Most of the RC3 and E2000 SB and SAB galaxies that do not meet our bar identification requirement have either bars that are too small, or have insufficient change in the ellipticities due to open spiral arms and/or disks with higher ellipticites than the bar; two such examples are NGC 6140 and NGC 2146 shown in Figures 3f and 3g.
Following our adopted definition for the bar signature, there are a number of instances in which our method fails to identify bars (see §2.2). Our measurement of the bar fraction is thus a firm lower limit to the true value, but it is not straightforward to quantify the error in the local bar fraction. Poisson statistics would indicate an error of 2% on the total bar fraction of 67%.
3.2. Bar Properties
3.2.1 Bar Sizes
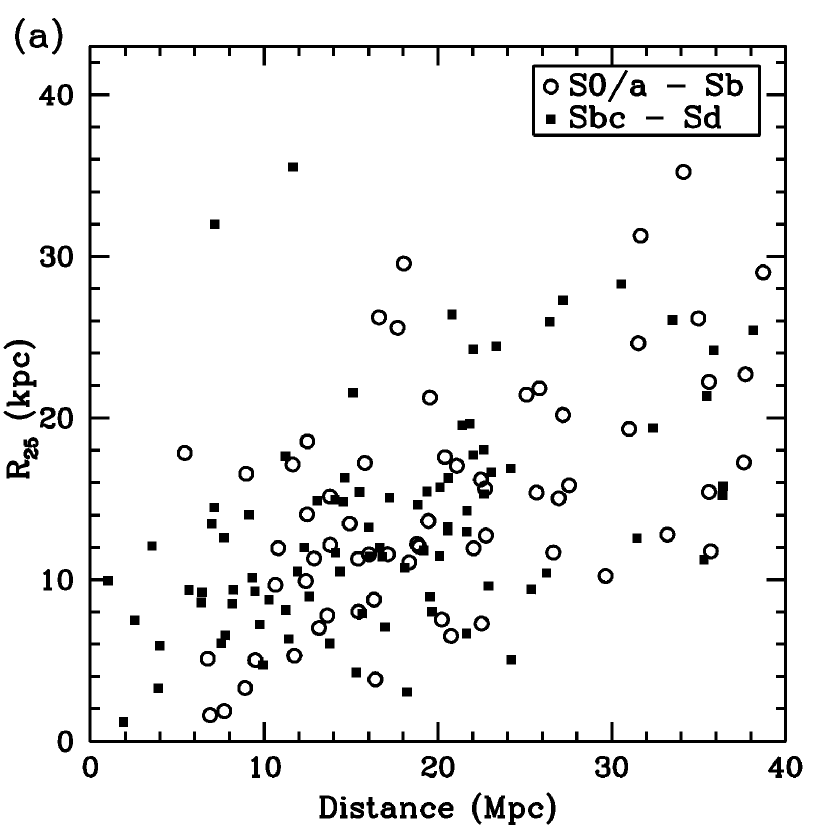
We define the relative bar size, , as the ratio of the bar deprojected semi-major axis to the RC3 radius of the host galaxy at a B magnitude of 25 (). The bar relative size has the advantage of being a distance-independent measure. The error on the relative bar size is and is dominated by the uncertainty on the measurement from the ellipticity profile of the bar signature. We found that 90% of all bars within the sample extend out to less than 50% of their host galaxy disk. Bars with the largest relative sizes are mostly found in small early-type galaxies (see Figure 4) with kpc. The properties of the typical 2MASS bar are summarized in Table 3.
We find a clear trend of bar sizes, both in terms of and , along the Hubble sequence, with early type bars being significantly larger than late types (see Figure 5). Bars in early Sa-Sb spirals have a median , while bars in later-type Sc-Sd spirals have a median , making the median relative bar size in early-type galaxies larger than in late types by a factor of two. Note that the low median value for the S0/a spirals is probably due to the low number of these transitional lenticular-to-spiral galaxies in our sample. Furthermore, the sizes of early-type bars cover a large range in relative sizes, , while late-type bars are restricted to lower relative sizes, .
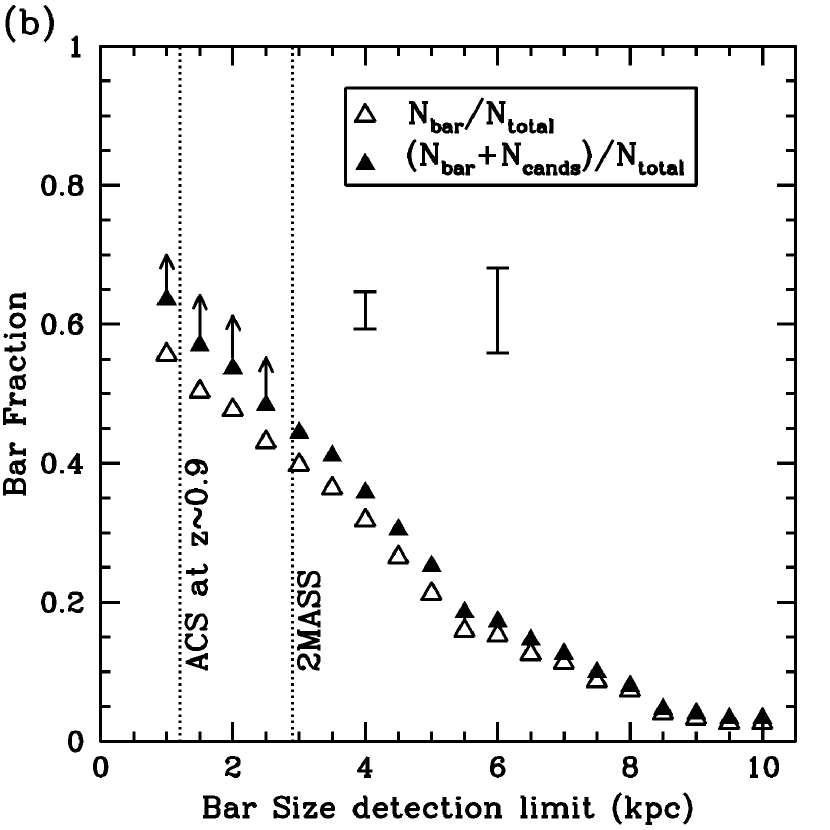
The distribution of absolute sizes of bars is dependent on resolution and the galaxy population being probed. The 2MASS sample probes the largest, brightest and most massive galaxies in the local universe. Figure 6a presents our 2MASS bar sizes as a function of distance. The median bar semi-major axis for the subset of barred spirals at a distance Mpc is 1.2 kpc. As we include more distant galaxies, the median bar size increases up to kpc (for Mpc); this trend parallels the limit of bar size detection of . The population of bars being probed is thus affected by the bar detection limit. We must, therefore, take into account the bar size for a proper determination of the bar fraction. Figure 6b shows how the 2MASS bar fraction changes depending on the ability to detect a particular bar size. This is especially important for studies of bars at high redshifts as discussed further in §4.4 and §4.5.
3.2.2 Bar Strengths
The higher the true ellipticity of the bar, the greater the effect of the bar potential on the otherwise axisymmetric gravitational potential of the disk. The maximum deprojected ellipticity thus provides a simple assessment of the bar strength. It has been shown to correlate well with other strength measures, such as the parameter (Block et al., 2004; Laurikainen, Salo & Rautiainen, 2002), which characterizes the bar strength by measuring the maximum gravitational bar torque relative to the galactic disk (Buta & Block, 2001).
The typical bar in our sample has a projected ellipticity of 0.5. We find that the distribution of ellipticities, shown in Figure 7a, is clearly skewed towards higher ellipticities, with a sharp drop in bar population around . By definition, our bar detection method excludes bars with , which explains the absence of these very weak bars. Since highly elliptical bars are the easiest to identify with our ellipse-fit method, the sharp decline in Figure 7a is an intrinsic property of bars, indicating a lack of very strong bars in the local universe. We discuss this in more detail in §4.2.
We find a weak correlation between the bar strength and the bar size, both in terms of and , as shown in Figure 7b. For all barred spirals in our sample we find that bar ellipticity and relative size are correlated with a level of significance as determined from the correlation r-coefficient of 0.34. Stronger bars appear to also be the longest ones, both in absolute size and relative to the host disk. This trend is more significant for early-type barred galaxies; the correlation coefficient for early-types is , compared to for late-types. Previous studies (Martin, 1995; Laurikainen, Salo & Rautiainen, 2002; Erwin, 2005) found no significant correlation between these two bar properties, though Laurikainen, Salo & Rautiainen (2002) noted a slight increase in bar length with increasing bar strength when considering only late-type galaxies. We find that the bar ellipticity is not correlated with the Hubble Type, the galaxy size or the -band luminosity.
4. DISCUSSION
4.1. Bar Fractions in the Optical and NIR
Observations in the NIR provide a better discriminant between barred and unbarred spirals than in the optical. The RC3 classification is based on the presence of a bar as seen in blue photographic plates: spirals in which a bar is clearly present were classified as strongly-barred (SB), while the bars in SAB galaxies were referred to as “weak bars” or “oval distortions” because they are a minor distortion to the disk. In our NIR analysis, all the intermediate SAB galaxies are classified as . We do not make a distinction such as the SB and the SAB classification; galaxies are either barred or unbarred.
Our lower limit to the NIR bar fraction of 0.59 is conservative because it is restricted to barred galaxies with both an ellipticity and PA signature. It is consistent with the bar fraction of 59 found by LSB04, who apply a fourier decomposition method to a sample of 158 OSUBSGS and 22 2MASS spirals with inclination .
The NIR bar fraction increases to 0.67 when we include the barred galaxies with only the ellipticity signature. We compare this result to the total fraction of 0.63 (SB + SAB) in the RC3 -band analysis. Although the relative fraction of strong (SB) or weak bars (SAB) changes based on the wavelength of observation, the overall fraction of barred galaxies remains relatively unchanged from the -band to the -band. This indicates that the bar morphology, though degraded, can be reliably detected by eye in the -band. We note that it may be likely that fewer galaxies in the -band are identified as bars by automated algorithms due to the more irregular or patchy appearance of galaxies in bluer bands. Algorithms such as the ellipse-fitting algorithm rely on a smooth light distribution and often fail for irregular distributions. Quantitative measurements of the change in the bar fraction with the ellipse-fit algorithm in the -band remain to be tested.
Our results are consistent with the H-band bar fraction of 0.72 measured by E2000 in their OSUBGS sample. In contrast to our approach, E2000 did not make selection cuts based on inclination to restrict their sample and, like earlier optical studies (e.g., Third Reference Catalog of Bright Galaxies, de Vaucouleurs et al. 1991, hereafter, RC3), relied on visual inspection to identify bars. W2002 report a slightly larger H-band bar fraction of 0.79 in their sample of 72 OSUBSGS galaxies with inclination . However, even though this method is quantitative it is based on the selection of only two ellipses, an inner and outer one, to define a bar. The ellipse fitting method used here is more robust because it uses the full two-dimensional light distribution.
Our method does not detect bars in 1/3 of our sample. There are a number of reasons why our method may have failed to detect an existing bar, particularly a small bar (see §3.1). However, this is unlikely to be the case in a majority of the galaxies we classify as unbarred spirals (e.g., Figure 3e). Models suggest that a bar may be prevented from forming if the disk is too dynamically hot, or if the disk is not sufficiently massive (Ostriker & Peebles, 1973; Athanassoula, 2005). Galaxies may also dissolve their bars by accumulating a large central mass concentration or by undergoing a merger (Combes & Gerin, 1985; Das et al., 2003; Shen & Sellwood, 2004). In either case, an unbarred spiral should be dynamically hotter than a barred spiral. Kinematical studies comparing unbarred and barred galaxies are needed to confirm this hypothesis.
4.2. Secular Galaxy Evolution
In the 2MASS sample, early-type barred galaxies tend to host longer bars than late-type galaxies, both in terms of and (see Figure 5), consistent with previous studies (Elmegreen & Elmegreen, 1985; Martin, 1995; Laurikainen, Salo & Rautiainen, 2002; Erwin, 2005). Martin (1995) reports that early-type bars are on average three times larger than late-types, slightly higher than our difference of a factor of two. The sample of Martin (1995) has very few early-type galaxies, whereas our barred sample has more galaxies and a relatively well-balanced distribution of early (44%) and late-type spirals (56%). Early-type spirals are on average more massive than late-types and therefore may form longer bars via the bar instability. We also find that bars in early type galaxies have a larger scatter in sizes than those in late-types.
Recent work by Sheth et al. (2005) has shown that a late-type galaxy cannot build an early-type bulge solely through gas inflow along a bar; additional processes, such as mergers, are needed to enable the transition of a late-type barred galaxy to an early-type. One such scenario of recurrent bar formation has been proposed by Bournaud & Combes (2002). In their simulations, the second-generation bars are shorter than their predecessors. This may be one explanation for the presence of short bars in the early-type galaxies in our 2MASS sample (see Figure 5).
The distribution of bar ellipticities shows a steep decline in bars with high ellipticites ( 0.6) and a dearth of bars with (see Figure 7a). It is possible that these strong bars have been destroyed. Simulations show that bars may dissolve if a sufficiently high concentration of mass accretes at the very centers of the disks (e.g., Norman, Sellwood, & Hasan 1996; Shen & Sellwood 2004). The mass increase is likely driven by the bar-induced gas flow (Kormendy, 1982; Friedli & Pfenninger, 1991; Friedli & Benz, 1993; Regan, Sheth & Vogel, 1999). Since stronger bars are more efficient in driving gas inwards, the central concentration in these strongly barred galaxies may increase rapidly, and may accelerate the process of bar destruction. The decline in strong bars in Figure 7a may thus be an indication that stronger bars have evolved more rapidly out of their barred state than weaker barred spirals, and that the strongest bars have already been destroyed.
It is also possible that the drop in the high-end of the ellipticity distribution reflects a natural limit on how thin a bar may become either due to the presence of a bulge that limits the size of the bar semi-minor axis, or a limit imposed by the stability of the stellar orbits that sustain the bar. The first possibility naturally leads to a bias of more thinner bars in late-type galaxies where bulges are smaller than in earlier-type galaxies. However, the ellipticity distribution we find is even more pronounced in the late types (see Figure 7a). Therefore we can rule out the “bulge hypothesis”. The other possibility was addressed by Athanassoula (1983) who showed how thin bars have more chaotic orbits. This may also explain the lack of thin bars beyond a certain ellipticity at which a bar becomes unable to sustain itself.

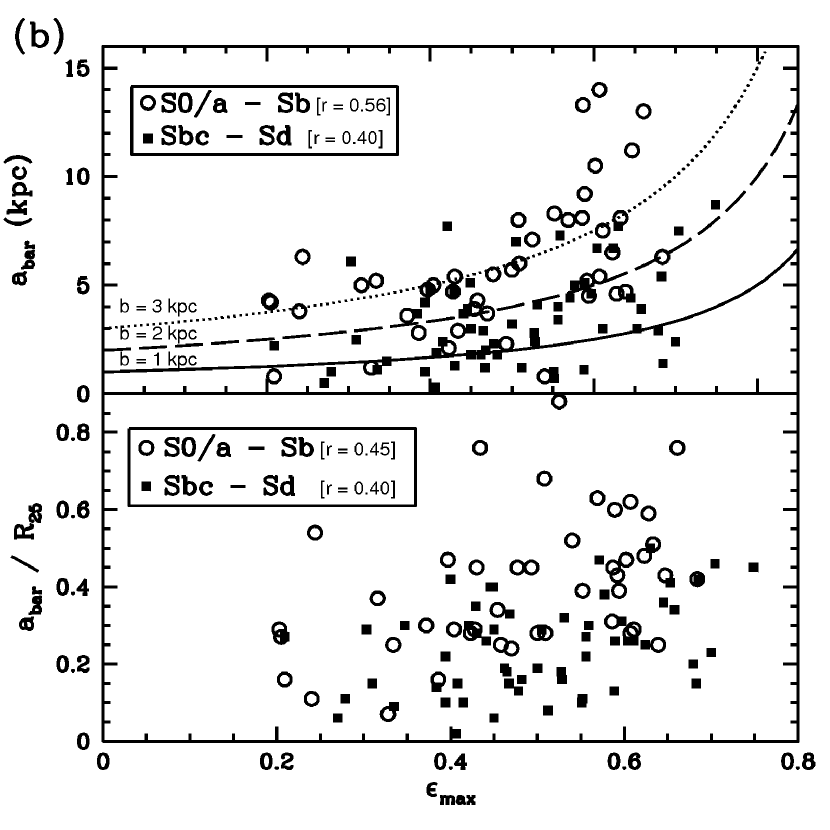
4.3. Bar Properties
We find a weak correlation between the bar size and the bar ellipticities (see Figure 7b) with longer bars having somewhat greater ellipticities. This trend is likely to be stronger because the measured ellipticities are underestimated for big bulged galaxies with thin bars, e.g., bars whose semi-minor axis is smaller than the bulge radius. This is because the ellipse fitting routine does not decompose the bulge and disk, and cannot measure an ellipticity with a semi-minor axis smaller than the bulge radius. Therefore, the true ellipticity of the thinner early type spirals is likely to be even higher which strengthens the correlation shown in Figure 7b. The expected correlation between ellipticity and the semi-major axis for a constant semi-minor axis is shown by the curves in Figure 7b. The measured ellipticity for early type spirals are consistently above these curves.This indicates that the bar semi-major axis () changes more rapidly with than the semi-minor axis ().
4.4. The Change in Bar Fraction As a Function of Bar Size
In deriving a bar fraction it is critical to define the bar population that is being studied. At a fixed angular resolution, the most important selection effect is the decreasing ability to detect smaller bars with increasing distance. This is a serious problem for high redshift studies aimed at measuring the evolution of the bar fraction, as shown in Figure 3 of Sheth et al. (2003). With our 2MASS sample we can estimate how the bar fraction must change with changing spatial resolutions. In Figure 6b we show the cumulative bar fraction for different detection limits of the bar size. The fraction of barred spirals drops from 67% over the entire sample to 36% when we only count bars larger than 4 kpc, and a mere 8% for bars larger than 8 kpc. An important caveat to be noted is that even with our large NIR data set, we are incomplete for the small bars. Our bar size detection limit changes from 0.5 kpc to 3 kpc over the volume surveyed (D 40 Mpc). Hence we are only complete for bars with kpc, but this is more than adequate for comparison to high redshift observations which typically have a similar spatial resolution.
The 2MASS sample thus offers a detailed local comparison sample for the high redshift studies. As noted in the previous section, the effect of bandshifting from the -band to the -band is likely to be minimal and thus 2MASS is a local anchor for the studies of galaxy evolution in the rest frame optical.
4.5. The Local Bar Fraction as an anchor for high redshift studies
Our NIR results show that there is not a significant population of veiled barred spirals in the optical, as we discussed in §4.1. In other words, the HST - and -band data now available for high redshift studies can be used to trace the bar fraction to at least a redshift of where the observed -band data images galaxies in the rest frame -band. We strongly caution against interpretation of bar fractions for redshifts higher than because there is strong evidence that bars completely disappear in the ultra-violet (UV); an example is shown in Figure 1 of Sheth et al. (2003). Other examples are evident in the GALEX images, which show no bars in nearby galaxies (Gil de Paz, private communication)222We have looked at publicly available GALEX images of a subset of the 2MASS spiral sample and have found no indication of bars.. Since UV light is dominated by young ( yrs) star forming regions, it may not trace the gravitational potential and bar signatures are likely to be absent in the UV. Any measurement of the bar fraction at in the rest-frame UV is therefore likely to suffer from an abrupt decline in the number of bars as they disappear shortwards of the Balmer break. Additionally, at , observations are affected by coarse linear resolution (see Figure 3 in Sheth et al. 2003) and the steep decline in the cosmological dimming of the surface brightness. We note that this study, however, is a good analog for high redshift studies because the angular resolution and shallow depth of 2MASS are similar to the limitations of high redshift data described above.
Various authors have studied the evolution of the bar fraction with redshift. Sheth et al. (2003) first challenged the previous findings that barred spirals were completely absent at high redshifts (Abraham et al., 1999; van den Bergh et al., 1996, 2000, 2001). Sheth et al. (2003) studied all galaxies in the HDF-N in the WFPC2 , and NICMOS- bands to investigate whether bars were more apparent at the longer NICMOS wavelengths. At , the coarse NICMOS data are only able to probe the biggest spirals. Here they find 3/31 barred spirals with an average bar semi-major axis of 6.4 kpc. This fraction is comparable to the 2MASS fraction of 15% for bars with kpc, but we note that both samples suffer from small number statistics - large bars are rare and require very large search volumes. With these caveats, Sheth et al. (2003) concluded that there was no strong evidence for an absence of long bars at high redshift.
Following Sheth et al. (2003), two studies have examined the fraction of bars with higher resolution optical ACS data. Elmegreen et al. (2004) studied 186 galaxies from the Tadpole field out to and reported a nearly constant bar fraction of 0.23 out to . Jogee et al. (2004) analysed 258 galaxies from the GEMS survey and reported a similar constant bar fraction of 0.30 out to . These studies argue that at high redshifts the bar fraction is measured in the rest-frame -band and is therefore comparable to the 0.35 value measured for SB galaxies in the RC3. However they also claim that the fraction is the same at intermediate redshifts. At redshifts of , the ACS angular resolution and data quality are superb and selection effects noted by Elmegreen et al. (2004) and Jogee et al. (2004) (e.g. surface brightness dimming, coarse resolution, poor signal to noise) ought to be minimal. Moreover, the rest-frame wavelength data for galaxies at intermediate redshifts is longwards of the -band. Therefore we would have expected these studies to detect both the SB spirals and the SAB spirals. Their bar fraction should have been comparable to our local NIR result. However, for their bar detection threshold of 1.2 kpc, their measured bar fraction is lower than the 2MASS value of 0.58 by almost a factor of two.
If the bar fraction is indeed a constant out to , as suggested by Elmegreen et al. (2004) and Jogee et al. (2004), we would expect the fraction of bars at , to be the same as the local (SB + SAB) RC3 fraction measured by eye. One possibility for this discrepancy is the small sample sizes of these existing studies. All of them have less than 300 galaxies over the entire redshift range with which they have attempted to constrain the evolution of the bar fraction. Another possibility is that the bars and galaxies are evolving. For example, if galaxies at are smaller than local galaxies as suggested by Elmegreen et al. (2005), then the bars at these redshifts may also be smaller, and may be undetected by these studies. However, the difference between the local bar fraction and the fraction measured at these higher redshifts may also indicate a potential evolution of the bar fraction with redshift. Thus the perceived non-evolution of the bar fraction may be a misinterpretation of the active evolution in the bar fraction. In order to explore this possibility, we are analyzing the 2-square degree COSMOS field to study in detail the evolution of bar fraction to . The COSMOS data are extremely deep (only half a magnitude shallower than GOODS -band data), and have over 4000 L∗ galaxies at . With this large and deep dataset we will quantify the evolution of the bar fraction and bar sizes while using the results presented here as a local anchor and guide for understanding galaxy evolution.
5. CONCLUSIONS
We have performed a detailed study of 151 2MASS spirals out to 40 Mpc using an ellipse-fitting technique to derive the local fraction of barred spirals and to characterize their properties. We discussed in detail the advantages and shortcomings of our technique for its use as a practical approach in analyzing large data sets for which visual inspection of individual images becomes rapidly inefficient. We discussed how our detailed analysis of the local bar population sets the groundwork for studies of galaxy evolution at higher redshifts.
Our main results are:
1. We have found a lower limit to the NIR fraction of barred galaxies of 0.59 in the local universe. By complementing our automated bar detection method with visual inspection, the total bar fraction increases to 0.67. This suggests that the bar fraction in the NIR is not significantly different than the bar fraction of 0.63 (SB + SAB) in the optical. This is a promising result for work on the available, expansive datasets of high redshift galaxies that probe rest-frame optical wavelengths.
2. The typical 2MASS bar extends out to in radius relative to the underlying blue disk.
3. 2MASS bars have a median semi-major axis of 4.2 kpc. The 2MASS coarse angular resolution and shallow depth favors the detection of larger bars.
4. A weak trend relating bar strength and size appears to be present. The correlation between the bar ellipticity, , and is stronger ( ) for early-type galaxies and shows that (and ) evolves more rapidly with increasing ellipticity than the bar semi-minor axis, , whose size is regulated by the bulge radius.
5. We find that the mean in early-type spirals is two times larger than in late-types, confirming that bars in early-type galaxies are larger than in late-types.
6. We show how the measured bar fraction depends critically on the population of bar sizes that can be probed by the observations and detection method. Whereas the bar fraction is 0.64 for bars longer than kpc, the fraction decreases to 0.44 for kpc. Careful consideration of this bar detection threshold must be taken into account for high redshift studies of the bar fraction.
7. Even after taking into account the ability to resolve bars, the locally measured bar fraction is higher by nearly a factor of two than the bar fraction at reported by recent optical ACS studies. Our results do not support the conclusion in these studies that the bar fraction remains constant out to . The difference in the bar fraction with these high-redshift studies may be due to small number statistics of the these studies (all have galaxies from ). It may, however, indicate a potential evolution of the bar fraction with redshift. We are investigating the evolution of the bar fraction with over four thousand L∗ spirals from the COSMOS data set.
References
- Abraham et al. (1996) Abraham, R. G., Tanvir, N. R., Santiago, B. X., Ellis, R. S., Glazebrook, K., van den Bergh, S. 1996, MNRAS, 279, 47
- Abraham et al. (1999) Abraham, R. G., Merrifield, M. R., Ellis, R. S., Tanvir, N. R., Brinchmann, J. 1999, MNRAS, 308, 569
- Abraham et al. (2000) Abraham, R. G., Merrifield, M. R. 2000, AJ, 120, 2835
- Athanassoula (1983) Athanassoula, E., Bienaymé, O., Martinet, L., Pfenniger, D. 1983, A&A, 127, 349
- Athanassoula (1992a) Athanassoula, E. 1992a, MNRAS, 259, 328
- Athanassoula (1992b) Athanassoula, E. 1992b, MNRAS, 259, 345
- Athanassoula (2005) Athanassoula, E., Lambert, J. C., Dehnen, W. 2005, MNRAS, 363, 496
- Block et al. (2004) Block, D., Buta, R., Knapen, J.H., Elmegreen, B.G., Elmegreen, D.M., & Puerari, I. 2004, AJ, 128, 183
- Bournaud & Combes (2002) Bournaud, F., & Combes, F. 2002, A&A, 392, 83
- Buta & Block (2001) Buta, R., & Block, D. L., 2001, ApJ, 550, 243
- Buta et al. (2005) Buta, R., Vasylyev, S., Salo, H., Laurikainen, E., 2005, AJ, 130, 506
- Combes & Gerin (1985) Combes, F., & Gerin, M. 1985, A&A, 150, 327
- Das et al. (2003) Das, M., Teuben, P. J., Vogel, S. N., Regan, M. W., Sheth, K. , Harris, A. I., Jeffreys, W. H., 2003, ApJ, 582, 190
- de Vaucouleurs et al. (1991) de Vaucouleurs, G., de Vaucouleurs, A., Corwin, H. G., Jr., Buta, R. J., Paturel, G., & Fouque, P. 1991, Third Reference Catalogue of Bright Galaxies, (New York:Springer-Verlag)
- de Vaucouleurs (1963) de Vaucouleurs, G. 1963, ApJS, 8, 31D
- Dickinson & Giavalisco (2002) Dickinson, M., Giaalvisco, M. & the GOODS team in the proceedings of the ESO/USM workshp ”The Mass of Galaxies at Low and High Redshift”, (Venice, Italy), 2001 eds. Bender, R. & Renzini, A.
- Elmegreen & Elmegreen (1985) Elmegreen, B. G., & Elmegreen, D.M. 1985, ApJ, 288, 438
- Elmegreen et al. (2004) Elmegreen, B. G., Elmegreen, D. M., Hirst, A. C. 2004, ApJ, 612, 191
- Elmegreen et al. (2005) Elmegreen, D. M., Elmegreen, B. G., Rubin, D. S., Schaffer, M. A. 2005, ApJ, 631, 85
- Eskridge et al. (2000) Eskridge, P., et al. 2000, AJ, 119, 536 (E2000)
- Eskridge et al. (2002) Eskridge, P. et al. 2002, ApJS, 143, 73
- Erwin (2005) Erwin, P. 2005, MNRAS, 364, 283
- Friedli & Benz (1993) Friedli, D. & Benz, W. 1993, A&A, 268, 65
- Friedli & Pfenninger (1991) Friedli, D., Pfenninger, D. 1991, IAUS, 146, 362
- Hackwell & Schweizer (1983) Hackwell, J. A., Schweizer, F., 1983, ApJ, 265, 643
- Jedrzejewski (1987) Jedrzejewski, R. I. 1987, MNRAS, 226, 747
- Jogee et al. (2004) Jogee, S. et al. 2004, ApJ, 615, 105
- Heraudeau & Simien (1996) Heraudeau, P., & Simien, F.. 1996, A&A, 118, 111
- Ho, Filippenko, & Sargent (1997a) Ho, L. C., Filippenko, A. V., & Sargent, W. L. W. 1997a, ApJS, 112, 315
- Ho, Filippenko, & Sargent (1997b) Ho, L. C., Filippenko, A. V., & Sargent, W. L. W. 1997b, ApJ, 487, 591
- Jarrett et al. (2003) Jarrett, T. H., Chester, T., Cutri, R., Schneider, S. E., Huchra, J. P. 2003, AJ, 125, 525
- Knapen et al. (2000) Knapen, J., Shlosman, I., Peletier, R. 2000, ApJ, 529, 93
- Kormendy (1979) Kormendy, J. 1979, ApJ, 227, 714
- Kormendy (1982) Kormendy, J. 1982, ApJ, 257, 75
- Kormendy & Kennicutt (2004) Kormendy, J. & Kennicutt, R.C. 2004, ARA&A, 42, 603
- Laine et al. (2002) Laine, S., Shlosman, I., Knapen, J. H., & Peletier, R. F. 2002, ApJ, 567, 97
- Laurikainen, Salo & Rautiainen (2002) Laurikainen, E., Salo, H., & Rautiainen, P. 2002, MNRAS, 331, 880
- Laurikainen, Salo & Buta (2004) Laurikainen, E., Salo, H., & Buta, R. 2004, ApJ, 607, 103 (LSB04)
- Martin (1995) Martin, P. 1995, AJ, 109, 2428
- Martin & Roy (1994) Martin, P., & Roy, J. 1994, ApJ, 424, 599
- Mulchaey & Regan (1997) Mulchaey, J. S., & Regan, M. W. 1997, ApJ, 482, 135
- Norman, Sellwood, & Hasan (1996) Norman, C. A., Sellwood, J. A., & Hasan, H. 1996, ApJ, 462, 114
- Ostriker & Peebles (1973) Ostriker, J. P., Peebles, P. J. E. 1973, ApJ, 186, 467
- Piner, Stone & Teuben (1995) Piner, B.G., Stone, J.M., & Teuben, P. J. 1995, ApJ, 449, 508
- Regan & Elmegreen (1997) Regan, M. W., Elmegreen, D. M. 1997, ApJ, 114, 965
- Regan, Vogel & Teuben (1997) Regan, M. W., Vogel, S.N., Teuben, P. J. 1997, ApJ, 482, 135
- Regan, Sheth & Vogel (1999) Regan, M. W., Sheth, K., & Vogel, S.N. 1999, ApJ, 526, 97
- Rix et al. (2004) Rix, H-W., et al. 2004, ApJS, 152, 163
- Sakamoto et al. (1999) Sakamoto, K., Okumura, S. K., Ishizuki, S., Scoville, N. Z. 1999b, ApJ, 525, 691
- Scoville et al. (1988) Scoville, N. Z., Matthews, K., Carico, D. P., Sanders, D. B. 1988, ApJ, 327, 61
- Scoville et al. (2006) Scoville, N. Z., & COSMOS team, ApJ, submitted
- Seigar & James (1998) Seigar, M. S., James, P. A. 1998, MNRAS, 299, 685
- Shen & Sellwood (2004) Shen, J., Sellwood, J. A. 2004, ApJ, 604, 614
- Sheth et al. (2000) Sheth, K., Regan, M. W., Vogel, S. N., & Teuben, P. J. 2000 ApJ, 532, 221
- Sheth et al. (2002) Sheth, K., Vogel, S. N., Regan, M. W., Teuben, P.J., Harris, A. I., & Thornley, M. D. 2002, AJ, 124, 2581
- Sheth et al. (2003) Sheth, K., Regan, M. W., Scoville, N.Z., & Strubbe, L.E. 2003, ApJ, 592, 13
- Sheth et al. (2004) Sheth, K., Menéndez-Delmestre, K., Scoville, N., Jarrett, T., Strubbe, L., Regan, M. W., Schinnerer, E., Block, D. L. 2004, Penetrating Bars Through Masks of Cosmic Dust, eds. Block, D. L., Puerari, I., Freeman, K. C., Groess, R., Block, E. K., Astrophysics and Space Science Library 319, p405
- Sheth et al. (2005) Sheth, K., Vogel, S.N., Regan, M.W., Thornley, M.D., & Teuben, P.J. 2005, ApJ, 632, 217
- Shlosman, Frank, & Begelman (1989) Shlosman, I., Frank, J., & Begelman, M. C. 1989, Nature, 338, 45
- Skrutskie et al. (2006) Skrutskie, M. F. et al. 2006, AJ, 131, 1163
- Teuben (1995) Teuben, P. J. 1995, The Stellar Dynamics Toolbox NEMO, in: Astronomical Data Analysis Software and Systems IV, eds. Shaw, R., Payne, H.E. & Hayes, J.J.E., PASP Conf Series 77, p398.
- Thronson et al. (1989) Thronson, H. A. et al. 1989, ApJ, 343, 158
- van den Bergh et al. (1996) van den Bergh, S., Abraham, R. G., Ellis, R., Tanvir, N. R., Santiago, B. X., Glazebrook, K. G. 1996, ApJ, 112, 359
- van den Bergh et al. (2000) van den Bergh, S., Cohen, J. G., Hogg, D. W., Blandford, R. 2000, ApJ, 120, 2190
- van den Bergh et al. (2001) van den Bergh, S., Cohen, J. G., Crabbe, C. 2001, ApJ, 122, 611
- Whyte et al. (2002) Whyte, L. F., Abraham, R. G., Merrifield, M. R., Eskridge, P. B., Frogel, J. A., Pogge, R. W. 2002, MNRAS, 336, 1281 (W2002)
- Wozniak et al. (1991) Wozniak, H., Pierce, M. J. 1991, A&A, 88, 325
- Zheng et al. (2005) Zheng, X. Z., Hammer, F., Flores, H., Assémat, F., Rawat, A. 2005, A&A, 435, 507
| Galaxy | (J2000)aaHyperLeda Extragalactic Database (LEDA) | (J2000)aaHyperLeda Extragalactic Database (LEDA) | bb2MASS search engine GATOR | DccNED | aaHyperLeda Extragalactic Database (LEDA) | aaHyperLeda Extragalactic Database (LEDA) | PAaaHyperLeda Extragalactic Database (LEDA) | |
|---|---|---|---|---|---|---|---|---|
| (hours) | () | (mag) | (mag) | (Mpc) | (kpc) | () | () | |
| S0/a Spirals | ||||||||
| NGC1291 | 3.289 | -41.108 | -24.67 | 5.66 | 11.6 | 17.12 | 33 | 156 |
| NGC1317 | 3.379 | -37.103 | -24.39 | 7.74 | 26.6 | 11.68 | 32 | 72 |
| NGC1326 | 3.399 | -36.464 | -23.93 | 7.45 | 18.9 | 12.04 | 49 | 67 |
| NGC2217 | 6.361 | -27.234 | -24.67 | 7.09 | 22.5 | 16.19 | 28 | 0ddMartin 1995 |
| NGC2681 | 8.892 | 51.313 | -22.45 | 7.43 | 9.5 | 5.02 | 0 | 3ee2MASS IRSA |
| NGC2655 | 8.927 | 78.224 | -24.49 | 6.95 | 19.5 | 13.63 | 54 | 16 |
| NGC5101 | 13.363 | -27.430 | -24.91 | 7.16 | 25.8 | 21.83 | 40 | 124 |
| Sa Spirals | ||||||||
| NGC1022 | 2.642 | -6.677 | -23.09 | 8.44 | 20.2 | 7.53 | 46 | 68 |
| NGC1367 | 3.584 | -24.934 | -23.92 | 7.63 | 20.4 | 17.59 | 51 | 134 |
| NGC3169 | 10.237 | 3.466 | -23.88 | 7.28 | 17.1 | 11.57 | 63 | 45 |
| NGC3718 | 11.543 | 53.068 | -22.94 | 7.76 | 13.8 | 15.15 | 63 | 180 |
| NGC4314 | 12.376 | 29.895 | -23.22 | 7.45 | 13.6 | 7.79 | 19 | 155ee2MASS IRSA |
| NGC4491 | 12.516 | 11.484 | -19.31 | 9.88 | 6.9 | 1.61 | 64 | 147 |
| NGC5728 | 14.707 | -17.253 | -24.77 | 8.17 | 37.6 | 17.25 | 58 | 180 |
| NGC7172 | 22.034 | -31.870 | -24.45 | 8.32 | 35.7 | 11.76 | 58 | 105 |
| NGC7727 | 23.665 | -12.292 | -24.36 | 7.69 | 25.7 | 15.38 | 40 | 28ee2MASS IRSA |
| Sab Spirals | ||||||||
| NGC1350 | 3.519 | -33.629 | -24.71 | 7.40 | 25.1 | 21.45 | 64 | 11 |
| NGC1398 | 3.648 | -26.338 | -24.96 | 6.50 | 19.5 | 21.26 | 45 | 100 |
| NGC1433 | 3.700 | -47.222 | -23.81 | 7.06 | 14.9 | 13.47 | 48 | 95 |
| NGC1512 | 4.065 | -43.349 | -23.00 | 7.49 | 12.5 | 18.55 | 61 | 56 |
| NGC2146 | 6.310 | 78.356 | -23.40 | 7.06 | 12.4 | 9.91 | 58 | 123 |
| NGC2566 | 8.313 | -25.499 | -24.02 | 7.77 | 22.8 | 12.73 | 60 | 69 |
| NGC2775 | 9.172 | 7.038 | -24.31 | 7.06 | 18.8 | 12.21 | 40 | 160 |
| NGC2985 | 9.840 | 72.280 | -23.96 | 7.36 | 18.3 | 11.07 | 39 | 176 |
| NGC3049 | 9.914 | 9.272 | -21.63 | 9.96 | 20.8 | 6.51 | 56 | 27 |
| NGC3031 (M81) | 9.926 | 69.066 | -24.84 | 3.83 | 5.4 | 17.83 | 63 | 157 |
| NGC3368 (M96) | 10.779 | 11.820 | -24.16 | 6.32 | 12.5 | 14.04 | 51 | 5 |
| NGC3898 | 11.821 | 56.084 | -23.41 | 7.66 | 16.3 | 8.76 | 53 | 108 |
| NGC4151 | 12.176 | 39.406 | -23.32 | 7.38 | 13.8 | 12.15 | 40 | 50 |
| NGC4448 | 12.471 | 28.621 | -21.98 | 7.81 | 8.9 | 3.29 | 60 | 98 |
| NGC4450 | 12.475 | 17.085 | -25.12 | 7.05 | 27.2 | 20.19 | 43 | 173 |
| NGC4750 | 12.835 | 72.875 | -23.74 | 8.02 | 22.5 | 7.28 | 31 | 142 |
| NGC4725 | 12.841 | 25.501 | -24.95 | 6.17 | 16.6 | 26.23 | 51 | 33 |
| NGC4736 (M94) | 12.848 | 41.120 | -24.66 | 5.11 | 9.0 | 16.55 | 30 | 105 |
| NGC4941 | 13.070 | -5.552 | -22.73 | 8.22 | 15.4 | 8.02 | 54 | 23 |
| NGC5317 | 13.888 | 33.491 | -24.80 | 7.80 | 16.4 | 3.83 | 43 | 58 |
| NGC7217 | 22.131 | 31.359 | -23.75 | 6.85 | 13.2 | 7.01 | 34 | 88 |
| NGC7552 | 23.270 | -42.584 | -24.18 | 7.54 | 22.1 | 11.94 | 51 | 103 |
| Sb Spirals | ||||||||
| NGC210 | 0.676 | -13.874 | -23.39 | 8.39 | 22.7 | 15.63 | 54 | 163 |
| NGC488 | 1.363 | 5.257 | -25.53 | 6.96 | 31.5 | 24.63 | 43 | 15 |
| NGC772 | 1.989 | 19.008 | -25.47 | 7.20 | 34.1 | 35.23 | 59 | 131 |
| NGC986 | 2.559 | -39.045 | -24.42 | 7.78 | 27.6 | 15.84 | 57 | 28 |
| NGC1068 | 2.711 | -0.013 | -25.20 | 5.79 | 15.8 | 17.22 | 29 | 73 |
| NGC1097 | 2.772 | -30.275 | -24.98 | 6.25 | 17.7 | 25.59 | 51 | 140 |
| NGC1365 | 3.560 | -36.141 | -25.43 | 6.37 | 18.0 | 29.56 | 55 | 12 |
| NGC1530 | 4.391 | 75.296 | -24.39 | 8.29 | 37.7 | 22.70 | 59 | 81 |
| NGC2090 | 5.784 | -34.251 | -22.50 | 8.05 | 12.9 | 11.31 | 64 | 17 |
| NGC3227 | 10.392 | 19.865 | -23.39 | 7.64 | 16.0 | 11.56 | 59 | 157 |
| NGC3351 | 10.733 | 11.704 | -23.50 | 6.67 | 10.8 | 11.95 | 57 | 13 |
| NGC3583 | 11.236 | 48.319 | -23.98 | 8.38 | 29.7 | 10.23 | 55 | 134 |
| NGC3673 | 11.420 | -26.737 | -23.65 | 8.51 | 27.0 | 15.04 | 59 | 70 |
| NGC3675 | 11.436 | 43.586 | -23.28 | 6.86 | 10.7 | 9.67 | 58 | 178 |
| NGC4102 | 12.107 | 52.711 | -22.63 | 7.72 | 11.7 | 5.30 | 59 | 38 |
| NGC4548 (M88) | 12.533 | 14.420 | -26.24 | 6.27 | 31.7 | 31.28 | 60 | 138 |
| NGC4548 (M91) | 12.591 | 14.496 | -22.03 | 7.12 | 6.8 | 5.11 | 35 | 150 |
| NGC4579 | 12.629 | 11.818 | -25.13 | 6.49 | 21.1 | 17.04 | 39 | 89 |
| NGC4593 | 12.661 | -5.344 | -24.71 | 7.99 | 35.6 | 15.42 | 55 | 38 |
| NGC4595 | 12.664 | 15.298 | -19.69 | 10.03 | 7.7 | 1.87 | 52 | 110 |
| NGC5383 | 13.951 | 41.846 | -23.93 | 8.54 | 33.2 | 12.79 | 38 | 107 |
| NGC5850 | 15.119 | 1.545 | -24.65 | 8.10 | 35.6 | 22.24 | 41 | 107 |
| NGC5985 | 15.660 | 59.332 | -24.57 | 8.15 | 35.0 | 26.16 | 64 | 15 |
| NGC6300 | 17.283 | -62.820 | -24.01 | 6.93 | 15.4 | 11.29 | 54 | 119 |
| NGC6902 | 20.408 | -43.654 | -24.33 | 8.61 | 38.7 | 29.01 | 43 | 158 |
| NGC7606 | 23.318 | -8.485 | -24.82 | 7.64 | 31.0 | 19.32 | 60 | 145 |
| Galaxy | (J2000)aaHyperLeda Extragalactic Database (LEDA) | (J2000)aaHyperLeda Extragalactic Database (LEDA) | bb2MASS search engine GATOR | DccNED | aaHyperLeda Extragalactic Database (LEDA) | aaHyperLeda Extragalactic Database (LEDA) | PAaaHyperLeda Extragalactic Database (LEDA) | |
|---|---|---|---|---|---|---|---|---|
| (hours) | () | (mag) | (mag) | (Mpc) | (kpc) | () | () | |
| Sbc Spirals | ||||||||
| NGC289 | 0.878 | -31.206 | -23.78 | 8.00 | 22.6 | 18.05 | 40 | 129 |
| NGC613 | 1.572 | -29.418 | -24.54 | 7.03 | 20.6 | 16.28 | 50 | 119 |
| NGC1300 | 3.328 | -19.411 | -24.14 | 7.56 | 21.4 | 19.55 | 59 | 101 |
| NGC1566 | 4.333 | -54.938 | -24.71 | 6.89 | 20.8 | 26.42 | 44 | 32 |
| NGC1672 | 4.762 | -59.248 | -24.34 | 7.02 | 15.5 | 15.42 | 46 | 170ddMartin 1995 |
| NGC2207 | 6.273 | -21.373 | -24.72 | 8.19 | 38.2 | 25.42 | 61 | 116 |
| NGC2336 | 7.451 | 80.178 | -24.72 | 7.70 | 30.6 | 28.30 | 57 | 178 |
| NGC2442 | 7.607 | -69.531 | -24.65 | 6.87 | 20.1 | 15.72 | 50 | 23 |
| NGC2559 | 8.285 | -27.457 | -24.26 | 7.42 | 21.7 | 12.95 | 61 | 4 |
| NGC3344 | 10.725 | 24.922 | -22.12 | 7.44 | 8.1 | 8.51 | 17 | 140ddMartin 1995 |
| NGC3521 | 11.097 | -0.035 | -24.46 | 5.78 | 11.2 | 17.63 | 63 | 164 |
| NGC3642 | 11.372 | 59.074 | -22.74 | 8.97 | 22.0 | 17.73 | 35 | 105 |
| NGC3882 | 11.768 | -56.391 | -23.71 | 8.31 | 25.4 | 9.40 | 55 | 107 |
| NGC3953 | 11.897 | 52.327 | -23.78 | 7.05 | 14.6 | 16.29 | 63 | 13 |
| NGC3992 (M109) | 11.960 | 53.375 | -23.88 | 6.94 | 14.6 | 14.81 | 52 | 78 |
| NGC4051 | 12.053 | 44.531 | -22.27 | 7.67 | 9.7 | 7.23 | 29 | 135 |
| NGC4303 (M61) | 12.365 | 4.475 | -24.85 | 6.84 | 21.8 | 19.65 | 19 | 162 |
| NGC4321 (M100) | 12.382 | 15.823 | -25.13 | 6.59 | 22.0 | 24.25 | 38 | 155ddMartin 1995 |
| NGC4567 (VV219B) | 12.609 | 11.258 | -24.19 | 8.30 | 31.5 | 12.58 | 43 | |
| NGC4602 | 12.677 | -5.133 | -24.20 | 8.54 | 35.3 | 11.24 | 63 | |
| NGC4639 | 12.715 | 13.257 | -21.95 | 8.75 | 13.8 | 6.05 | 52 | 134 |
| NGC4930 | 13.068 | -41.411 | -23.94 | 8.83 | 35.9 | 24.19 | 46 | 44 |
| NGC5055 (M63) | 13.264 | 42.029 | -23.61 | 5.61 | 7.0 | 13.47 | 55 | 102 |
| NGC5054 | 13.283 | -16.634 | -24.33 | 7.59 | 24.2 | 16.87 | 54 | 171 |
| NGC5194 (M51A) | 13.498 | 47.195 | -23.54 | 5.50 | 6.4 | 9.22 | 47 | 163 |
| NGC5248 | 13.626 | 8.885 | -23.77 | 7.25 | 16.0 | 13.24 | 50 | 125 |
| NGC5247 | 13.634 | -17.884 | -23.85 | 7.53 | 18.8 | 14.62 | 43 | 170 |
| NGC5371 | 13.928 | 40.462 | -25.14 | 7.61 | 35.5 | 21.36 | 48 | 2 |
| NGC5347 | 13.937 | 5.015 | -21.54 | 9.65 | 17.2 | 15.06 | 57 | 121 |
| NGC5713 | 14.670 | -0.290 | -23.77 | 8.33 | 26.3 | 10.42 | 40 | 12 |
| NGC5921 | 15.366 | 5.071 | -23.47 | 8.10 | 20.5 | 13.02 | 44 | 140 |
| NGC6221 | 16.880 | -59.216 | -24.45 | 7.12 | 20.6 | 13.27 | 62 | 1 |
| NGC6384 | 17.540 | 7.061 | -24.29 | 7.53 | 23.1 | 16.65 | 60 | 14 |
| NGC6744 | 19.163 | -63.858 | -24.40 | 5.94 | 11.7 | 35.54 | 49 | 16 |
| Sc Spirals | ||||||||
| NGC578 | 1.508 | -22.667 | -23.19 | 8.59 | 22.6 | 15.30 | 54 | 115 |
| NGC628 | 1.612 | 15.783 | -22.95 | 6.85 | 9.1 | 14.01 | 23 | 70ee2MASS IRSA |
| NGC864 | 2.258 | 6.002 | -23.15 | 8.53 | 21.7 | 14.27 | 48 | 24 |
| NGC1073 | 2.728 | 1.376 | -22.15 | 8.98 | 16.8 | 11.40 | 38 | 32 |
| NGC1084 | 2.767 | -7.579 | -23.52 | 7.93 | 19.5 | 8.94 | 52 | 35 |
| NGC1187 | 3.044 | -22.868 | -23.33 | 8.10 | 19.4 | 15.44 | 48 | 129 |
| NGC1232 | 3.163 | -20.581 | -24.46 | 7.38 | 23.4 | 24.44 | 30 | 99 |
| NGC1637 | 4.691 | -2.857 | -22.01 | 7.97 | 9.9 | 4.71 | 32 | 13 |
| NGC1809 | 5.035 | -69.567 | -21.95 | 9.35 | 18.2 | 3.05 | 51 | 143 |
| NGC2835 | 9.298 | -22.356 | -22.54 | 7.92 | 12.3 | 12.00 | 50 | 3 |
| NGC2997 | 9.761 | -31.191 | -24.48 | 6.41 | 15.1 | 21.56 | 46 | 97 |
| NGC2976 | 9.788 | 67.917 | -20.43 | 7.52 | 3.9 | 3.28 | 61 | 143 |
| NGC3338 | 10.702 | 13.747 | -23.16 | 8.13 | 18.1 | 10.74 | 55 | 100ffHeraudeau & Simien 1996 |
| NGC3359 | 10.777 | 63.224 | -22.12 | 8.62 | 14.1 | 14.96 | 52 | 176 |
| NGC3486 | 11.007 | 28.975 | -21.88 | 8.00 | 9.5 | 9.29 | 45 | 80 |
| NGC3614 | 11.306 | 45.748 | -22.92 | 9.63 | 32.4 | 19.40 | 50 | 87 |
| NGC3631 | 11.351 | 53.169 | -23.05 | 7.99 | 16.1 | 11.44 | 35 | 118 |
| NGC3726 | 11.556 | 47.029 | -22.60 | 7.78 | 11.9 | 10.49 | 49 | 14 |
| NGC3938 | 11.880 | 44.122 | -22.44 | 7.81 | 11.2 | 8.11 | 13 | |
| NGC4254 | 12.314 | 14.417 | -25.70 | 6.93 | 33.5 | 26.05 | 29 | |
| NGC4535 | 12.572 | 8.198 | -24.79 | 7.38 | 27.2 | 27.30 | 41 | 180 |
| NGC4647 | 12.726 | 11.583 | -23.42 | 8.05 | 19.7 | 8.02 | 34 | 125 |
| NGC5236 (M83) | 13.617 | -29.865 | -24.65 | 4.62 | 7.1 | 14.47 | 24 | 48ee2MASS IRSA |
| NGC5426 | 14.057 | -6.067 | -23.31 | 9.50 | 36.4 | 15.80 | 62 | 1 |
| NGC5427 | 14.057 | -6.031 | -24.21 | 8.59 | 36.4 | 15.19 | 42 | |
| NGC5643 | 14.545 | -44.174 | -23.94 | 7.17 | 16.7 | 11.97 | 30 | 88 |
| NGC6215 | 16.852 | -58.993 | -23.40 | 8.28 | 21.6 | 6.67 | 44 | 83 |
| Galaxy | (J2000)aaHyperLeda Extragalactic Database (LEDA) | (J2000)aaHyperLeda Extragalactic Database (LEDA) | bb2MASS search engine GATOR | DccNED | aaHyperLeda Extragalactic Database (LEDA) | aaHyperLeda Extragalactic Database (LEDA) | PAaaHyperLeda Extragalactic Database (LEDA) | |
|---|---|---|---|---|---|---|---|---|
| (hours) | () | (mag) | (mag) | (Mpc) | (kpc) | () | () | |
| Scd Spirals | ||||||||
| NGC275 | 0.851 | -7.066 | -22.04 | 9.88 | 24.2 | 5.04 | 37 | 105 |
| NGC598 (M33) | 1.564 | 30.660 | -20.95 | 4.10 | 1.0 | 9.93 | 54 | 23 |
| NGC1494 | 3.962 | -48.908 | -21.15 | 9.82 | 15.6 | 7.90 | 64 | 1 |
| NGC2280 | 6.747 | -27.639 | -23.86 | 8.26 | 26.4 | 25.94 | 64 | 164 |
| NGC2283 | 6.765 | -18.211 | -21.46 | 8.83 | 11.4 | 6.33 | 43 | 175 |
| NGC2403 | 7.614 | 65.603 | -21.56 | 6.19 | 3.6 | 12.09 | 60 | 126 |
| NGC2541 | 8.244 | 49.061 | -19.36 | 10.09 | 7.8 | 6.55 | 62 | 167 |
| NGC3184 | 10.305 | 41.424 | -22.35 | 7.23 | 8.2 | 9.38 | 17 | |
| NGC3319 | 10.653 | 41.687 | -19.99 | 10.07 | 10.3 | 8.75 | 59 | 37 |
| NGC4654 | 12.732 | 13.126 | -23.05 | 7.74 | 14.4 | 10.49 | 58 | 122 |
| NGC5457 (M101) | 14.053 | 54.348 | -25.40 | 5.51 | 7.2 | 31.98 | 8 | 110ddMartin 1995 |
| NGC5474 | 14.084 | 53.662 | -16.89 | 9.48 | 1.9 | 1.21 | 42 | 79 |
| NGC6140 | 16.349 | 65.390 | -20.76 | 9.74 | 12.6 | 8.95 | 37 | 76 |
| NGC6946 | 20.581 | 60.154 | -23.40 | 5.37 | 5.7 | 9.37 | 30 | 62ddMartin 1995 |
| NGC7418 | 22.943 | -37.030 | -22.99 | 8.52 | 20.1 | 11.45 | 41 | 139 |
| NGC7424 | 22.955 | -41.071 | -21.33 | 9.25 | 13.1 | 14.88 | 41 | 115ee2MASS IRSA |
| Sd Spirals | ||||||||
| NGC300 | 0.915 | -37.685 | -20.66 | 6.38 | 2.6 | 7.50 | 48 | 114 |
| NGC337 | 0.997 | -7.578 | -22.70 | 9.10 | 22.9 | 9.61 | 53 | 60 |
| NGC925 | 2.455 | 33.579 | -21.56 | 7.87 | 7.7 | 12.60 | 57 | 102 |
| NGC1313 | 3.304 | -66.497 | -21.46 | 7.57 | 6.4 | 8.60 | 40 | 39 |
| NGC4145 | 12.167 | 39.884 | -22.26 | 8.48 | 14.1 | 11.67 | 55 | 100 |
| NGC4519 | 12.558 | 8.655 | -21.59 | 9.56 | 17.0 | 7.07 | 37 | 149 |
| NGC5068 | 13.315 | -21.039 | -22.30 | 7.55 | 9.3 | 10.11 | 26 | 110ddMartin 1995 |
| NGC5585 | 14.330 | 56.729 | -19.89 | 9.50 | 7.5 | 6.06 | 53 | 32 |
| NGC5556 | 14.343 | -29.242 | -21.86 | 9.55 | 19.2 | 11.82 | 48 | 143 |
| NGC7320 | 22.601 | 33.948 | -19.64 | 10.52 | 15.3 | 4.25 | 55 | 133 |
| NGC7793 | 23.964 | -32.591 | -21.15 | 6.86 | 4.0 | 5.91 | 58 | 84 |
| Galaxy | Typeaaas given in NED | PAbar | a bberror in measurement, see §2.2 | adeproj | |||
|---|---|---|---|---|---|---|---|
| (RC3) | () | () | () | (kpc) | |||
| Barred | |||||||
| S0/a Spirals | |||||||
| NGC1291 | SB0/a | 0.40 | 171 | 87 5 | 88 | 5.0 | 0.29 |
| NGC1317 | SAB(rl)0/a | 0.24 | 150 | 42 2 | 49 | 6.3 | 0.54 |
| NGC1326 | SB(rl)0/a | 0.37 | 20 | 30 3 | 39 | 3.6 | 0.30 |
| NGC2217 | SB(rs)0/a | 0.43 | 113 | 39 2 | 43 | 4.7 | 0.29 |
| NGC2681 | SAB(rs)0/a;Sy | 0.21 | 77 | 18 2 | 18 | 0.8 | 0.16 |
| NGC2655 | SAB(s)0/a | 0.32 | 85 | 33 5 | 53 | 5.0 | 0.37 |
| NGC5101 | SB(rl)0/a | 0.51 | 122 | 48 3 | 48 | 6.0 | 0.28 |
| Sa Spirals | |||||||
| NGC3718 | SB(s)a;pec;Sy1 | 0.20 | 12 | 60 3 | 65 | 4.3 | 0.29 |
| NGC4314 | SB(rs)a | 0.63 | 148 | 69 8 | 69 | 4.6 | 0.59 |
| NGC4491 | SB(s)a: | 0.54 | 138 | 24 3 | 25 | 0.8 | 0.52 |
| NGC7172 | Sa_pec_Sy2 | 0.51 | 96 | 45 5 | 46 | 8.0 | 0.68 |
| NGC7727 | SAB(s)a_pec | 0.21 | 87 | 27 2 | 33 | 4.2 | 0.27 |
| Sab Spirals | |||||||
| NGC1350 | SB(r)ab | 0.55 | 36 | 51 5 | 68 | 8.3 | 0.39 |
| NGC1398 | SB(rs)ab;Sy | 0.33 | 12 | 39 2 | 55 | 5.2 | 0.25 |
| NGC1433 | SB(rs)ab_Sy2 | 0.62 | 96 | 90 8 | 90 | 6.5 | 0.48 |
| NGC1512 | SB(r)ab | 0.64 | 44 | 72 3 | 77 | 4.7 | 0.25 |
| NGC4450 | SA(s)ab | 0.50 | 6 | 42 3 | 43 | 5.7 | 0.28 |
| NGC4725 | SAB(r)ab;pec | 0.65 | 48 | 132 9 | 139 | 11.2 | 0.43 |
| NGC4941 | SAB(r)ab_Sy2 | 0.53 | 16 | 93 6 | 94 | 7.1 | 0.88 |
| NGC5317 | SA(rs)bc;pec | 0.43 | 47 | 36 3 | 37 | 2.9 | 0.76 |
| NGC7552 | SB(s)ab | 0.59 | 96 | 48 3 | 48 | 5.2 | 0.43 |
| Sb Spirals | |||||||
| NGC1097 | SBb;Sy1 | 0.61 | 147 | 87 6 | 88 | 7.5 | 0.29 |
| NGC1365 | SBb(s)b;Sy1.8 | 0.59 | 85 | 90 5 | 152 | 13.3 | 0.45 |
| NGC3227 | SAB(s);pec;Sy | 0.59 | 151 | 57 8 | 58 | 4.5 | 0.39 |
| NGC772 | SA(s)b | 0.24 | 116 | 21 3 | 23 | 3.8 | 0.11 |
| NGC986 | SB(rs)b | 0.63 | 58 | 48 6 | 61 | 8.1 | 0.51 |
| NGC1068 | SA(rs)b;Sy1;2 | 0.33 | 48 | 15 2 | 15 | 1.2 | 0.07 |
| NGC1530 | SB(rs)b | 0.61 | 124 | 51 2 | 77 | 14.0 | 0.62 |
| NGC3351 | SB(r)b;HII | 0.43 | 113 | 57 3 | 103 | 5.4 | 0.45 |
| NGC3583 | SB(s)b | 0.40 | 76 | 21 2 | 33 | 4.8 | 0.47 |
| NGC3673 | SB(r)b | 0.68 | 83 | 45 3 | 48 | 6.3 | 0.42 |
| NGC4548 (M91) | SBb(rs);Sy | 0.49 | 60 | 57 2 | 70 | 2.3 | 0.45 |
| NGC4579 | SAB(rs)b;Sy1.9 | 0.46 | 59 | 39 3 | 42 | 4.3 | 0.25 |
| NGC4593 | SB(rs)b_Sy1 | 0.59 | 58 | 48 5 | 53 | 9.2 | 0.60 |
| NGC5383 | SB(rs)b:pec | 0.57 | 127 | 48 5 | 50 | 8.0 | 0.63 |
| NGC5850 | SB(r)b | 0.60 | 117 | 60 3 | 61 | 10.5 | 0.47 |
| NGC5985 | SAB(r)b;Sy1 | 0.59 | 15 | 48 3 | 48 | 8.1 | 0.31 |
| NGC6300 | SB(rs)b | 0.45 | 71 | 36 5 | 52 | 3.9 | 0.34 |
| Sbc Spirals | |||||||
| NGC289 | SAB(rs)bc | 0.48 | 122 | 21 2 | 21 | 2.3 | 0.13 |
| NGC613 | SB(rs)bc | 0.70 | 124 | 75 9 | 75 | 7.5 | 0.46 |
| NGC1300 | SB(s)bc | 0.75 | 103 | 84 9 | 84 | 8.7 | 0.45 |
| NGC1566 | SAB(rs)bc;Sy1 | 0.38 | 3 | 33 2 | 36 | 3.7 | 0.14 |
| NGC1672 | SB(r)bc_Sy2 | 0.63 | 96 | 72 6 | 102 | 7.7 | 0.50 |
| NGC2559 | SB(s)bc_pec: | 0.53 | 39 | 27 2 | 39 | 4.1 | 0.32 |
| NGC3344 | SAB(r)bc | 0.28 | 2 | 24 2 | 25 | 1.0 | 0.11 |
| NGC3882 | SB(s)bc | 0.57 | 124 | 33 2 | 36 | 4.4 | 0.47 |
| NGC3953 | SB(r)bc | 0.47 | 46 | 27 2 | 40 | 2.9 | 0.18 |
| NGC3992 (M109) | SB(rs)bc;LINER | 0.60 | 39 | 51 5 | 65 | 4.6 | 0.31 |
| NGC4051 | SAB(rs)bc | 0.65 | 134 | 63 3 | 63 | 3.0 | 0.41 |
| NGC4303 (M61) | SAB(rs)bc;HII | 0.59 | 3 | 48 3 | 48 | 5.1 | 0.26 |
| NGC4321 (M100) | SAB(s)bc;LINER | 0.51 | 106 | 57 3 | 66 | 7.0 | 0.29 |
| NGC4639 | SAB(rs)bc | 0.47 | 169 | 24 3 | 30 | 2.0 | 0.33 |
| NGC4930 | SB(rs)bc | 0.56 | 43 | 42 2 | 42 | 7.3 | 0.30 |
| NGC5054 | SA(s)bc | 0.31 | 162 | 21 2 | 21 | 2.5 | 0.15 |
| NGC5194 (M51A) | SA(s)bc | 0.27 | 139 | 15 2 | 16 | 0.5 | 0.06 |
| NGC5371 | SAB(rs)bc | 0.30 | 94 | 24 5 | 36 | 6.1 | 0.29 |
| NGC5347 | SB(rs)ab_Sy2 | 0.53 | 103 | 30 2 | 33 | 2.8 | 0.18 |
| NGC5713 | SAB(rs)bc;pec | 0.45 | 104 | 18 2 | 23 | 3.0 | 0.29 |
| NGC5921 | SB(r)bc | 0.58 | 16 | 39 3 | 50 | 5.0 | 0.38 |
| NGC6221 | SB(s)bc;pec;Sy2 | 0.43 | 117 | 24 2 | 47 | 4.7 | 0.35 |
| NGC6384 | SAB(r)bc | 0.50 | 35 | 24 2 | 28 | 3.2 | 0.19 |
| NGC6744 | SAB(r)bc | 0.68 | 179 | 90 8 | 95 | 5.4 | 0.15 |
| Galaxy | Typeaaas given in NED | PAbar | a bberror in measurement, see §2.2 | adeproj | |||
|---|---|---|---|---|---|---|---|
| (RC3) | () | () | () | (kpc) | |||
| Barred | |||||||
| Sc Spirals | |||||||
| NGC578 | SAB(rs)c | 0.53 | 84 | 18 2 | 22 | 2.4 | 0.16 |
| NGC864 | SAB(rs)c | 0.44 | 102 | 24 2 | 35 | 3.7 | 0.26 |
| NGC1073 | SB(rs)c | 0.66 | 59 | 45 3 | 48 | 3.9 | 0.34 |
| NGC1187 | SB(r)c | 0.56 | 134 | 36 3 | 36 | 3.4 | 0.22 |
| NGC1232 | SAB(rs)c | 0.42 | 86 | 21 3 | 21 | 2.4 | 0.10 |
| NGC1637 | SAB(rs)c | 0.43 | 68 | 24 3 | 27 | 1.3 | 0.28 |
| NGC2835 | SAB(rs)c | 0.41 | 115 | 21 2 | 31 | 1.9 | 0.15 |
| NGC3359 | SB(rs)c | 0.68 | 7 | 42 5 | 43 | 2.9 | 0.20 |
| NGC3486 | SAB(r)c | 0.39 | 73 | 21 2 | 21 | 1.0 | 0.10 |
| NGC3614 | SAB(r)c | 0.39 | 87 | 27 2 | 27 | 4.2 | 0.22 |
| NGC3631 | SA(s)c | 0.40 | 13 | 51 6 | 61 | 4.8 | 0.42 |
| NGC3726 | SAB(r)c | 0.70 | 31 | 39 3 | 41 | 2.4 | 0.23 |
| NGC4535 | SAB(s)c | 0.62 | 37 | 45 9 | 51 | 6.7 | 0.25 |
| NGC4647 | SAB(rs)c | 0.21 | 88 | 21 2 | 23 | 2.2 | 0.27 |
| NGC5236 (M83) | SAB(s)c;Sbrst | 0.56 | 58 | 114 5 | 114 | 4.0 | 0.27 |
| NGC5643 | SAB(rs)c | 0.65 | 84 | 54 5 | 54 | 4.4 | 0.36 |
| Scd Spirals | |||||||
| NGC2283 | SB(s)cd | 0.55 | 173 | 12 2 | 12 | 0.7 | 0.11 |
| NGC2403 | SAB(s)cd | 0.41 | 113 | 15 2 | 16 | 0.3 | 0.02 |
| NGC5457 (M101) | SAB(rs)cd | 0.45 | 82 | 51 2 | 51 | 1.8 | 0.06 |
| NGC6946 | SAB(rs)cd | 0.46 | 17 | 60 2 | 65 | 1.8 | 0.19 |
| NGC7418 | SAB(rs)cd | 0.61 | 126 | 30 2 | 31 | 3.0 | 0.26 |
| NGC7424 | SAB(rs)cd | 0.51 | 130 | 18 3 | 18 | 1.2 | 0.08 |
| Sd Spirals | |||||||
| NGC337 | SB(s)d | 0.45 | 162 | 21 6 | 35 | 3.9 | 0.40 |
| NGC1313 | SB(s)d | 0.59 | 15 | 33 9 | 35 | 1.1 | 0.13 |
| NGC4145 | SAB(rs)d;LINER | 0.34 | 135 | 12 3 | 16 | 1.1 | 0.09 |
| NGC5068 | SB(s)d | 0.55 | 149 | 21 3 | 22 | 1.0 | 0.10 |
| NGC5556 | SAB(rs)d | 0.48 | 93 | 15 2 | 20 | 1.8 | 0.16 |
| Barred Candidates | |||||||
| Sa Spirals | |||||||
| NGC1022 | SB(s)a;Sbrst | 0.42 | 108 | 18 2 | 22 | 2.1 | 0.28 |
| NGC1367 | SABa | 0.39 | 104 | 24 2 | 28 | 2.8 | 0.16 |
| NGC5728 | SAB(r)a;Sy2 | 0.66 | 33 | 54 3 | 72 | 13.0 | 0.76 |
| Sab Spirals | |||||||
| NGC4151 | SAB(rs)ab | 0.48 | 132 | 63 5 | 82 | 5.5 | 0.45 |
| Sb Spirals | |||||||
| NGC210 | SAB(s)b | 0.47 | 173 | 33 3 | 34 | 3.7 | 0.24 |
| NGC7606 | SA(s)b | 0.61 | 142 | 36 5 | 36 | 5.4 | 0.28 |
| Sbc Spirals | |||||||
| NGC2207 | SAB(rs)bc_pec | 0.42 | 64 | 24 3 | 42 | 7.7 | 0.30 |
| NGC4567 (VV219B) | SA(rs)bc | 0.45 | 58 | 30 6 | 33 | 5.1 | 0.40 |
| Sc Spirals | |||||||
| NGC2976 | SAc;pec | 0.69 | 137 | 72 5 | 73 | 1.4 | 0.42 |
| Scd Spirals | |||||||
| NGC275 | SB(rs)cd_pec | 0.35 | 78 | 12 3 | 13 | 1.5 | 0.30 |
| NGC1494 | SAB(rs)cd | 0.47 | 174 | 15 3 | 16 | 1.2 | 0.15 |
| NGC2280 | SA(s)cd | 0.60 | 153 | 48 3 | 52 | 6.7 | 0.26 |
| PropertyaaMedian value standard deviation | 2MASS Bar | Early-Type 2MASS Bar | Late-Type 2MASS Bar |
|---|---|---|---|
| (S0/a-Sd) | (Sa-Sb) | (Sc-Sd) | |
| (kpc) | 4.2 2.9 | 5.4 3.3 | 2.2 1.7 |
| / | 0.29 0.17 | 0.43 0.18 | 0.22 0.11 |
| 0.50 0.13 | 0.54 0.13 | 0.48 0.12 | |