Evidence for bipolar jets from the optical spectra of the prototypical symbiotic star Z Andromedae ††thanks: Based on observations collected at Tartu Observatory, Estonia
Abstract
Aims. We have studied optical spectra of the symbiotic star Z And, obtained during its latest outburst started in April 2006, with the aim of finding changes in the spectrum yielding clues to the nature of the hot component and its outbursts.
Methods. The spectroscopic observations of Z And have been made using the 1.5-meter telescope at the Tartu Observatory, Estonia, and processed in a standard way.
Results. We have found high velocity satellites to the hydrogen Balmer emission lines. Starting from July 30, 2006, weak additional emission components at velocities of about 1150 km s-1 were detected. Their appearance near the outburst maximum and similarity to the emission features in another symbiotic star Hen 3-1341 imply fast collimated outflows from the hot component of Z And. This finding is consistent with the earlier results by several authors that symbiotic stars can emit bipolar jets at certain stages of their outbursts. A significant decrease in the temperature of the hot component in initial stages of the outburst was detected by the disappearance of the high excitation emission lines from the spectrum.
Key Words.:
stars: outflows – binaries: symbiotic – stars: individual: Z And1 Introduction
Z Andromedae is considered to be the prototype for the class of symbiotic stars (Kenyon ken86 (1986); Corradi et al. corr03 (2003)) – interacting binary stars consisting of a red giant and a hot compact companion, mostly a white dwarf. The hot component ionises part of the wind of the red giant, thus giving rise to the characteristic ”combination” spectrum where high excitation emission lines are superimposed on the cool giant’s spectrum. Z~And has an orbital period of 757.5 days (Mikołajewska & Kenyon miken96 (1996)) and an orbital inclination of (Schmid & Schild schsch (1997)). Its light curve represents classical symbiotic star outbursts, demonstrating brightening of the star by 2–3 magnitudes in the visual region in every few years. Z And is also the only symbiotic star for which coherent optical oscillations with the period of 28 minutes have been detected, most likely indicating the presence of a strongly magnetic WD (Sokoloski & Bildsten sokbi (1999)). Finally, Z And is among about 10 known symbiotic stars, producing collimated outflows or jets (Brocksopp et al. bro04 (2004); Leedjärv leed04 (2004)). Extended collimated outflows perpendicular to the orbital plane were detected from radio images during the 2000–2002 outburst (Brocksopp et al. bro04 (2004)).
Behaviour of Z And during the outburst and the following quiescence in 2000–2003 was extensively studied and analysed by Sokoloski et al. (sok06 (2006)). They proposed to call Z And and possibly other classical symbiotic stars ’combination novae’, indicating that both dwarf nova-like accretion disk instability and nova-like nuclear shell burning are involved in the outbursts of classical symbiotic stars. According to the visual photometric observations from the AAVSO database, a new outburst of Z And began in early June 2004. Having hardly recovered from this outburst, the star started a new activity cycle in April 2006. In the present paper we describe and analyse the optical spectra of Z And, obtained mostly during decline from the optical maximum in 2006. Section 2 describes the observations and in Sect. 3 we present and analyse evidence for fast bipolar outflows during the outburst of Z And. Section 4 contains conclusions.
2 Observations
Spectroscopic observations of Z And have been carried out at the Tartu Observatory, Estonia, using the 1.5-meter telescope equipped with the Cassegrain grating spectrograph. Two different CCD cameras from the SpectraSource Instruments were used until March 2006. Later on the spectra are registered with the Andor Technologies CCD camera Newton USB-207 with chip, pixel size m, Peltier cooled. A few occasional spectra of Z And have been obtained since September 1997, mostly in the region of H. A more systematic monitoring started on July 30, 2006, after detecting the signs for bipolar jets.
Most of the red spectra cover the wavelength region 64806730 Å, with linear dispersion about . Blue spectra are mostly taken in the 46005060 Å region with . Some of the lower dispersion spectra (about and , respectively) are also used. The spectra were reduced using the software package MIDAS provided by ESO. After standard procedures of subtracting the bias and sky background, the spectra were reduced to the wavelength scale using the Th-Ar hollow cathode lamp spectrum for calibration. Thereafter, the spectra were normalised to the continuum, and positions, peak intensities, and equivalent widths of the emission lines were measured.
3 Results and discussion
Both H and H lines have a central emission component at radial velocities of about 30 km s-1. The shape of the profiles is asymmetric with the blue wing distorted by absorption. On August 7 and 9, the blue step of the H line deepens into an absorption component (Fig. 1).
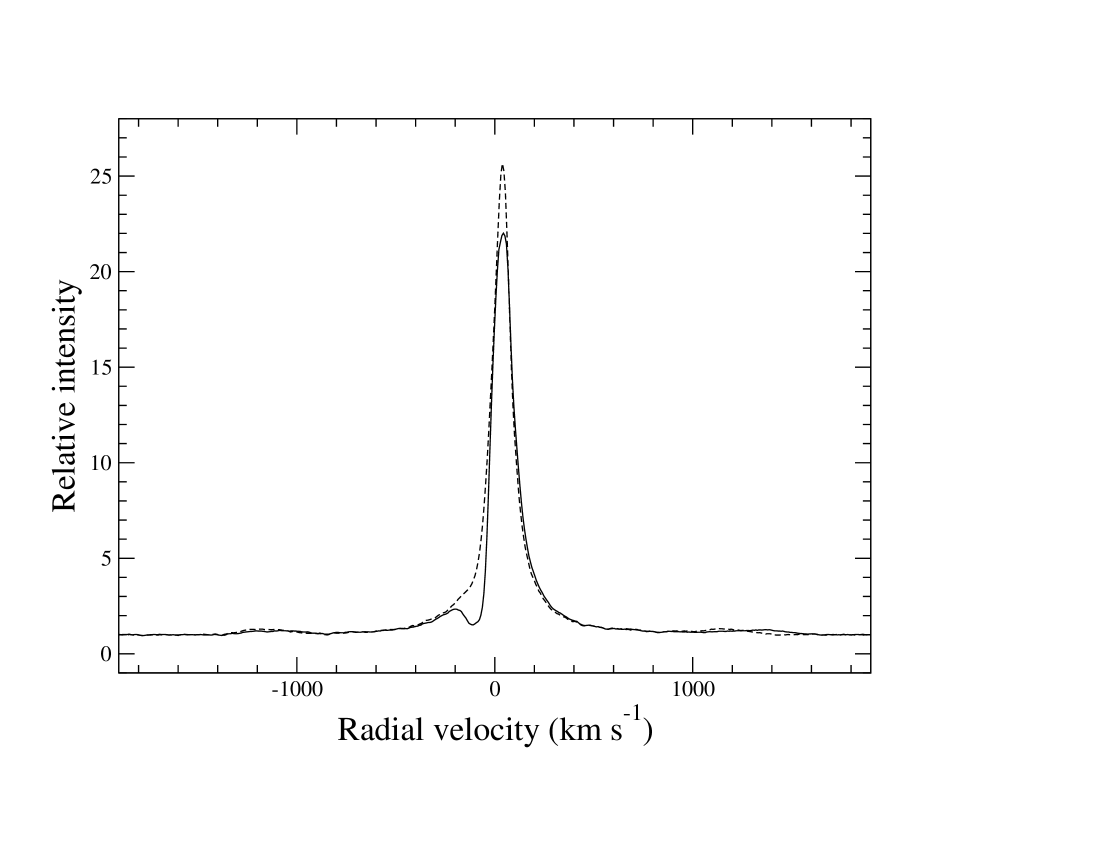
A similar absorption is seen in H on September 1.
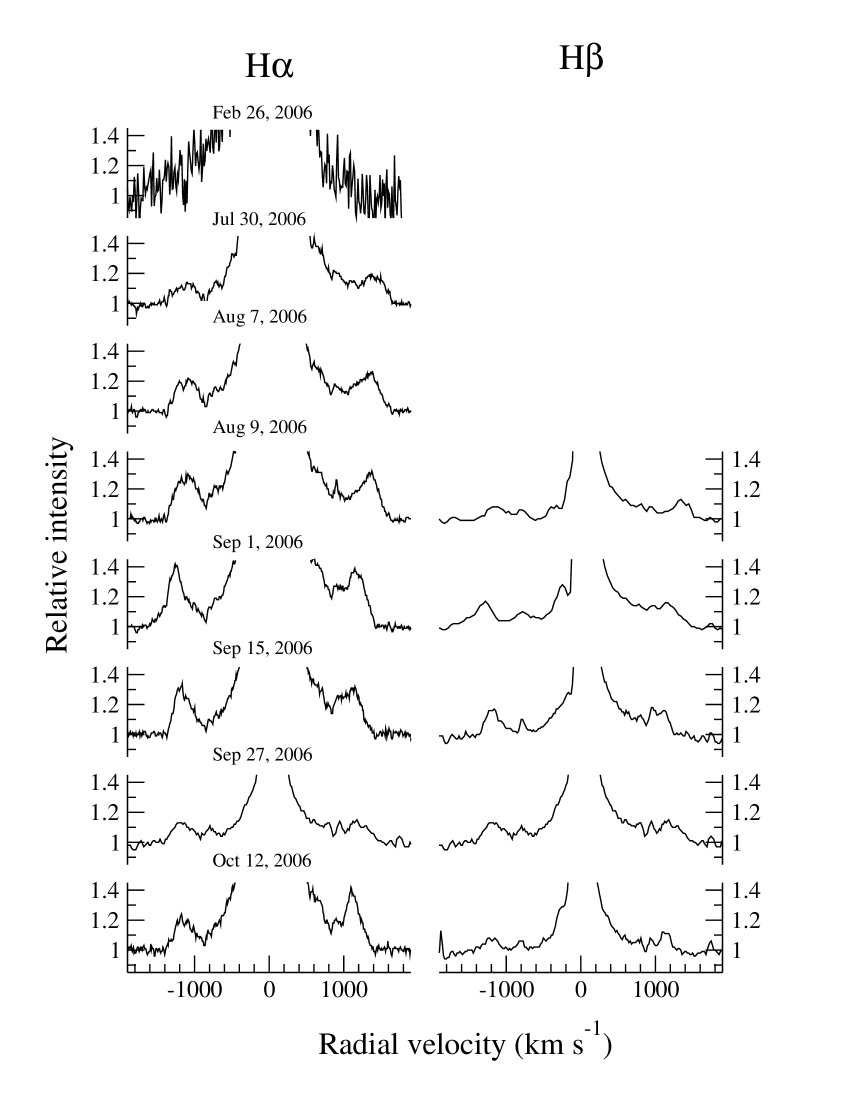
The most striking features of these Balmer lines, however, are the satellite emission components (see Fig. 2), detected for the first time on July 30, 2006 in the H line. We are not aware of observations of similar features in the spectrum of Z And before. On September 14, 2006, a telegram on the detection of jets in Z And was published by Skopal & Pribulla (skopri (2006)). Very similar additional emission features were discovered in the spectra of the symbiotic stars Hen 3-1341 by Tomov et al. (tomov (2000)), and StH$α$~190 by Munari et al. (mun01 (2001)), who interpreted them to be emitted by the collimated bipolar jets.
| Date | JD - | H | H | ||
|---|---|---|---|---|---|
| 2006 | 2 400 000 | Blue | Red | Blue | Red |
| Jul 30 | 53947.5 | -1114 | 1391 | ||
| Aug 7 | 53955.5 | -1115 | 1271 | ||
| Aug 9 | 53957.4 | -1106 | 1275 | -969 | 1376 |
| Aug 10 | 53958.5 | -1134 | 1280 | ||
| Sep 1 | 53980.4 | -1243 | 1165 | -1288 | 1160 |
| Sep 10 | 53989.4 | -1150 | 1157 | -1180 | 1084 |
| Sep 12 | 53991.4 | -1193 | 1145 | -1217 | 1127 |
| Sep 13 | 53992.5 | -1180 | 1067 | -1191 | 1061 |
| Sep 15 | 53994.4 | -1156 | 1059 | -1176 | 1039 |
| Sep 21 | 54000.4 | -1081 | 1100 | -1070 | 1098 |
| Sep 24 | 54003.5 | -1114 | 1087 | -1162 | 1137 |
| Sep 27 | 54006.4 | -1115 | 1107 | -1150 | 1134 |
| Oct 6 | 54015.3 | -1106 | 1110 | ||
| Oct 12 | 54021.4 | -1124 | 1108 | -1196 | 1134 |
| Mean | -113841 | 116696 | -116082 | 113588 | |
We fitted these emission components with a Gaussian to find their radial velocities. The results are given in Table 1. On average the RVs are about . Given the asymmetric shape of the additional components, the accuracy of those velocities is no better than about 4050 km s-1. If we assume that the jets are perpendicular to the orbital plane and the inclination of the orbit is , the true velocities of the jets are close to .
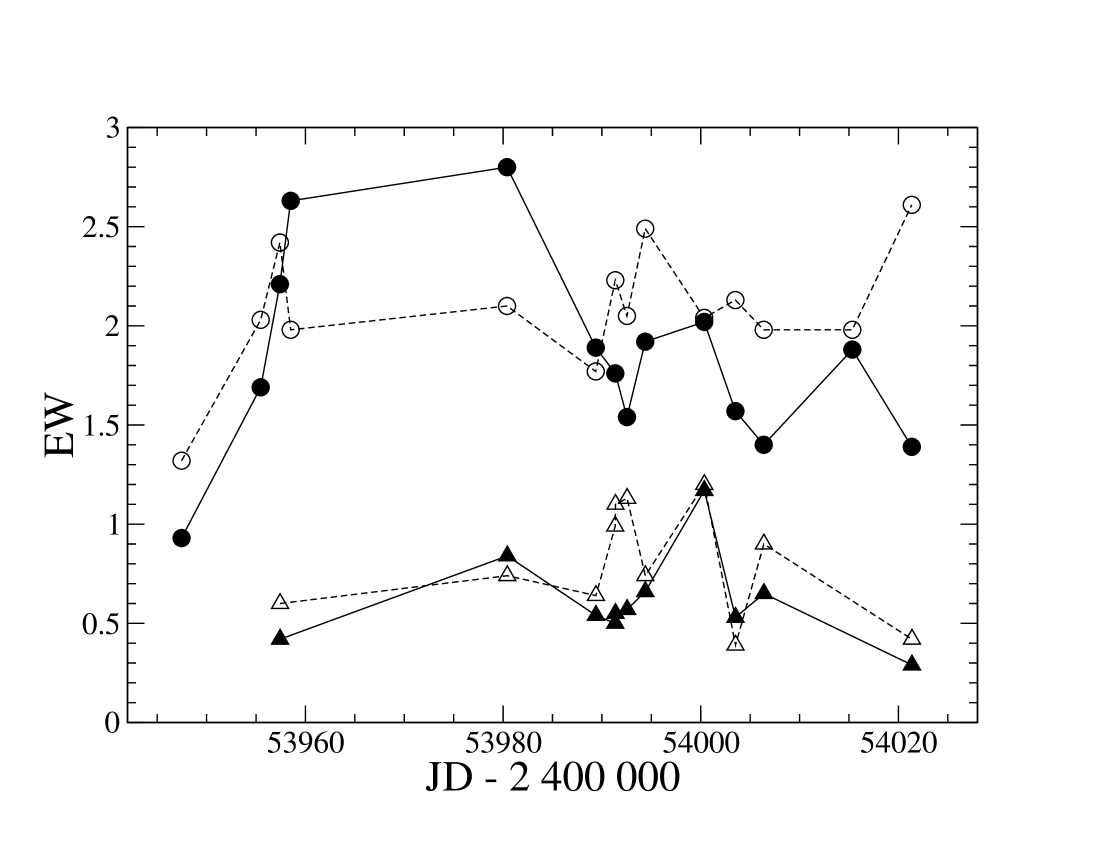
The equivalent widths of the supposed jet components form about 2% of that of the central emission, but these estimates are uncertain, as the small emissions are partly blended in the central component. The measured values of EWs are plotted in Fig. 3.
At least in some of the red spectra, weak [N II] 6548 and 6584 emission lines can be distinguished at the low-velocity sides of H jet components. Where measurable, the velocities of the [N II] lines occur at about 45 km s-1.
According to the AAVSO light curve, the optical maximum of Z And took place in early July 2006 (around JD 2 453 920 930). Our last optical spectrum before the outburst was made on February 26, 2006. No signs of jets are seen in this spectrum, so the jets must have been formed at some time between February and July. For most of the time of our observations, the jet features in the spectrum have been rather stable. Smaller EWs on July 30 possibly indicate the early phase of jet development.
Such an appearance of the jets at the time of the optical maximum fits the behaviour of another symbiotic star Hen~3-1341 as described by Munari et al. (mun05 (2005)) well. In general, collimated bipolar jets are observed from several types of stars, such as, e.g., X-ray binaries, supersoft X-ray sources, young stellar objects, etc., and of course, from active galactic nuclei. The standard scenario for the production of jets (e.g., Livio livio (1997); Lynden-Bell lynd (2003), and many later references) includes an accretion disc that is threaded by a vertical magnetic field. In addition, an energy or wind source associated with the central accreting object is needed. This requirement explains, for instance, the absence of jets from magnetic cataclysmic variables, in spite of the presence of an accreting white dwarf and magnetic field. The behaviour of Hen 3-1341 well demonstrates that the jets are emitted only in the early and the brightest phase of the outburst, and that they are fed by the wind from the outbursting component (Munari et al. mun05 (2005)). The outburst of Hen 3-1341, however, lasted longer (from 1998 to 2004) than those of Z And usually do.
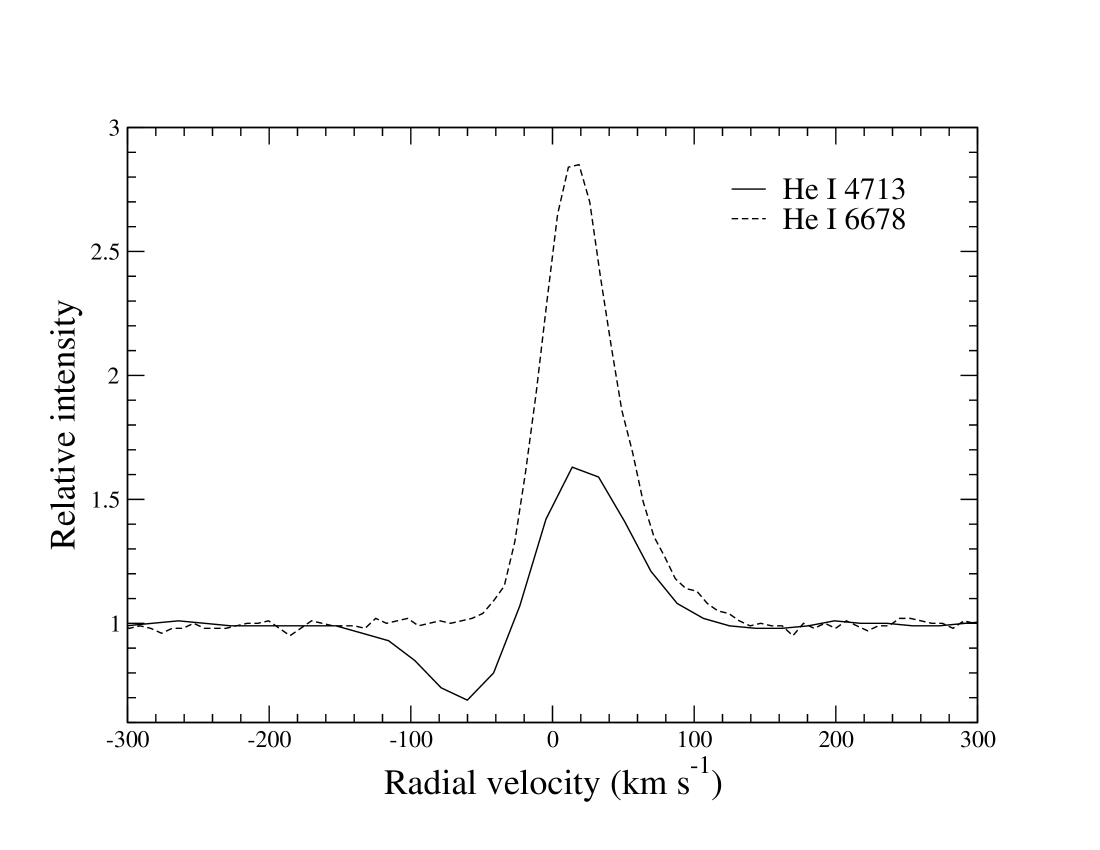
The wings of the H main emission component extend to about km s-1, which may indicate fast wind from the outbursting hot component. On the other hand, indications of low-velocity outflow can be seen in the lines of He I 4471, 4713, and 5016, which present P Cygni profiles with deep absorption components. The development of the P Cygni profile of He I 4713 is seen in Fig. 4. Velocity of the outflow measured from these lines is between and km s-1. This is comparable to the velocity 90 kms-1 found by Skopal et al. (skopal (2006)) during the 2000–2003 outburst. At the same time, the He I 4922 and 6678 lines are fully in emission or have only a very weak absorption component. Figure 5 presents an example.
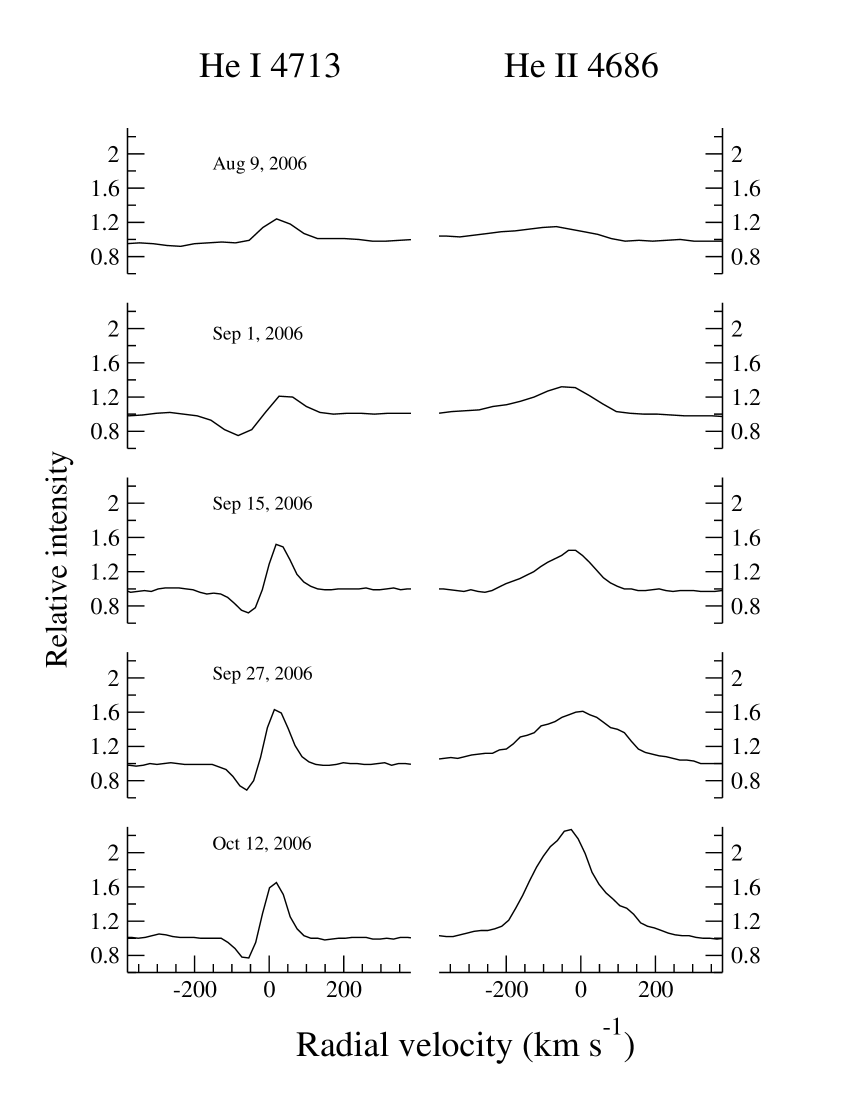
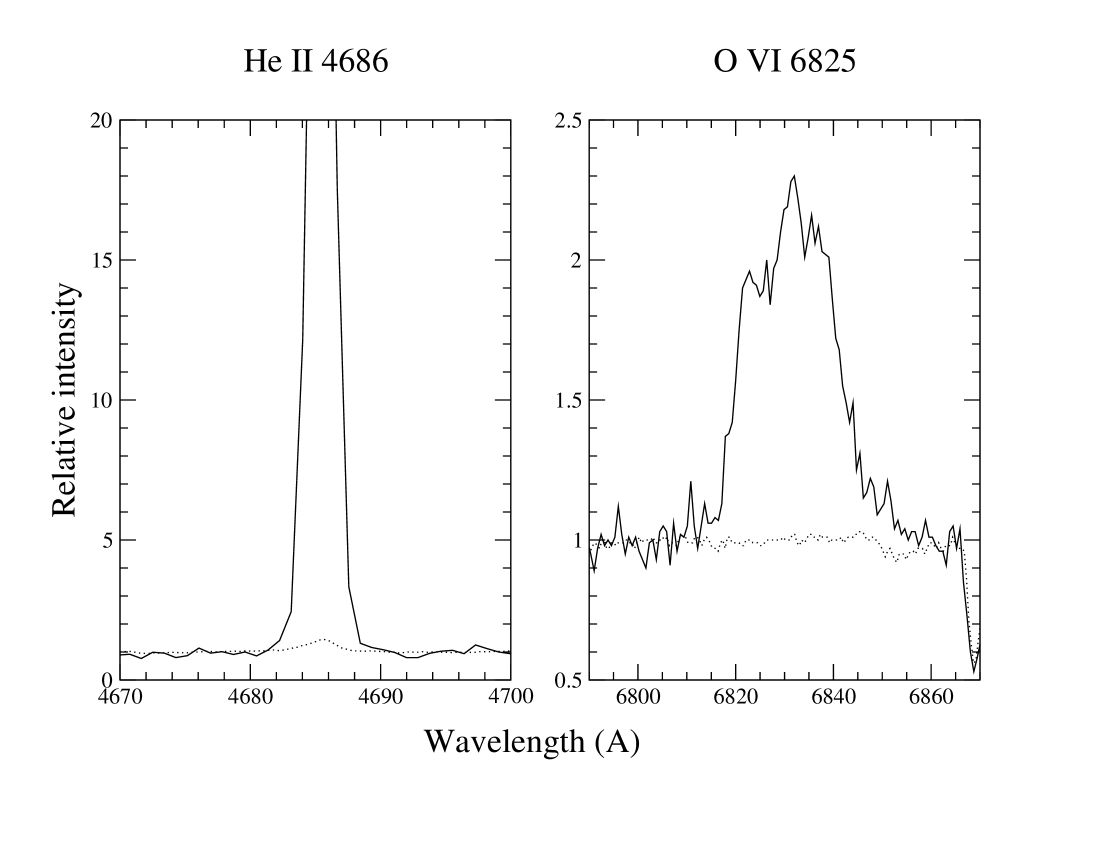
The present outburst of Z And is similar to that of Hen 3-1341 also by the behaviour of other emission lines. It is known that high excitation emission lines tend to weaken during the outbursts of symbiotic stars. In Hen 3-1341, the He II 4686 and the Raman scattered O VI line at 6825 disappeared completely. Similar changes in the spectrum of Z And during the 2000–2003 outburst were reported by Skopal et al. (skopal (2006)) and Sokoloski et al. (sok06 (2006)). We also an detected almost complete disappearance of the Raman scattered line at 6825 and of the He II 4686 line in the spectrum of Z And during the present outburst in 2006. Figure 6 presents the comparison of those spectral lines from the quiescence in September 1997 and from the outburst in September 2006. In Fig. 4, the gradual reappearance of the He II 4686 line is seen while the brightness of the star decreases.
| Date | JD - | Temperature |
|---|---|---|
| 2006 | 2 400 000 | (K) |
| Aug 9 | 53957.438 | 76 000 |
| Sep 10 | 53989.398 | 91 000 |
| Sep 12 | 53991.346 | 80 000 |
| Sep 13 | 53992.549 | 75 000 |
| Sep 15 | 53994.394 | 81 000 |
| Sep 21 | 54000.363 | 87 000 |
| Sep 24 | 54003.519 | 91 000 |
| Sep 27 | 54006.388 | 100 000 |
| Oct 12 | 54021.368 | 114 000 |
We made an attempt to estimate the effective temperature of the hot component during our observations by using the method proposed by Iijima (iijima (1981)). Like Sokoloski et al. (sok06 (2006)) we used equivalent widths of H and He II 4686 instead of fluxes and neglected the He I 4471 line. The temperatures in August and September tend to be low, falling in the range 75 000–90 000 K, and begin to rise at the end of September. The results are given in Table 2. A similar decline of at the brightness maximum and its gradual increase after the maximum was found by Sokoloski et al. (sok06 (2006)) during the 2000–2003 outburst. On the contrary, increased from the quiescence value of K to about 180 000 K during the smaller scale short outburst in 1997. Those facts imply similarity with another classical symbiotic star AG~Dra in which González-Riestra et al. (gonz99 (1999)) have distinguished between cool and hot outbursts, based on the changes in the He II Zanstra temperature. The outbursts of Z And in 2000 and 2006 can be considered as cool ones and that in 1997 as hot outburst. It might be of interest to note that AG Dra has also been in outburst since July 2006. We will describe spectroscopic behaviour of AG Dra in another forthcoming paper. Here we only note that during the present outburst the He II 4686 line and the Raman scattered O VI line 6825 also became very weak in the spectrum of AG Dra. This is different from smaller scale outbursts of AG Dra in the late 1990s – early 2000s when all the emission lines became stronger (e.g., Tomov & Tomova tom02 (2002); Leedjärv et al. leedb04 (2004)).
4 Conclusions
From our observations of the prototypical symbiotic star Z And we can conclude the following:
(1) The additional emission components of the hydrogen H and H lines at km s-1 indicate ejection of bipolar jets starting from late July 2006, and persisting for at about three months, at least. Taking into account the orbital inclination 47, ejection velocity of the jets would be about 1700 km s-1.
(2) Although Z And has been extensively studied over the past decades, no such jets were detected from the optical spectra before. We have some spectra in the H region near the brightness maximum of the 2004 outburst, but no additional emission components can be found from these. According to Skopal et al. (skopal (2006)), no signs of jets could be seen during the maximum of the 2000–2003 outburst. Spectra by Sokoloski et al. (sok06 (2006)) from the same time have too low resolution to confirm the existence or absence of additional emissions. We also have one spectrum from August 25, 2001, which was taken almost at the same time when Brocksopp et al. (bro04 (2004)) discovered the radio jets from Z And. In our spectrum, the jets are not seen. This most likely means that the jets are transient phenomenon, emitted only for a short time in the brightest phase of the outbursts, thus confirming the standard scenario for jet ejection in which an additional source of energy or wind is needed besides the accreting central body and magnetic field.
(3) The high excitation lines He II 4686 and Raman scattered O VI 6825 almost disappeared from the spectrum of Z And in the early phase of the outburst, confirming that the temperature of the hot component decreased to about 75 000 K, as was found by the Iijima method. In September 2006, about 3–4 months after the start of the outburst, the He II 4686 line started to become stronger again.
The ongoing outburst of Z And has shown that new aspects can be found in the behaviour of such well studied symbiotic stars. Together with the combination nova model proposed by Sokoloski et al. (sok06 (2006)), new clues for understanding the outbursts of AG Dra, Hen 3-1341, and other classical symbiotic stars can be obtained. Continuing monitoring of the ongoing outburst of Z And is strongly encouraged.
Acknowledgements.
The authors thank Dr. Kalju Annuk for taking some of the spectra of Z And and for useful comments on the manuscript of the paper. We also thank our referee, Dr. Michael Bode, for his suggestions. The present study was supported by the Estonian Ministry of Education and Research under the target financed project 0062464S03 ”Structure, chemical composition, and evolution of stars” and by the Estonian Science Foundation grant No 6810.References
- (1) Brocksopp, C., Sokoloski, J.L., Kaiser, C., et al. 2004, MNRAS, 347, 430
- (2) Corradi, R.L.M., Mikołajewska, J., & Mahoney, T.J. (eds.) 2003, Symbiotic Stars Probing Stellar Evolution, ASP Conf. Series, Vol. 303
- (3) González-Riestra, R., Viotti, R., Iijima, T., & Greiner, J. 1999, A&A, 347, 478
- (4) Iijima, T. 1981, In: Photometric and Spectroscopic Binary Systems, eds. E.B. Carling & Z. Kopal, Dordrecht, Kluwer, 517
- (5) Kenyon, S.J. 1986, The Symbiotic Stars, Cambridge University Press
- (6) Leedjärv, L. 2004, Baltic Astronomy, 13, 109
- (7) Leedjärv, L., Burmeister, M., Mikołajewski, M., et al. 2004, A&A, 415, 273
- (8) Livio, M. 1997, In: Wickramasinghe, D.T., Bicknell, G.V., Ferrario, L. (eds.), Accretion Phenomena and Related Outflows, ASP Conf. Series, Vol. 121, 845
- (9) Lynden-Bell, D. 2003, MNRAS, 341, 1360
- (10) Mikołajewska, J., & Kenyon, S.J. 1996, AJ, 112, 1659
- (11) Munari, U., Tomov, T., Yudin, B. F., et al. 2001, A&A, 369, L1
- (12) Munari, U., Siviero, A., & Henden, A. 2005, MNRAS, 360, 1257
- (13) Schmid, H.M., & Schild, H. 1997, A&A, 327, 219
- (14) Skopal, A., & Pribulla, T. 2006, Astronomers Telegram, 882
- (15) Skopal, A., Vittone, A.A., Errico, L. et al. 2006, A&A, 453, 279
- (16) Sokoloski, J.L., & Bildsten, L. 1999, ApJ, 517, 919
- (17) Sokoloski, J.L., Kenyon, S.J., Espey, B.R., et al. 2006, ApJ, 636, 1002
- (18) Tomov, N. A., & Tomova, M. T. 2002, A&A, 388, 202
- (19) Tomov, T., Munari, U., & Marrese, P. M. 2000, A&A, 354, L25