11email: rainer,eckart,muzic,meyer@ph1.uni-koeln.de 22institutetext: Max-Planck-Institut für Radioastronomie, Auf dem Hügel 69, D-53121 Bonn 33institutetext: Astronomy Department and Radio Astronomy Laboratory, University of California, Berkeley. CA 94720
The possibility of detecting Sagittarius A* at m
Abstract
Context. Sagittarius A* (Sgr A*) at the center of the Milky Way is a black hole accreting at extremely sub-Eddington rates. Measurements of its emission in the infrared and X-ray domains are difficult due to its faintness and high variability.
Aims. The Galactic Center was observed at 8.6 m in order to detect a mid-infrared (MIR) counterpart of Sgr A*, parallel to NIR observations. The goal was to set constraints on possible emission mechanisms.
Methods. Imaging data were acquired with the adaptive optics assisted NIR instrument NACO and the MIR instrument VISIR at the ESO VLT.
Results. We present MIR imaging data of an unprecedented quality in terms of spatial resolution and sensitivity. An extended ridge of emission is found to be present in the immediate vicinity of Sgr A* and thus renders any detection of a point source difficult. No MIR point source related to Sgr A* was detected during the observations. We derive a tight upper limit of mJy (dereddened) on any possible point source present during the observations in the night of 4/5 June 2006. The absence of a flare in simultaneous observations at 2.2 m and the low limits on any possible variability in the MIR suggest strongly that Sgr A* was in a quasi-quiescent state during this night. During the night from 5 to 6 June 2006, Sgr A* was found to be variable on a low level at 3.8 m. No point source at 8.6 m was detected during the simultaneous MIR observations. Due to the poorer atmospheric conditions a higher upper limit of 6030 mJy was found for Sgr A* at 8.6 m during the second night.
Conclusions. The observations are consistent with theoretical predictions. If the published models are correct, the observations demonstrate successfully that a 8.6 m counterpart of Sgr A* can be easily detected in its flaring state. Spectral indices derived from simultaneous observations of flaring emission from Sgr A* at NIR and MIR wavelengths will enable us to distinguish between different kinds of flare models.
Key Words.:
Galaxy: center – Galaxies: nuclei – Accretion, accretion disks1 Introduction
The center of the Milky Way harbors a supermassive black hole of M⊙ (e.g., Schödel et al. 2002; Ghez et al. 2003; Eisenhauer et al. 2005). The non-thermal source related to this supermassive black hole, Sagittarius A* (Sgr A*), radiates at only times its Eddington luminosity from radio wavelengths to the X-ray domain. Its low luminosity is consistent with emission from so-called radiatively inefficient accretion flows, a jet or a combination of the two models (e.g., Yuan et al. 2002, 2003; Bower et al. 2004; Shen et al. 2005).
X-ray and near-infrared (NIR) counterparts to Sgr A* were only discovered with the availability of sensitive, high-resolution instruments for these wavelengths. It was found that Sgr A* is highly variable at these wavelengths, showing flaring emission on time scales of min, with flux increases up to 100 at X-rays and up to 10 in the NIR (e.g., Baganoff et al. 2001; Genzel et al. 2003). The variability at X-ray and IR wavelengths appears to be simultaneous (Eckart et al. 2004, 2006a). At MIR wavelengths, only upper limits to the flux of Sgr A* have been reported so far (Stolovy et al. 1996; Telesco et al. 1996; Cotera et al. 1999; Eckart et al. 2006a). The detection of Sgr A* at MIR wavelengths is difficult due to the lower spatial resolution compared to NIR wavelengths, the general difficulties of imaging in the thermal IR regime, and the presence of warm dust near Sgr A*. Warm dust is associated with the mini-spiral gas streamers that pass close to Sgr A*. Therefore, Sgr A* is no isolated point source in the MIR and its detection requires high image quality, above all high spatial resolution, in order to achieve a sufficiently high contrast. Here, we report on new MIR observations, using the European Southern Observatory’s MIR imager and spectrograph VISIR at the Very Large Telescope (VLT) on Cerro Paranal in Chile.
Although Sgr A* was not detected, the acquired images are – in terms of sensitivity and spatial resolution – the highest quality m-images of the Galactic Center (GC) region published up to now, allowing us to report the so far tightest upper limit on the m flux of Sgr A*. Even more interesting is that we can show – via simultaneously acquired adaptive optics NIR imaging data – that the infrared flux of Sgr A* agrees well with models of the quiescent/low activity emission. This information allows us to conclude that –according to currently accepted theoretical models – Sgr A* can be easily detected at MIR wavelengths during a bright flare. Such an observation will allow to derive the NIR-to-MIR spectral slope of Sgr A* during flares and thus to distinguish between different flare models.
2 Observations and calibration
The GC was observed in the MIR N-band with the ESO VLT unit telescope 3 (UT 3) using the MIR imager/spectrograph VISIR (Lagage et al. 2003, 2004) in the nights of 4/5 and 5/6 June 2006. The pixel scale was per pixel. The PAH 1 filter with a central wavelength of m and half-band width of m was used. The standard nodding ( east of north) and chopping (with a chop throw of ) technique was used. Standard data reduction was applied, i.e. the sky background acquired during the chopping and nodding observations was subtracted from the images of the target and individual frames were combined with a simple shift-and-add technique. Dithering was applied during the observations, leading to a FOV in the combined mosaic images of . The seeing during the observations on 5 June 2006 was good enough to result in a PSF FWHM of , close to the diffraction limit of the VLT at 8.6 m.
In this work, we use also NIR imaging data that were obtained parallel to the MIR data with the adaptive optics imager/spectrograph NACO at the ESO VLT. On June 5, the data were obtained in the Ks-band in polarimetric mode with a pixel scale of per pixel. The data reduction and flux calibration was identical to the procedures described in Eckart et al. (2006b) and in Meyer et al. (2006, A&A, in press). The L’-band ( m) imaging data were obtained with NACO/VLT on 29 May and 6 June 2006 with a pixel scale of per pixel. The reduction of the L’-band data was standard and identical to the data reduction procedures described in Muzic et al. (2006, submitted to A&A). Details of the NIR and MIR observations are listed in Tab. 1.
| Date | [UTC] | [UTC] | [m] | [m] | [s] | seeing [′′] | ||
|---|---|---|---|---|---|---|---|---|
| 29 May 2006 | 04:55 | 08:01 | 3.80 | 0.62 | 0.2 | 150 | 108 | |
| 05 June 2006 | 04:55 | 08:01 | 8.59 | 0.42 | 0.02 | 98 | 1104 | |
| 06 June 2006 | 04:33 | 07:37 | 8.59 | 0.42 | 0.02 | 98 | 1104 | |
| 05 June 2006 | 04:55 | 08:01 | 2.18 | 0.35 | 30 | 1 | 62 | |
| 06 June 2006 | 04:33 | 07:37 | 3.80 | 0.62 | 0.2 | 150 | 1104 |
Flux calibration was achieved by observations of the standard star HD178345 ( Jy in the PAH 1 filter, see ESO VISIR web site and Cohen et al. 1999). The isolated standard star was also used as PSF reference for image deconvolution.
The astrometric reference frame could be established via the positions and proper motions of the stars IRS 3, IRS 7, IRS 9, IRS 14NE, IRS 12N, IRS 2L, IRS 6E, and IRS 29, that were published by Ott (2004). All of these stars were detected on the VISIR image as point sources. The positions of these eight stars were used to solve transformation equations up to second order. The accuracy of the astrometric solution could be checked by choosing sub-groups of seven out of the eight stars and repeating the transformation. Also, we compared the measured astrometric position of the stars IRS 16NW, IRS 16C, and IRS 29 to their predicted positions. The position of Sgr A* could thus be established with a uncertainty of (less than half a pixel) in the MIR data. This is about a factor of 10 better than in previous work (Stolovy et al. 1996). There are two main reasons for this increased astrometric accuracy: on the one hand, the high sensitivity and spatial resolution of the VISIR data, and on the other hand, the improved IR position of Sgr A* due to precise positions and proper motions of stars in the NIR (e.g., Genzel et al. 2000; Ott 2004) and due to the well-known position of Sgr A* in the IR reference frame via SiO maser sources (e.g., Reid et al. 2003).
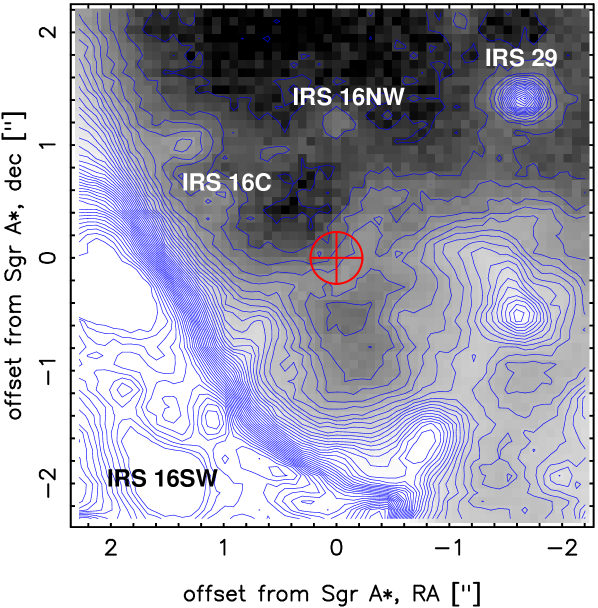
Figure 1 presents the flux calibrated direct shift-and-add image image of the central arcseconds around Sgr A* for the night of 4/5 June 2006. Significant signal power was found to be present at the diffraction limit (, estimated by aperture photometry).
3 Flux limits on Sgr A* at , , and m
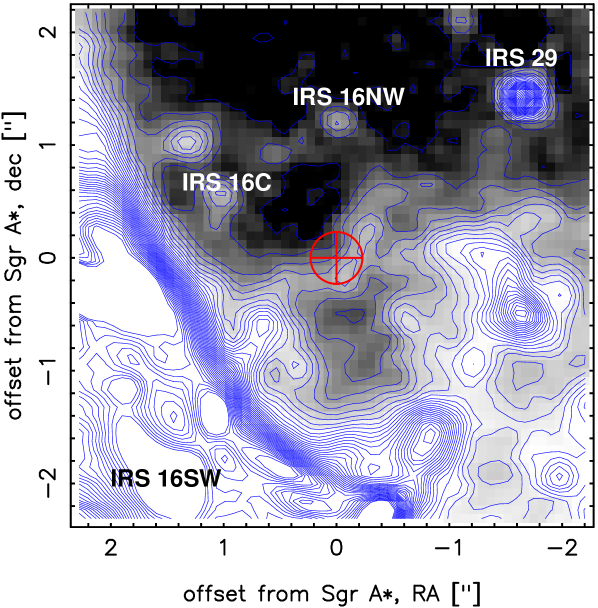
A Lucy-Richardson deconvolved and beam restored version of the image from Fig. 1 is shown in Fig. 2. The deconvolved and beam restored image resembles closely the original image, but emphasizes some of the finer details. There is a dust ridge present very close to the position of Sgr A*, where it bends from an east-west extension to a direction southeast-northwest. In earlier MIR observations of the GC Stolovy et al. (1996) have found very similar structures near Sgr A*. Due to their high spatial resolution and sensitivity, the new data show much richer details, however. Even some stars, such as IRS 29, IRS 16NW and IRS 16C (labeled in Fig. 1) can be detected. In spite of the high quality of the data, no obvious point source is present at the position of Sgr A*. We conclude that the source coincident with Sgr A* that was reported by Stolovy et al. (1996) was most probably related to the background emission of the dust ridge and not to Sgr A* itself. All the flux appears to originate from the dust ridge. This assumption can be used to obtain a first simple flux estimate for Sgr A*. Such an estimate can be obtained by adding or subtracting point sources of given flux at the position of Sgr A* and checking whether the shape of the dust ridge is altered perceptibly in the images. After testing various flux levels, we estimate that a point source at the position of Sgr A* that is present in the image cannot be brighter than 5 mJy.
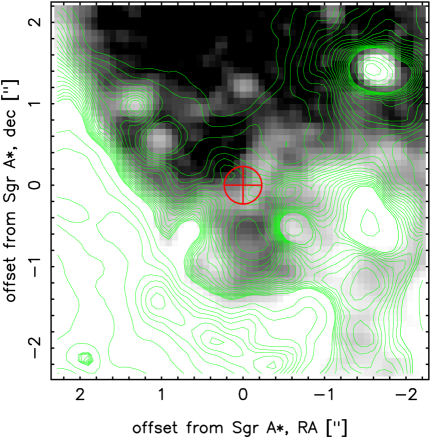
With AO L’-band imaging Eckart et al. (2006a) and Ghez et al. (2005) have demonstrated the presence of a dust blob between about and southwest of Sgr A*. As discussed by Eckart et al. (2006a), it is probably this blob that is responsible for most of the MIR emission near the position of Sgr A* when the latter is in a quiescent state. This blob is clearly visible in the MIR images presented here and forms part of the dust ridge. Therefore, a second way of estimating the flux of a putative point source near Sgr A* can be obtained by trying to account for the extended dust emission. For this purpose we used a high-quality L’-band image obtained with NACO in the night 29/30 May 2006. The StarFinder (Diolaiti et al. 2000) code was used to extract the stars from the image (including a point source due to the emission from Sgr A*) and thus to obtain an image of the diffuse emission at m. This image was smoothed, transformed and scaled (with the help of the IDL routines POLYWARP and POLY_2D) to fit the scale, orientation, and resolution of the MIR data. Flux calibration of the L’-band data was achieved by using the published fluxes of the sources IRS 16C and IRS 33N (Blum et al. 1996). Figure 3 shows the diffuse m flux superposed as contour lines onto the MIR image from the right panel of Fig. 1. The median ratio of the diffuse flux at the two wavelengths in a circular area of around Sgr A* is . This value was used to scale the diffuse flux present in the L’-band data and to subtract it from the MIR image. Here it is important to note that the flux density ratio is much higher in other areas of the mini-spiral. In the northern arm it can be up to 100. Therefore we obtain a conservative estimate of the remnant flux. After subtraction of the scaled diffuse m emission we find an upper limit on the flux of a putative point source at the position of Sgr A* of 8 mJy. Following Lutz et al. (1996), this corresponds to an extinction corrected flux of mJy for the image obtained on 5 June 2006. The lower data quality on 6 June 2006 leads to a higher upper limit of mJy (extinction corrected) on any possible Sgr A* counterpart.
During the simultaneous observations at m on June 5, no counterpart to Sgr A* was detected. The upper limit for the flux of Sgr A* was determined to mJy. Although the quality of the L’-band observations from June 6 was fairly low (due to bad seeing, poor AO correction and electronic noise on the detector), a weak variable counterpart of Sgr A* could be detected. Its variability was measured to be a factor and its extinction (Lutz et al. 1996) corrected flux to be mJy.
4 Discussion
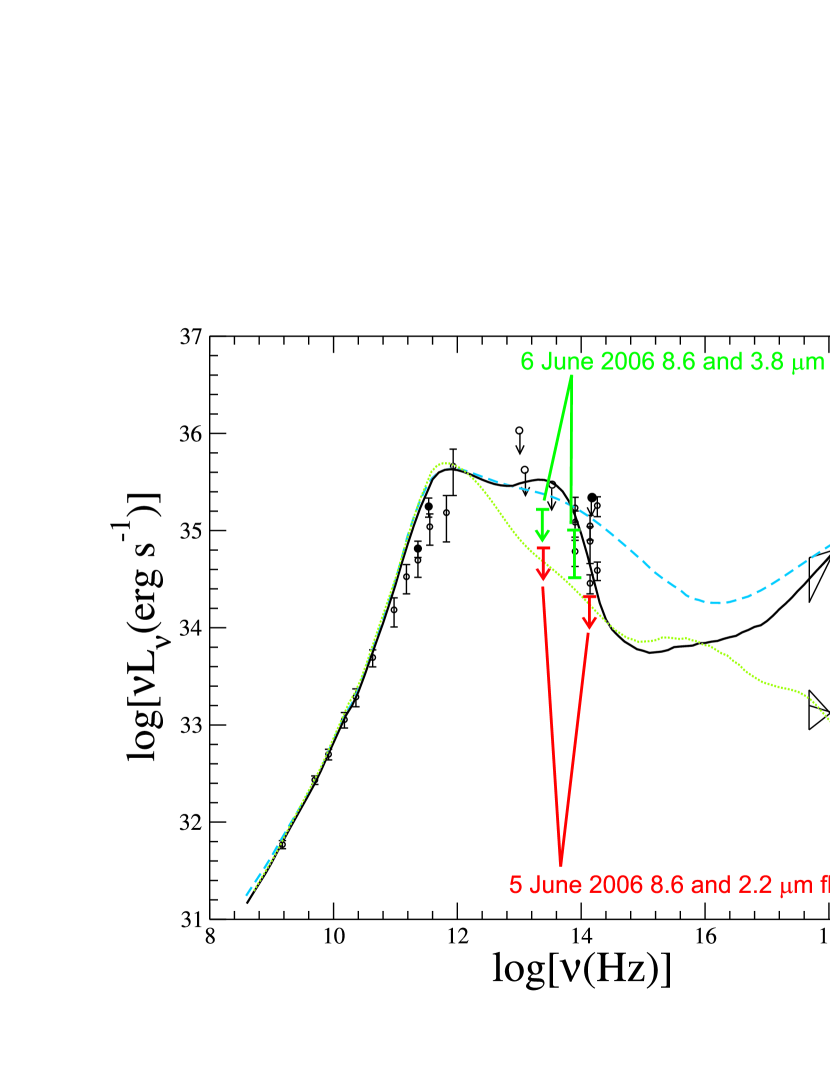
A central question is whether Sgr A* was really in a state of quasi-quiescence when the MIR observations were taken or whether Sgr A* is generally too faint to be detected at MIR wavelengths, even when a flare occurs. We argue that Sgr A* was in a state of quasi-quiescence during the observations on 5 June 2006 for three reasons. (a) The simultaneous observations with NACO at m show that Sgr A* was not detected at m, i.e. no NIR flare was observed. (b) Models predict the emission of Sgr A* at m during a flare to be up to 10 times stronger than the upper limit reported by us (see Fig. 4). (c) Differential imaging allows us to derive tight upper limits on the variability of Sgr A* at m during the observations. From a difference image between the data from 5 June and 6 June an upper limit of mJy can be derived on any possible variability of Sgr A* between these two days. The high quality data from 5 June allow to estimate the upper limit to the variability of Sgr A* during the observations from differential imaging between individual images (30 s of integration time, with 1.5 to 2.5 min time between them) taken during this night to mJy. Our conclusion is that Sgr A* was indeed in a state of quasi-quiescence during the MIR observations at m.
The lower quality of the June 6 data leads to higher limits of mJy for variability between the individual images. The L’-band observations show that Sgr A* was continuously variable during the observations on 6 June. The simultaneously acquired upper limit on the average flux of Sgr A* at 8.6 m and the limits on shorter timescale variability at this wavelength are consistent with the measurements at 3.8 m
Measurements of the Sgr A* quiescent and flaring emission are indicated in Fig. 4 along with theoretical models (data and models taken from Yuan et al. 2003, 2004). The simultaneous measurements at , , and m derived in this work are indicated in the Figure. Two conclusions can be drawn. (a) The acquired upper limits on the IR flux density of Sgr A* at and m set tight constraints on the quasi-quiescent emission and are consistent with the theoretical models shown in the figure. The measurements at and m are consistent with the models, too. The measurements are also in agreement with the synchrotron/SSC models presented by Eckart et al. (2006a). Published jet models predict significantly higher fluxes in the MIR (see Falcke & Markoff 2000; Yuan et al. 2002), but can probably be easily adapted to account for the new upper limits. (b) VISIR at the ESO VLT is sensitive enough to detect flaring emission from Sgr A* during a bright flare without difficulty and during a fainter flare during periods of good and stable atmospheric conditions. When combined with simultaneously acquired NIR measurements the MIR-to-NIR spectral index derived from such observations can be used to distinguish between different flare models.
Acknowledgements.
Part of this work was supported by the German Deutsche Forschungsgemeinschaft DFG Sonderforschungsbereich project number SFB 494. We thank the referee for her/his helpful comments.References
- Baganoff et al. (2001) Baganoff, F. K., Bautz, M. W., Brandt, W. N., et al. 2001, Nature, 413, 45
- Blum et al. (1996) Blum, R. D., Sellgren, K., & Depoy, D. L. 1996, ApJ, 470, 864
- Bower et al. (2004) Bower, G. C., Falcke, H., Herrnstein, R. M., et al. 2004, Science, 304, 704
- Cohen et al. (1999) Cohen, M., Walker, R. G., Carter, B., et al. 1999, AJ, 117, 1864
- Cotera et al. (1999) Cotera, A., Morris, M., Ghez, A. M., et al. 1999, in ASP Conf. Ser. 186: The Central Parsecs of the Galaxy, ed. H. Falcke, A. Cotera, W. J. Duschl, F. Melia, & M. J. Rieke, 240–+
- Diolaiti et al. (2000) Diolaiti, E., Bendinelli, O., Bonaccini, D., et al. 2000, A&AS, 147, 335
- Eckart et al. (2004) Eckart, A., Baganoff, F. K., Morris, M., et al. 2004, A&A, 427, 1
- Eckart et al. (2006a) Eckart, A., Baganoff, F. K., Schödel, R., et al. 2006a, A&A, 450, 535
- Eckart et al. (2006b) Eckart, A., Schödel, R., Meyer, L., et al. 2006b, A&A, 455, 1
- Eisenhauer et al. (2005) Eisenhauer, F., Genzel, R., Alexander, T., et al. 2005, ApJ, 628, 246
- Falcke & Markoff (2000) Falcke, H. & Markoff, S. 2000, A&A, 362, 113
- Genzel et al. (2000) Genzel, R., Pichon, C., Eckart, A., Gerhard, O. E., & Ott, T. 2000, MNRAS, 317, 348
- Genzel et al. (2003) Genzel, R., Schödel, R., Ott, T., et al. 2003, Nature, 425, 934
- Ghez et al. (2003) Ghez, A. M., Duchêne, G., Matthews, K., et al. 2003, ApJ, 586, L127
- Ghez et al. (2005) Ghez, A. M., Salim, S., Hornstein, S. D., et al. 2005, ApJ, 620, 744
- Lagage et al. (2004) Lagage, P. O., Pel, J. W., Authier, M., et al. 2004, The Messenger, 117, 12
- Lagage et al. (2003) Lagage, P.-O., Pel, J.-W., Claret, A., et al. 2003, in Instrument Design and Performance for Optical/Infrared Ground-based Telescopes. Edited by Iye, Masanori; Moorwood, Alan F. M. Proceedings of the SPIE, Volume 4841, pp. 923-931 (2003)., ed. M. Iye & A. F. M. Moorwood, 923–931
- Lutz et al. (1996) Lutz, D., Feuchtgruber, H., Genzel, R., et al. 1996, A&A, 315, L269
- Ott (2004) Ott, T. 2004, Ph.D. Thesis
- Reid et al. (2003) Reid, M. J., Menten, K. M., Genzel, R., et al. 2003, ApJ, 587, 208
- Schödel et al. (2002) Schödel, R., Ott, T., Genzel, R., et al. 2002, Nature, 419, 694
- Shen et al. (2005) Shen, Z.-Q., Lo, K. Y., Liang, M.-C., Ho, P. T. P., & Zhao, J.-H. 2005, Nature, 438, 62
- Stolovy et al. (1996) Stolovy, S. R., Hayward, T. L., & Herter, T. 1996, ApJ, 470, L45+
- Telesco et al. (1996) Telesco, C. M., Davidson, J. A., & Werner, M. W. 1996, ApJ, 456, 541
- Yuan et al. (2002) Yuan, F., Markoff, S., & Falcke, H. 2002, A&A, 383, 854
- Yuan et al. (2003) Yuan, F., Quataert, E., & Narayan, R. 2003, ApJ, 598, 301
- Yuan et al. (2004) Yuan, F., Quataert, E., & Narayan, R. 2004, ApJ, 606, 894