∎
Homi Bhabha Road, Colaba, Mumbai 400 005, India
11email: D. Bose debanjan@tifr.res.in
11email: V. R. Chitnis vchitnis@tifr.res.in
Present addresses:
P. R. Vishwanath 22institutetext: Indian Institute of Astrophysics, Bangalore 560 034, India
A. C. Gupta 33institutetext: Yunnan Astronomical Observatory, Kunming, Yunnan, 650011 China P. R.
P. Majumdar 44institutetext: Max-Planck-Institute for Physics, Foehringer Ring 6, 80805 Munich, Germany
Observations of AGNs using PACT
Abstract
We report our observations on 4 AGNs viz, Mkn421, Mkn501, 1ES1426+428 and ON231 belonging to a sub-class called blazars. The observations were carried out using the Pachmarhi Array of Cherenkov Telescopes and span about 6 years period from 2000 to 2005. We discuss our methods of analysis adopted to extract the gamma ray signal from cosmic ray background. We present our results on the emission of TeV gamma rays from these objects. Also, we report on the status of the new high altitude experiment, a 7 telescope array at Hanle in the Himalayas at an altitude of about 4200 m above mean sea level for detecting celestial gamma rays.
Keywords:
Mkn 421 Blazar -ray astronomy1 Introduction
AGNs have dominated extragalactic -ray astronomy by virtue of their great luminosities. The general understanding is that a supermassive black hole of mass M⊙ at the center of AGN accretes mass from the surrounding medium, forming an accretion disk and two jets emanating perpendicular to the plane of the accretion disk Ref1 . These jets channel a plasma flowing out with relativistic speed and any radiation produced inside them is greatly modified by Doppler effect. AGNs with jets directed towards us are called blazars. Blazars are characterized by two distinct parts in their Spectral Energy Distributions (SEDs). First part in SED rises smoothly from radio wavelengths upto a broad peak spanning the range from optical to X-ray wavelengths and is due to relativistic electrons radiating via synchrotron process. Second part is probably due to inverse compton scattering of synchrotron photons by the same electrons and is characterized by a peak in SEDs in hard X-ray to -ray band Ref2 . One of the characteristic features of these blazars is their time variability on scales ranging from minutes to years. Mkn 421, Mkn 501, 1ES1426+428, ON231 are the four blazars observed using Pachmarhi Array of Cherenkov Telescopes (PACT) during 2000 to 2005. In the following sections we present our observations, analysis procedure and the results obtained. Also, we have attempted a comparative study of two states of Mkn 421 namely, flaring and quiscent states, using radio, optical, X-ray and -ray data. Our future plans for the observations of -ray sources using a high altitude array are also presented.
2 Pachmarhi Array of Cherenkov Telescopes
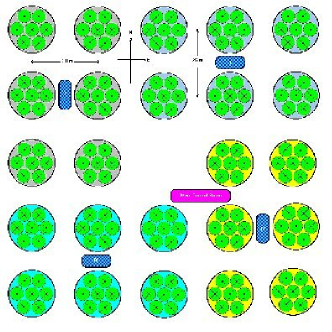
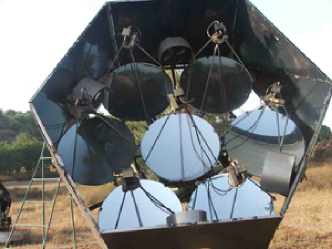
Pachmarhi Array of Cherenkov Telescopes (PACT) is located in Central India (latitude 22∘ 28′ N, longitude 78∘ 25′ E, altitude 1075 ). We use wavefront sampling technique to detect TeV -rays from astronomical sources. There are 24 telescopes spread over an area of . Figure 1 shows the schematic layout of PACT. Each telescope has 7 para-axially mounted parabolic mirrors of diameter 0.9m with a PMT (EMI 9807B) at the focus of each mirror as shown in figure 2. Entire array is sub-divided into 4 sectors with 6 telescopes in each. Each sector has its own data acquisition system (DAQ) where data on real time, relative arrival time of PMT pulses (using TDCs) and photon density (using ADCs) of six peripheral mirrors in a telescope are recorded. Apart from this, there is also a Master DAQ at the center of the array for recording information of an event relevant to entire array. PMT pulses of 7 mirrors in a telescope are linearly added to form a telescope pulse for trigger generation. Data recording is initiated when a coincidence of 4 out of 6 telescope pulses generates an event trigger for a sector. The typical trigger rate was about 2-3 Hz per sector. The orientations of telescopes are controlled remotely and monitored throughout the observations Ref3 . Details of the setup can be found elsewhere Ref4 ; Ref5 . To estimate energy threshold, collection area etc, we have carried out Monte Carlo simulations of extensive air showers using CORSIKA package developed by KASKADE group Ref6 . Energy threshold of PACT is estimated to be 750 GeV for vertically incident showers initiated by -rays111Assumed energy spectrum F(E)=kE-2.4dE and the corresponding collection area is 1.38105m2. The flux level for detecting -rays from a source at 5 sensitivity in 50 hours of observation using PACT is estimated to be 2.9310-11 ph cm-2 s-1 assuming no cosmic ray rejection. In terms of Crab nebula flux this corresponds to about 0.9 Crab units above energy threshold of 750 GeV. For inclined showers, simulations were carried out using IACT option in CORSIKA. The energy threshold and collection area increases with incident angle and these parameters are summarized in table 2.
| Inclination | Energy | Collection |
|---|---|---|
| Angle | Threshold | Area |
| (TeV) | (m2) | |
| Vertical (0∘) | 0.75 | 1.4105 |
| 15∘ | 0.90 | 1.5105 |
| 30∘ | 1.20 | 1.8105 |
| 45∘ | 2.20 | 2.7105 |
3 Observations and Data Analysis
Observations were carried out using PACT on clear moon less nights. Observations on source (source runs) were usually taken by pointing all telescopes to the source direction. The typical run span was about 1-3 hours. Background runs were taken either immediately before or after (sometimes both before and after) the source run by aligning all telescopes to a dark region (a region with the same declination as that of the source but with different RA). Background region is chosen in such a way that it covers same zenith angle range as that of the source. The observation log is given in table 3. For each source an equal amount of data were collected on corresponding background runs.
| Year | Duration of Observations (minutes) | |||
|---|---|---|---|---|
| Mkn 421 | Mkn 501 | ON 231 | 1ES1426+428 | |
| z=0.030 | z=0.034 | z=0.102 | z=0.129 | |
| 2000 | 3510. | 710. | – | – |
| 2001 | 1960. | – | – | – |
| 2002 | 1860. | 510. | – | 1520. |
| 2003 | 1770. | 840. | 510. | 570. |
| 2004 | 2270. | 780. | 550. | 870. |
| 2005 | 930. | – | – | 960. |
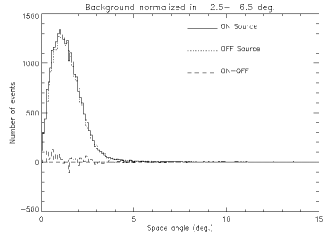
PACT data were analysed in the following way. Celestial -rays are not affected by the interstellar magnetic field, therefore they retain their directionality. Whereas cosmic rays, being charged particles, are scattered by the interstellar magnetic field, as a result they are isotropic. Thus a source emitting -rays will be reflected as an excess of events from the source direction compared to off-source direction. A number of preliminary checks were carried out on the data before doing actual analysis. A cut is imposed on the number of telescopes with valid TDC data to be 8. Care is taken to see that the distribution of telescopes with valid TDC data are similar in both source and background data sets. The arrival direction of each shower is determined by reconstructing shower front using the relative arrival times of Cherenkov photons at various telescopes (or PMTs). Cherenkov photon front is then fitted with a plane, normal to this plane gives the direction of the shower axis. Then, for each shower or event, the space angle is estimated as an angle between the direction of shower axis and the source direction. Thus space angles are obtained for all events in source as well as background runs. Space angle distributions of all source runs are compared with the corresponding distributions of background runs over the same angle coverage. Figure 3 shows the space angle distributions of events from source and background runs taken in a night. Space angle distribution of background events is normalised to the source distribution by comparing the shape of the distributions in 2.5∘ to 6.5∘ window since we do not expect any -ray event in this region Ref5 . This normalisation is necessary since there are variations in the sky conditions at different times of the same night. Differences between the number of source and background events is calculated for each bin as (-c) where c is a constant. We define, χ^2=∑_i=2.5^6.5 (S_i-cB_i)^2 and normalisation constant is chosen such that is minimum. The difference between the source and normalised background events in 0∘ to 2.5∘ region is then used as -ray signal. Thus time averaged -ray signal is obtained for each night observations.
3.1 Analysis of Multiwavelength Data of Mkn 421
We have attempted a comparative study of high and low states of Mkn 421. We chose a flare in March/April 2001 as representative of high state as this flare is one of the strongest flares and February/March 2003 as a representative of low state. We have analysed X-ray archival data from Proportional Counter Array (PCA) on board RXTE obtained during these two periods. The first data set corresponds to the period 19th March to 1st April 2001 when Mkn421 was in flaring state. The second set was collected during 26th February to 5th March 2003, Mkn421 was in quiescent state at this time. PCA data were extracted from archival data sets of RXTE satellite222http://heasarc.gsfc.nasa.gov/W3Browse from observation ids 60145 and 80172 respectively.
The PCA consists of five identical xenon filled proportional counter units (PCUs) covering an energy range of 2-60 keV. During these observations only PCU0 and PCU2 were used. We have analyzed Standard 2 PCA data which has a time resolution of 16s with energy information in 128 channels. Even though observations were carried out with PCU 0 and PCU 2, we have used only PCU 2 data because PCU 0 had lost its front veto layer at the beginning of year 2000. So the data from PCU0 are more prone to contamination by events caused by low-energy electrons entering the detector. Data reduction is done with FTOOLS (version 5.3.1)333see http://heasarc.gsfc.nasa.gov/docs/software/lheasoft distributed as part of HEASOFT (version 5.3). For each of the observations, data were filtered using standard procedure given in the RXTE Cook Book 444http://heasarc.gsfc.nasa.gov/docs/xte/recipes/cook_book.html. For extraction of background, model appropriate for bright sources555 (pca_bkgd_cmbrightvle_eMv20031123.mdl) was used for the 2001 data since the source was in high state during that period. For 2003 data, when the source was in low state, the model appropriate for faint sources666 (pca_bkgd_cmfaintl7_eMv20030330.mdl) was used. The resulting X-ray light curves for the two states of Mkn421 are shown in figure 4.
Contemporaneous optical/NIR and radio data are also available for Mkn421 corresponding to the two data sets mentioned above. Optical data in V-band for year 2001 was taken by WEBT (Whole Earth Blazar Telescope) using KVA-telescope on La Palma Ref7 . For 2003, Near Infra Red data in J-band was taken at Gurushikhar observatory, Mount Abu Ref8 . Radio data was taken by Metshovi radio telescope at 22 GHz and 37 GHz Ref9 .
4 Results
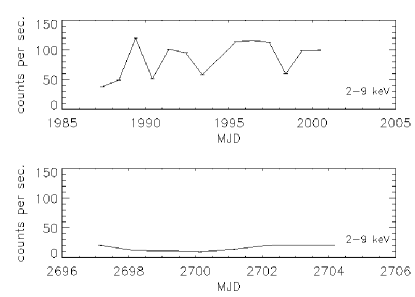
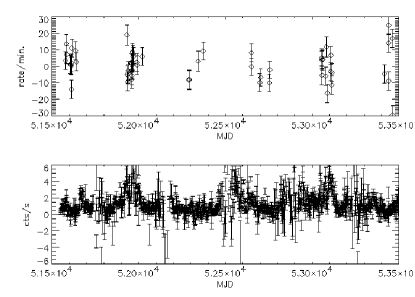
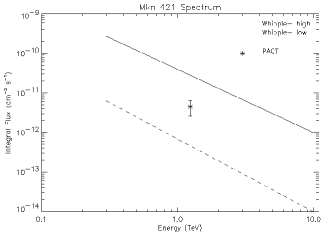
Most of our observations pertain to Mkn 421. The upper panel of figure 5 shows the daily average of TeV -ray rate as obtained from PACT for Mkn 421. In the lower panel of this figure the daily average of X-ray photon rate as obtained by ASM (All Sky Monitor) on board RXTE is shown for comparison. PACT sensitivity is such that to have resonable signal to noise ratio we need to add data from several nights. Therefore we have obtained the time averaged flux of TeV -rays from Mkn421 by combining all data obtained using PACT during 2000-2005. This is found to be 4.51.9 10-12 photons cm-2 s-1 above 1.2 TeV. Since Mkn 421 is observed at an average angle of about 30∘ with respect to zenith, energy threshold of PACT for these observations corresponds to 1.2 TeV. In terms of Crab units this flux is 0.3 units. The overall significance is low due to systematic errors and is 2.3 . This integral flux from Mkn 421 as obtained by PACT is shown in figure 6. The flux of -rays during the most intense flare and lowest activity state as obtained by Whipple group is also shown in this figure. The dotted line represents the quiescent flux measured in 1995 Ref10 and solid line represents the flux measured during a flaring state in 2001Ref11 . During the period of our observations, there were a few flares in 2000, 2001 and 2004. So our time averaged flux is expected to be between the two extreme limits given by Whipple and other Groups.
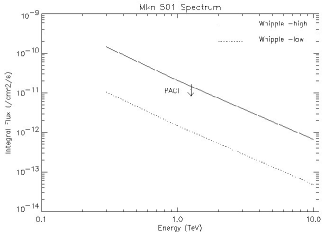
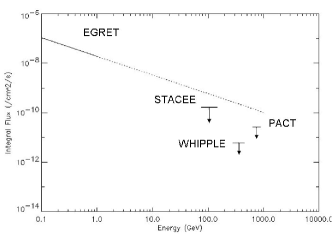
We have not seen any significant -ray flux from other blazars we have observed (Mkn501, 1ES1426+428 and ON231). Earlier, in 1997, a huge flare was detected from Mkn501 Ref12 ; Ref13 ; Ref14 . But during our observation period this source was in low state. It was much weaker than Crab Nebula. We have estimated 3 upper limit on -ray flux from Mkn 501, as 1.2210-11 photons cm-2 s-1 ( 1.2 TeV). Average zenith angle for these observations was about 30∘. This upper limit corresponds to 0.75 Crabs. This upper limit is shown in figure 7. The dotted line represents the quiescent flux measured in 1995 Ref10 and solid line represents the flux measured during the flaring state in 1997 by the Whipple group Ref13 . Blazar 1ES1426+428 is a distant object at z of 0.129. Whipple and HEGRA groups have detected TeV -rays from this source with long duration observations Ref15 ; Ref16 . PACT is less sensitive than Whipple telescope. Also, we do not have very long coverage for this source. We estimate 3 upper limit on -ray flux for 1ES1426+428 to be 1.3410-11 photons cm-2 s-1 ( 1.2 TeV). Here energy threshold is in accordance with average zenith angle of 30∘ during these observations and upper limit corresponds to about 0.8 Crab flux. ON231 is a LBL type blazar and till date TeV -rays are detected only from HBL blazars. But, observations by EGRET on board Compton Gamma Ray Observatory (CGRO) have shown a hard power law energy spectrum (photon spectral index = 1.73 0.18) extending upto about 10 GeV with no sign of any cutoff. Because of its hard spectrum it was thought that ON231 may be detected at higher energies and hence is a potential TeV -ray source. GeV/TeV -rays have not yet been detected from ON231 so far Ref17 ; Ref18 . ON231 was observed by PACT at an average zenith angle of about 10∘ with energy threshold about 800 GeV. We have estimated 3 upper limit on -ray flux from this source as 2.5010-11 photons cm-2 s-1 ( 800 GeV) which corresponds to 0.83 Crab units and is shown in figure 8 along with other results.
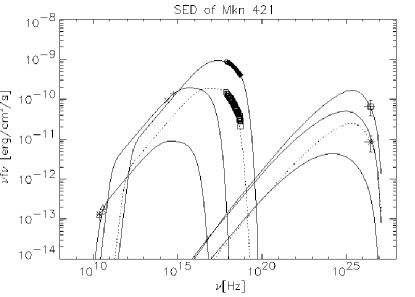
4.1 Spectral Energy Distribution of Mkn 421
We have derived the spectral energy distribution of Mkn 421 during high and low states. The former is based on contemporaneous radio, optical, X-ray and -ray observations while the later is based on contemporaneous radio, NIR, X-ray and -ray data.
Spectral analysis of X-ray data was done using XSPEC. Spectral data from both the data sets were fitted by cutoff power law with line of sight absorption. Line of sight absorption was fixed to neutral hydrogen column density at 1.38 1020 cm2 Ref19 . The best fit photon indices for 2001 and 2003 data are found to be 2.050.03 and 2.400.03 and cutoff energies are about 24.90.26 keV and 23.92.4 keV respectively.
Figure 9 shows spectral energy distributions (SEDs) obtained for Mkn 421 involving multiwaveband data for 2001 and 2003. We have used the time averaged flux of -rays for Mkn 421 in the SED plot of 2003. During the multiwavelength campaign in 2003 this source was at quiescent state as mentioned earlier. Mkn421 was at low state during most of the PACT observations from 2000 to 2005 and hence the time averaged flux is expected to be closer to the quiescent state flux of Mkn421. For 2001 flare we have selected PACT data overlapping with X-rays. After applying selection cuts we are left with 4.8 hours of data which is simultaneous with X-ray data and the corresponding ray flux is 3.41.4 10-11 photons cm-2 s-1. We have fitted the SEDs of both these states with a simple one-zone SSC model (for detailed description of the code see Krawzynski et al. Ref20 ) as shown in figure 9: solid line for 2001 and dotted line for 2003. This model assumes spherical blob of radius R and uniform magnetic field B, moving with respect to the observer with the Doppler Factor , which is filled with a homogeneous non-thermal electron population. Fit to SED of Mkn 421 spanning X-ray and -ray energies using SSC model has been attempted by number of authors for low as well as high state of the source. The fitted parameters broadly fall under two categories : some prefered larger Doppler factor of about 50 (Ref(Konopelko) , Ref(Rebillot) and Ref(Albert) ) while some others used lower value of in the range 10-20 Ref21 . We have tried both these cases (=50 and 14) and the fits for =50 are shown in figure 9. There is substantial change in magnetic field (B) and radius of blob (R) in the two states. We obtained B(magnetic field)=0.20 G, R(radius)=2.31013 m and w(electron density)=0.03 erg/cm3 for the low state in 2003 with =50. For the high state in 2001 the respective values are 0.57 G, 1.31013 m and 0.1 erg/cm3. For =14 the values for B, R and w are 0.28 G, 11014 and 0.01 erg/cm3 for the low state and 0.4 G, 91013 m and 0.04 erg/cm3 for the high state. However it is also possible to fit the SEDs by varying R and B but keeping same.
Synchroton peak in the SED for 2001 is located at higher energies compared to that of 2003 as shown in figure 9, implying spectrum hardens as flux increases. Even though one zone SSC model fits high energy emission nicely (for 2001 and 2003) it fails to take into account radio and optical fluxes. If we assume additional electron populations, as suggested by Krawzynski et al. for 1ES 1959+650, responsible for the low energy emission, then the SED’s of these components could also be fitted. An extensive study of Mkn421 was carried out by Blazejowski et al. Ref21 for the period 2003-2004 involving radio, optical, X-ray and -ray data. There is good agreement between SSC parameters obtained by them and here using 14.
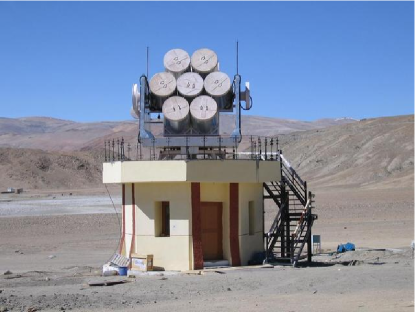
5 High Altitude GAmma Ray observatory
A 7 telescope array, called High Altitude GAmma Ray observatory (HAGAR), is being built at Hanle in the Himalayas, at an altitude of about 4.3 km, above mean sea level Ref22 . HAGAR is based on wavefront sampling technique like PACT. These 7 telescopes will be in the form of a hexagon with an intertelescope spacing of 50 m. Each telescope has 7 para-axially mounted parabolic mirrors of diameter 0.9 m with a photomultiplier tube at the focus of each mirror. The atmospheric attenuation of Cherenkov photons at Hanle altitude is 14% as compared to 50% at sea level. The Cherenkov photon density near the shower core at Hanle is higher by a factor 4-5 compared to that at the sea level for showers of same energy. These features effectively reduce the energy threshold of HAGAR which is estimated to be 60 GeV for vertically incident -ray showers. Sensitivity of HAGAR would be such that it will detect the Crab at 5 level without any hadron rejection in 2 hours. Figure 10 shows the photograph of the first telescope commissioned in June, 2005. Comissioning of remaining telescopes is underway. All 7 telescopes are expected to be operational by middle of 2007.
6 Conclusions
Out of 4 blazars which we have observed using PACT only Mkn 421 was reported (by other experiments) to be in flaring state on few occassions between 2000-2005. We have estimated average integral flux for this source by combining all the data from 2000 to 2005. For others, Mkn 501, 1ES1426+428 and ON231 we have given 3 upper limit on -ray flux.
We have found from the study of SEDs of Mkn421 that X-ray and -ray emissions during high and low states are correlated. Synchrotron peak of SED of 2001 is at higher energy compared to that of 2003, suggesting that peak shifts towards higher energy as flux increases. There are significant changes in SSC parameters for these two data sets at X-ray and -ray energies. One zone SSC model can not fit all data, introduction of additional zone improves the fit at lower energies. But there is almost no change for SSC parameters at lower energies during quiescent and flaring state of Mkn421.
Acknowledgements.
We are thankful to Dr. Talvikki Hovatta for providing us the published radio data. We gratefully acknowledge the use of RXTE data from the public archive of GSFC/NASA. We thank Prof. P. N. Bhat, S.S. Upadhya, K.S. Gothe, B.K. Nagesh, S.K. Rao, M.S. Pose, P.V. Sudershanan, S. Sharma, K.K. Rao, A.J. Stanislaus, P.N. Purohit, A.I. D’Souza, J. Francis, and B.L.V. Murthy for their support during construction, maintenance of PACT and observations.References
- (1) Weekes, T. C. : Very High Energy Gamma-Ray Astronomy. Institute of Physics Publishing, Bristol and Philadelphia (2003)
- (2) Bloom, S. D., & Marscher, A. P., ApJ, 461, 657 (1996)
- (3) Gothe, K. S. et al., Indian Journal of Pure & Applied Physics, 38, 269 (2000)
- (4) Bhat, P. N. et al., Bulletin of Astronomical Society of India, 20, 455-457, (2000)
- (5) Majumdar, P. et al., Astropart. Phys., 18, 339 (2003)
- (6) Heck D. et al, Report FZKA 6019, Forschungszentrum, Karlsruhe, (1998)
- (7) Sillanp et al., 27th ICRC, p-2699 (2001)
- (8) Gupta A. C. et al., A&A, 422, 505 (2004)
- (9) Dr. Talvikki Hovatta, private communication.
- (10) Quinn J. et al., ApJ, 518, 693-698 (1999)
- (11) Krennrich F. et al., ApJ, 560, L45 (2001)
- (12) Aharonian F. A. et al., A&A, 327, L5 (1997)
- (13) Catanese M. et al., ApJ, 487, L143 (1997)
- (14) Bhat C. L., in proc of 25th ICRC, Durban, 8, 211 (1997)
- (15) Petry, D. et al., ApJ, 580, 104-109 (2002)
- (16) Aharonian, F. et al., A&A, 403,523-528 (2003)
- (17) Böttcher, M., et al., ApJ, 581, 143-154 (2002)
- (18) Mukherjee, R., et al., 29th ICRC, Pune, 4, 419-422 (2005)
- (19) Dicke J. & Lockman J., ARA&A, 28, 215 (1990)
- (20) Krawczynski H. et al., ApJ, 601, 151-164 (2004)
- (21) Konopelko A. et al., ApJ, 597, 851 (2003)
- (22) Rebillot P. F. et al., ApJ, 641, 740 (2006)
- (23) Albert J. et al., astro-ph/0603478 (2006)
- (24) Blazejowski M. et al., ApJ, 630, 130 (2005)
- (25) Chitnis V. R. et al., in proc of 29th ICRC, Pune, 5, 235-238 (2005)