Interstellar medium disruption in the Centaurus A group
Abstract
We present the results of a 21 cm neutral hydrogen (H i) line detection experiment in the direction of 18 low luminosity dwarf galaxies of the Centaurus A group, using the Australia Telescope National Facility 64m Parkes Radio Telescope and the Australia Telescope Compact Array. Five dwarfs have H i masses between to and . The other 13 have upper-limits between and ( ). Two of the mixed-morphology dwarfs remain undetected in H i, a situation that is in contrast to that of similar Local Group and Sculptor group objects where all contain significant amounts of neutral gas. There is a discontinuity in the H i properties of Centaurus A group low luminosity dwarfs that is unobserved amongst Sculptor group dwarfs. All objects fainter than have either or . This gap may be explained by the ram pressure stripping mechanism at work in this dense environment where all galaxies with have been stripped of their gas. The required intergalactic medium density to achieve this is cm-3.
1 Introduction
Galaxy morphology is a static description of an evolving stellar system. It is the visual manifestation of the physical processes that shaped the global optical light distribution over a Hubble time. It is the present day star formation, generating discreet pockets of young bright stars and H ii regions, that leads to the irregular B-band appearance of late-type dwarfs. Star formation activity, however, can only operate until the resources for producing new stars in the form of neutral hydrogen reservoirs, is exhausted. This eventually results in an object with a smooth, featureless light distribution (an early-type dwarf), devoid of any significant amount of interstellar medium (ISM). Whether or not these evolved late-type galaxies will have the same properties as the present day early-type dwarf galaxies is a much discussed matter (Mayer et al., 2001; Pedraz et al., 2002; Simien & Prugniel, 2002; Grebel et al., 2003; De Rijcke et al., 2003, 2004; van Zee et al., 2004; Read & Gilmore, 2005). The evolutionary phase between the two major morphological types provides observable objects (known as transition-type dwarfs, dE/dIrr) with a continuum in both gas and stellar properties between the two extremes: gas rich dwarf Irregulars (dIrr) and gas poor dwarf Ellipticals (dE, also incorporating dwarf Spheroidals, dSph and dwarf S0s, dS0).
In essence, to be classified as “early-type”, a dwarf galaxy only needs to have had no recent star formation. This could, in principle be independent of the presence or absence of H i gas. Indeed, while the Local Group dEs exhibit a wide variety of star formation histories (e. g., Grebel, 2001), few show signs of recent star formation (Tolstoy et al., 2004; Babusiaux et al., 2005; Olszewski et al., 2006) yet some are not completely devoid of H i. The two early-type galaxies companions to M31, NGC185 and NGC205 (Young & Lo, 1997) and the Sculptor dSph (Carignan et al., 1998; Bouchard et al., 2003) are examples (see also Blitz & Robishaw, 2000) where traces of H i are detected ( ). Moreover, all known Local Group transition type galaxies have been detected in H i: LGS3 contains = 6 (Young & Lo, 1997; Robishaw et al., 2002), Phoenix has 1 (St-Germain et al., 1999; Gallart et al., 2001), Antlia has 7 (Barnes et al., 2001), DDO210 has and Pegasus has 5 (Lo et al., 1993). The same observation is made for the four known transition type galaxies of the Sculptor group; these have 3 (Bouchard et al., 2005). Two dS0 galaxies ESO384-G016, in the Centaurus A group, and NGC 59, in the Sculptor group, have also been detected with (Beaulieu et al., 2006). Similarly, in galaxy clusters, up to 15% of early-type dwarfs still have substantial amounts of H i ( Conselice et al., 2003). It is therefore incorrect to believe that only currently star forming or irregular galaxies contain ISM.
The detection of H i in early-type dwarf galaxies is an important step in understanding any morphological evolution scenario. Gas depletion is still viewed as the key factor driving the transition from late to early-type (e. g., Conselice et al., 2003). Morphological properties of galaxies are strongly correlated to their environment (Dressler, 1980; Binggeli et al., 1987, 1990; van den Bergh, 1994) and factors such as ram pressure (Einasto et al., 1974) and tidal fields (Moore et al., 1996), galactic winds (Marcolini et al., 2004) and enhanced star formation efficiency (Buyle et al., 2005) can, in principle, remove or exhaust the gas from a late-type dwarf and force the transition. However, since ISM is detected in some early-type dwarfs, there are other options one needs to study. (1) Gas depletion is not an end state, i. e., gas can be accreted from various sources such as stellar winds, intergalactic medium, etc. (e. g., Mould et al., 1990). (2) The gas is not depleted but is difficult to detect; e. g., the ISM resides in an ionised state (Mashchenko et al., 2004). In these cases, dEs may still have the means to form new stars and thus to oscillate between morphologies: some could be quiescent mixed-morphology dwarfs.
By identifying and analysing low mass dwarf galaxies that contain H i, we can constrain this theory of evolution. For the Local Group, the work has been conducted by Blitz & Robishaw (2000) and Bouchard et al. (2006) who have identified a number of early-types dwarfs possibly associated with H i emission. In the Sculptor group, only one ‘genuine’ early-type dwarf, i. e.,one without any detected ISM, could be found (Bouchard et al., 2005), in accordance with morphological predictions (Jerjen et al., 2000b). This makes the Sculptor group one of the rare environments where late-type dwarfs vastly outnumber early-types: for example, down to , Sculptor has one early-type dwarf against 18 late-types (Côté et al. 1997, hereafter CFC97; Karachentseva & Karachentsev 1998, hereafter KK98; Jerjen et al. 2000b) while the Local Group has at least 17 early-type dwarfs against 16 late-type dwarfs (Mateo, 1998). The Sculptor group has an elongated shape extending over Mpc (Jerjen et al., 1998; Karachentsev et al., 2004) and is therefore more of a galaxy ‘cloud’ than a gravitationally bound entity; it does not have high galaxy density regions. This makes environmental influences such as ram pressure and tidal stripping largely ineffective and may explain the lack of early-type objects.
The Centaurus A (CenA) group is a much denser environment than Sculptor. CFC97 identified dIrr galaxies in the CenA group using photographic plates as well as H i and H spectroscopy. In a complementary study, 13 dwarf galaxy candidates of early and mixed morphology were detected by Jerjen et al. (2000a), five of which had their distances measured and membership confirmed by the surface brightness fluctuation technique (Jerjen et al., 2000b). Several other catalogs and studies describing galaxies of the CenA group have also been published (KK98; Banks et al. 1999; Karachentseva & Karachentsev 2000; Karachentsev et al. 2002, 2006). In total, the CenA group contains at least 54 galaxies and has NGC5128 (CenA) and NGC5236 (M83) at the center of its principal density peaks. Of this number, galaxies are dwarfs (with absolute magnitude fainter than ): 32 are late-type, 14 are early-type and 4 are of mixed-morphology. This rich group environment is, after Sculptor, the next logical target to search for H i rich dEs.
This paper presents the results of Parkes single-dish and Australia Telescope Compact Array H i observations in the direction of 18 CenA dwarf galaxies. The aim was to obtain a complete picture of H i properties in all known CenA group dwarf galaxies to a low H i mass limit. The following pages are divided as follow: Section 2 contains information on the target selection and observations. The main results of this investigation are found in Section 3 while the analysis and implications are discussed in Section 4. Finally Section 5 presents the conclusions of the paper.
2 Observations
2.1 Sample selection
The CenA galaxy group (Figure 1) was chosen because it represents a widely different environment to the low density Sculptor group, which we studied earlier (Bouchard et al., 2005). The relatively large number of galaxies, the presence of an active radio galaxy (CenA) and the high overall density of the group makes it more akin to a cluster environment. The biggest advantage of the CenA group, however, is its short distance to the Milky Way ( Mpc), which makes deep and detailed H i studies of its members possible.
Our aim is to study the H i properties of galaxies that are the most susceptible to mass-loss mechanisms. These mechanisms will operate most effectively at the faint-end of the galaxy luminosity function. From the lists compiled by CFC97, Jerjen et al. (2000a), KK98, and Karachentsev et al. (2006), we see that the CenA group contains 35 known dwarfs with (14 early-type, 17 late-type and 4 mixed type) and, of these, we observed 18: 10 early-type, four late-type and all four mixed-type. The properties of these dwarfs, i. e., the morphological types, spatial positions, radial distances, apparent magnitudes, Galactic extinctions, and optical heliocentric radial velocities, are summarised in Table 1. While all these galaxies have previously been observed with HIPASS (Barnes et al., 2001), that all-sky survey lacked sufficient resolution or sensitivity to constrain the properties of these low mass objects. They were re-observed with either the Parkes Radio Telescope or the Australia Telescope Compact Array.
| Galaxy | Type | R.A. | Dec. | aaThe distance values marked with denotes a measurement using the tip of the red giant branch method and is used for the surface brightness fluctuation method. | References | |||
|---|---|---|---|---|---|---|---|---|
| (J2000) | (J2000) | (Mpc) | (mag) | (mag) | (km s-1) | |||
| ESO219-G010 | dE | 12 56 10 | -50 08 38 | 4.790.43 | 16.420.16 | 0.957 | 1, 2 | |
| ESO269-G037 | dIrr | 13 03 33 | -46 35 06 | 3.480.35 | 16.26 | 0.574 | 3 | |
| [CFC97]Cen6 | dIrr | 13 05 02 | -40 04 58 | 5.780.46 | 16.33 | 0.436 | 61943 | 4, 5 |
| CenA-dE1 | dE | 13 12 45 | -41 49 57 | 4.210.33 | 17.750.11 | 0.493 | 1, 5 | |
| ESO269-G066 | dE | 13 13 09 | -44 53 24 | 4.050.53 | 14.590.08 | 0.401 | 78431 | 1, 2 |
| CenA-dE2 | dE/dIrr | 13 21 33 | -31 52 43 | 18.130.18 | 0.288 | 1 | ||
| SGC1319.1-4216 | dE | 13 22 02 | -42 32 07 | 3.870.31 | 15.680.14 | 0.665 | 1, 5 | |
| [CFC97]Cen8 | dIrr/dE | 13 22 56 | -33 34 22 | 17.650.08 | 0.296 | 1, 4 | ||
| AM1320-230 | dE | 13 23 29 | -23 23 35 | 17.530.08 | 0.348 | 1 | ||
| UGCA365 | dIrr | 13 36 31 | -29 14 06 | 5.180.41 | 15.53 | 0.229 | 5731 | 5, 6 |
| [KK98]208bb[KK98]208 was not explicitly targetted but was in the field of view of UGCA365. | dIrr | 13 36 35 | -29 34 17 | 4.680.42 | 14.3 | 0.192 | 3 | |
| AM1339-445 | dE | 13 42 05 | -45 12 18 | 3.530.31 | 16.320.1 | 0.477 | 2, 7 | |
| CenA-dE3 | dE | 13 46 00 | -36 20 15 | 17.410.15 | 0.266 | 1 | ||
| AM1343-452 | dE | 13 46 16 | -45 41 05 | 3.730.32 | 17.570.11 | 0.522 | 1, 2 | |
| CenA-dE4 | dE | 13 46 40 | -29 58 41 | 17.600.14 | 0.260 | 1 | ||
| ESO384-G016 | dE/dIrr | 13 57 01 | -35 20 01 | 4.230.11 | 15.110.06 | 0.318 | 56132 | 1, 2 |
| CenA-dE5 | dE | 14 30 05 | -33 28 45 | 18.430.13 | 0.326 | 1 | ||
| ESO272-G025 | dE/dIrr | 14 43 25 | -44 42 18 | 14.77 | 0.694 | 62410 | 3, 4 |
2.2 Parkes observations
Using the same approach as Bouchard et al. (2005), the 64m Parkes Telescope333The Parkes telescope is part of the Australia Telescope, which is funded by the Commonwealth of Australia for operation as a National Facility managed by the CSIRO. was employed to obtain high spectral resolution H i line spectra in the direction of the early-type dwarfs AM1343-452, ESO269-G066, CenA-dE1 and CenA-dE4. The observations were conducted in February 2005 (project P475). The Multibeam instrument in MX (beam-switching) mode and the narrowband correlator with the MB7_8_2048 settings, provided a bandwidth of 8 MHz divided in 2048 channels and 2 polarisations. The central frequency was set at 1417 MHz resulting in an H i velocity coverage from -100 to 1500 km s-1, with a channel width of 0.82 km s-1. The beam size is 14.1′ or kpc at a radial distance of 4.3 Mpc. In MX mode only the seven inner-most horns of the multibeam detectors are used. At all times, one of the beams was kept on-source while the six others observed adjacent sky to provide bandpass calibration, alternating the on-source beam every two minutes. The total integration times ranged from 350 to 650 minutes (see Table 2).
These data were reduced with the LiveData data reduction pipeline. The median of the Tukey-smoothed bandpass was used for calibration and the data were gridded with Gridzilla after averaging the two polarisations. LiveData and Gridzilla are part of the AIPS++ software package. The mbspect robust polynomial fitting algorithm from the MIRIAD software package was used to fit low order polynomials and subtract residual baseline ripples.
2.3 ATCA observations
The Australia Telescope Compact Array (ATCA)444The Australia Telescope Compact Array is part of the Australia Telescope, which is funded by the Commonwealth of Australia for operation as a National Facility managed by CSIRO. was used to obtain H i line maps and spectra in the direction of the 13 galaxies: ESO269-G037, [CFC97]Cen8, AM1339-445 and ESO384-G016 with the 1.5A array configuration, [CFC97]Cen6 and CenA-dE5 with the 750D configuration, ESO219-G010, CenA-dE2, AM1320-230 and CenA-dE3 using the EW367 configuration and SGC1319.1-4216, UGCA365 and ESO272-G025 with the EW352 configuration. In addition, observations in the direction of [CFC97] Cen5 were also conducted but are not presented here. This galaxy is a background spiral, not associated with the CenA group (Bouchard et al., 2004).
The arrays were chosen so that the final synthesised beam would encompass a maximum of the anticipated flux structure while not being much larger. Precisely, it was the different distances to each object and their respective morphological appearances that were taken into account. This was done to avoid over-resolving the sources which would have led to detection difficulties whilst also avoiding the dilution of the H i signal with the surrounding noise. The observations were carried out in 2003 February and March and in 2004 March and April (project C1133).
The FULL_4_1024-128 correlator configuration was employed with the central frequency of 1417 MHz for an H i line velocity coverage from 200 km s-1 to 1000 km s-1 or of 1416 MHz, covering from 400 km s-1 to 1200 km s-1. The spectra were divided in 1024 channels each of 0.82 km s-1. For each observing session the radio continuum source 1934-638 was observed for 10 minutes for use as a flux and bandpass calibrator. A phase calibrator was also observed for typically 5 minutes every 40 minutes of on-source integration. Total integration times ranged between 270 and 650 minutes (See Table 2).
The data were reduced with the MIRIAD software package using standard procedures. The continuum was fitted and subtracted using a low order polynomial. Each data cube was produced using “natural” weighting of baselines, CLEANed and RESTORed to a Gaussian beam of the same size as the main lobe of the synthesized beam.
3 Results and H i properties
| Galaxy | Telescope | Tint | |||||
|---|---|---|---|---|---|---|---|
| (min) | (Jy km s-1) | () | (km s-1) | (km s-1) | () | ||
| ESO219-G010 | ATCA | 288 | |||||
| ESO269-G037 | ATCA | 280 | 0.140.02 | 41 | 743.82.1 | 9.51.9 | 0.0400.007 |
| [CFC97]Cen6 | ATCA | 651 | 5.310.21 | 42070 | 614.20.8 | 12.10.8 | 1.80.2 |
| CenA-dE1 | PKS | 352 | |||||
| ESO269-G066 | PKS | 651 | |||||
| CenA-dE2 | ATCA | 271 | |||||
| SGC1319.1-4216 | ATCA | 614 | |||||
| [CFC97]Cen8 | ATCA | 287 | |||||
| AM1320-230 | ATCA | 287 | |||||
| UGCA365 | ATCA | 540 | 2.820.08 | 18030 | 571.40.7 | 12.70.7 | 0.560.05 |
| [KK98]208 | ATCA | 540 | |||||
| AM1339-445 | ATCA | 270 | |||||
| CenA-dE3 | ATCA | 300 | |||||
| AM1343-452 | PKS | 422 | |||||
| CenA-dE4 | PKS | 352 | |||||
| ESO384-G016 | ATCA | 282 | 1.040.18 | 448 | 502.92.4 | 8.32.0 | 0.130.02 |
| CenA-dE5 | ATCA | 529 | |||||
| ESO272-G025 | ATCA | 605 | 1.520.08 | 7020 | 629.20.9 | 10.80.9 | 0.100.01 |
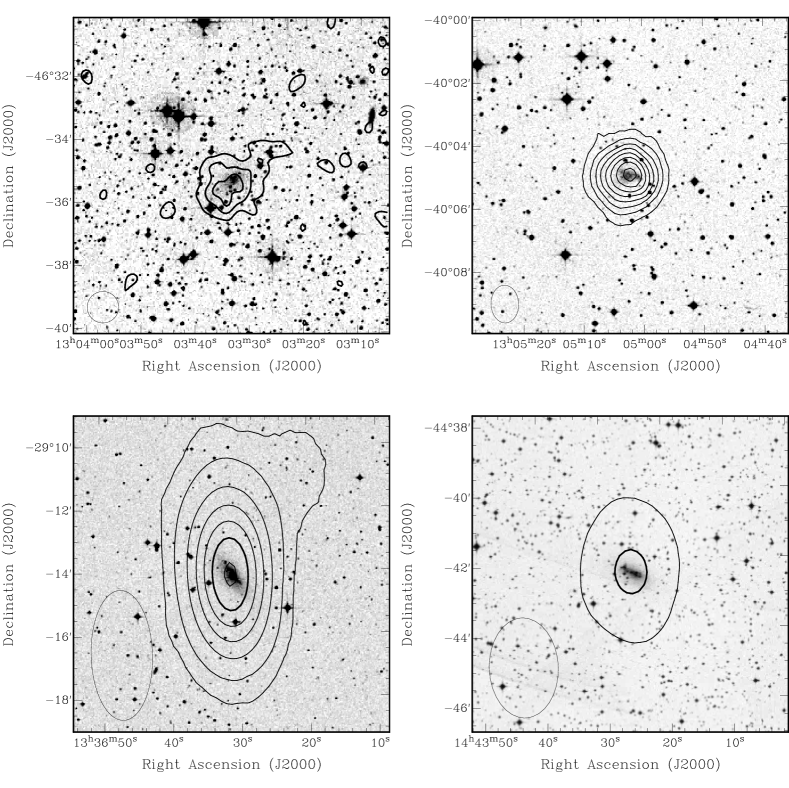
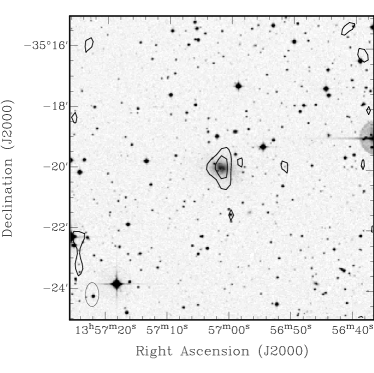
Our program has detected H i emission in five galaxies: the dIrr ESO269-G037, the dIrr [CFC97]Cen6, the dIrr UGCA365, the dE/dIrr ESO384-G016 and the dE/dIrr ESO272-G025. Line emission maps can be found in Figures 2 and 3; the spectra in Figure 4. Of the 11 galaxies that were not detected, two are of mixed morphology: CenA-dE2 and [CFC97]Cen8 while one is a dIrr: [KK98]208. The rest are early-type dwarfs.
In Table 2 we compile the H i detection parameters or upper-limits on the H i content. For each galaxy, we list the telescope that was used and the total on-source integration time, Tint in minutes. For the detected galaxies, the heliocentric radio-velocities , and velocity dispersions of the gas are listed. The total H i flux, in Jy km s-1, is given by:
| (1) |
where is the flux value within each channel of velocity width . The H i mass , in solar units , was calculated using the standard formula:
| (2) |
where is the radial distance in Mpc. When was unavailable from the literature, a value of Mpc was adopted, which corresponds to the mean and standard deviation of the distances to all galaxies in the CenA group (Karachentsev et al., 2006).
The H i mass to blue luminosity ratio , in solar units is:
| (3) |
in which is the apparent integrated B-band magnitude of the object and is the B-band Galactic extinction value along the line of sight (see Table 1). The absolute magnitude of the sun was taken as (Bessell et al., 1998). The quoted errors are the results of quadratic error propagation and, when no error were mentioned for , these values were taken as mag.
Where the galaxies were not detected, Table 2 lists upper-limits for , , and . These upper-limits were calculated with the same above equations but using a value of equal to three times the RMS in the spectra integrated over 10 km s-1. The RMS was typically mJy beam-1 in ATCA observations and mJy beam-1 in Parkes data.
We should note, however, that while ESO269-G066 is listed as not detected in Table 2, it contains a prominent H i feature in its spectrum at = 2311 kms-1 with Jy km s-1 (Figure 5). This feature was not reported by Beaulieu et al. (2006) who observed the same object with the Green Bank Telescope, covering a heliocentric velocity range from 600 to 1000 km s-1; they have placed an upper-limit of (corrected to a distance of 4.05 Mpc). The optical velocity of this object was established to be = 78431 km s-1, measured from Balmer absorption lines (Jerjen et al., 2000b). It therefore seems unlikely that this H i feature is associated with the dwarf. A systemic velocity of 231 km s-1 would also be inconsistent with a CenA group association, most other objects have velocities greater then 500 km s-1. Inspection of the High Velocity Cloud catalog (Putman et al., 2002) reveals many HVCs in the vicinity of ESO269-G066 at km s-1 and one may have been caught in the 14′ beam of the Parkes telescope. We conclude that no H i is associated with this galaxy, which therefore has .
4 Analysis
4.1 Early-type dwarfs
The first interesting result from our H i study that should be pointed out is that none of the ten observed dwarfs classified as dE have been detected in H i. The upper-limits range between and the upper-limits are between . To understand the implications of the results, one should consider two extreme examples: CenA-dE5 and ESO269-G066. While both have roughly similar H i mass upper-limits, and , respectively, they have very different ratios.
CenA-dE5 is the faintest galaxy of our sample and has an absolute magnitude = -10.1 (for an assumed distance of 4.3 Mpc). Although this object is brighter than some Local Group dwarfs (e. g., Ursa Minor, = -7.6 Mateo 1998), it is amongst the faintest known galaxies in the local universe. It has . At the bright end of our optical luminosity distribution, ESO269-G066 has = -13.8 and .
As a first approximation, both these galaxies can be considered as being dominated by an old and metal poor stellar population (see Jerjen et al., 2000b). The mass loss expected from the evolution of such a population is of the order of over a Hubble time (Bouchard et al., 2005). It becomes immediately obvious that while the upper-limit for CenA-dE5 does not exclude such mass loss material being in the form of H i, it is very stringent on the state of ESO269-G066. In this latter case, any neutral gas build-up is, at best, insignificant. The upper-limit on actually requires that the ISM in this galaxy is either completely ionised or, more likely, has been regularly and thoroughly swept out of the dwarf. For comparison purposes, the Local Group dE galaxies NGC185 and NGC205, both satellites of M31 have and , respectively (Young & Lo, 1997).
4.2 Mixed-type dwarfs
Of the four mixed-type dwarfs that were observed, two were detected in H i: the dE/dIrr ESO384-G016 with , and the dE/dIrr ESO272-G025 with and . The two others, the dE/dIrr CenA-dE2 and the dIrr/dE [CFC97]Cen8 have upper-limits of , and , , respectively.
We note that Beaulieu et al. (2006) previously observed ESO384-G016 with the ATCA and found , in good agreement with our result. They had a longer integration time which resulted in a higher signal-to-noise ratio and, most probably, a more accurate result. These authors have also found that single dish observation yielded , which highlights the fact that approximatively 25% of the flux resides in scales inaccessible to our array configuration. We also note that ESO272-G025 had previously been detected in H but not in H i (Côté et al., 1997).
At first sight, this situation may seem contrasting to that of both the Local Group and the Sculptor group where all mixed-morphology galaxies have been detected in H i. On closer inspection, however, Local Group mixed-morphology dwarfs have between 0.21 and 1.4 (St-Germain et al., 1999; Blitz & Robishaw, 2000; Bouchard et al., 2006), while in the Sculptor group these objects have between 0.08 and 0.18 (Bouchard et al., 2005). The constraint imposed on the two non-detected CenA dwarfs does not exclude H i contents similar to those of Sculptor mixed morphology dwarfs.
4.3 Late-type dwarfs
It comes with some surprise that not all observed late type dwarfs were detected in H i. While ESO269-G037, [CFC97]Cen6 and UGCA365 all have considerable amounts of ISM, and , and and and , respectively, [KK98]208 was not detected with limits of and . From empirical evidence, we would have expected most dIrr galaxies to have between 0.1 and 10 at (Warren et al., 2006).
The galaxy [KK98]208 was added to the sample after the observations as it resides only 30′ away from UGCA365. The upper-limit for and correspondingly for is higher than for any other galaxy of our sample (see Table 2) and, with , this galaxy is optically brighter than most other objects in our sample. This makes the ratio limit of 0.05 surprisingly low for a dIrr. No dwarf galaxy in the Koribalski et al. (2004) sample has values this low (also see Warren et al., 2006).
[KK98]208 also happens to share a similar line of sight to the spiral NGC5236 (M83), which has H i extending up to and beyond the spatial position of [KK98]208. Huchtmeier et al. (2000) claim to have detected the dwarf at = 400 km s-1, but this detection is confused with the 21 cm signal from NGC5236. The northern spiral arm of NGC5236 is easily detected in our data at the velocity mentioned by Huchtmeier et al. (2000), but there are no signs of kinematically-decoupled H i emission near the dwarf. It is also worth noting that Karachentsev et al. (2002) found, in the colour-magnitude diagram of this dwarf, a predominantly old stellar population typical of a dE, in disagreement with its irregular morphology (KK98). However, its extreme low surface brightness makes classification on morphological grounds intrinsically difficult (see Figure 3 from Karachentsev et al., 2002, online material). Both the stellar population and the H i properties of this object clearly favour an early-type classification.
It is also interesting to note that the dIrr galaxy ESO269-G037 has . This value is low for a dwarf of late-morphology. Based on stellar photometry, Karachentsev et al. (2002) argued that this galaxy should actually be considered as a dSph. The object may also harbour a small population of blue stars, which would be consistent with the H i result.
4.4 H i displacement and ram pressure
Angular displacement of the H i with respect to the optical center is observed in a number of dwarf galaxies. In the Local Group, this is seen in two of the five mixed-morphology galaxies, Phoenix and LGS 3 (St-Germain et al., 1999; Gallart et al., 2001; Robishaw et al., 2002), while in the Sculptor group, this is likely the case for two of the three investigated mixed-morphology dwarfs. In the CenA group, we only detect a possible H i displacement in ESO269-G037, but the low signal to noise of the map presented in Figure 2 makes it difficult to accurately determine if the gas is really offset with respect to the optical centre.
We do, however, detect a discrepancy between the H i velocity km s-1 (consistent with the measurement of Beaulieu et al. 2006) and the optical velocity km s-1 (Jerjen et al., 2000b) for ESO384-G016. While Beaulieu et al. (2006) argued that the H i velocity is probably more accurate than the optical, they also suggested that, based on the H i distribution, this galaxy may be experiencing ram pressure while falling into the group. Jerjen et al. (2000b) noted that this galaxy has an old and metal-poor stellar population and the optical spectra shows no sign of current star formation. Ram pressure stripping may be able to displace the gas while keeping it with a smooth distribution (Gallart et al., 2001), not necessarily triggering star formation. Moreover, the H i is at a lower velocity than the optical, a situation we would expect if ESO384-G016, at Mpc, is falling onto NGC5236 at Mpc (Karachentsev et al., 2006). Since the mechanism causing this offset is unlikely to be aligned with the radial direction, the velocity difference should also have produced a measurable angular offset if it is the result of a gentle ‘push’ or have produced star forming regions if the event was more violent. Alternatively, it may be that the gas is being compressed and star formation is about to start. This object would then evolve back toward a late-type morphology. The spectral information available for this object is of too low signal-to-noise. Further observations will be required to investigate whether the H i line shape may have been influenced by ram pressure.
The Eastern H i extension detected by Beaulieu et al. (2006) in ESO384-G016 is similar to the north-western H i extension of UGCA365 (Figure 2). This latter galaxy is situated kpc three dimensional distance from NGC5236 (M83), a separation reminiscent of that of the Large and Small Magellanic Clouds to the Milky Way. It is possible that this object is experiencing ram pressure and tidal stripping as it travels on its orbit around M83.
4.5 CenA environment and dwarf evolution
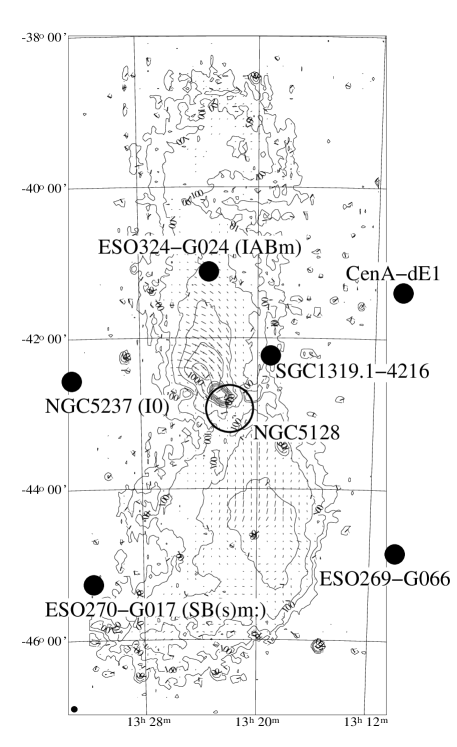
The CenA group is a relatively high density environment providing external conditions which can influence the evolution of its group members. In fact, one of the most important features of this environment is the presence of the active galaxy NGC5128 (CenA). The radio-lobes of NGC5128 may be dramatically affecting nearby objects (see Figure 6). These regions of hot ionised plasma measure 9° ( kpc) in the north-south direction and 3° ( kpc) east-west (e. g., Junkes et al., 1993). This may have affected the evolution of nearby dwarfs.
There are six galaxies projected near NGC5128. These include the three early type dwarfs, CenA-dE1, SGC1319.1-4216 and ESO269-G066, none of which were detected in H i (Table 2). The three other objects are gas rich (CFC97, Koribalski et al. 2004). The spiral ESO270-G017 (also known as Fourcade-Figueroa) and the irregular NGC5237 are believed to be the remnants of a close interaction between a spiral galaxy and NGC5128, which may have been at the origin of the latter’s observed dust lane (Dottori & Fourcade, 1973; Thomson, 1992). Finally, the dIrr ESO324-G024 is known to have H and H emission, both signs of active star formation (Lee et al., 2003).
In the case of ESO269-G066, their is a good agreement in radial distance with NGC5128: Mpc, (Rejkuba, 2004) compared to Mpc for ESO269-G066 (Jerjen et al., 2000b). The relative line of sight velocity is km s-1 ( km s-1, Israel, 1998). It is possible that the orbit of the dwarf brings it regularly through the lobes of NGC5128. The very low limit on the H i mass to light ratio of ESO269-G066, , and the evidence that it contains mostly old and metal poor stars (Jerjen et al., 2000b) suggests that these passages through the lobes may be ‘actively cleansing’ the dwarf of any traces of accumulated gas, probably by means of intensified ram pressure and, possibly, heating due to the higher X-ray radiation field in the plasma. In any case, this would prevent any further star formation. The other early-type dwarfs CenA-dE1 and SGC1319.1-4216 may be in similar positions, however, independent measurement of their distances are required to reveal the likeliness of these objects going through the lobes.
To investigate this intensified ram pressure, we compare in Figure 7 the and values of all known galaxies from the CenA and Sculptor group. It becomes apparent that the different global environments, and not just the direct proximity to an AGN, acted differently on the evolution of their respective fainter members. When compared to the CenA group, Sculptor seems to be lacking both low and high H i mass objects in the range . It provides much more of a continuum of H i mass towards fainter objects than the CenA group does; the latter seems to have more of a dichotomy between the H i rich and H i deficient objects. Precisely, Sculptor has a single galaxy with no detected H i and , while, on the one hand, CenA has at least 16 galaxies that were not detected in H i and at least eight with . The CenA environment seems much more efficient in removing gas from dwarfs than the Sculptor one. On the other hand CenA also has a much more prominent population of galaxies with than Sculptor.
Gunn & Gott (1972) determined that the ISM of a galaxy will be stripped away by ram pressure if
| (4) |
for a galaxy with an ISM of density and velocity dispersion of , travelling at a velocity through an intergalactic medium of density . By adopting km s-1, a value typical for the studied dwarfs (e. g., Mateo, 1998; Bouchard et al., 2005) and taking a value of km s-1, we find that if , ram pressure will eventually remove all the gas in a low mass dwarf. In the case of the dE ESO269-G066 the ISM density is cm-3 ( inside a presumed radius of 1 kpc). This value is much lower than that of the dIrr ESO324-G024, where cm-3 ( , CFC97, inside a radius of 1 kpc). An IGM density of the order of cm-3 would therefore strip away any gas accumulation in ESO269-G066 but otherwise leave ESO324-G024 intact. These values for are consistent with the values measured by X-ray observations of NGC5128 (Cooke et al., 1978; Feigelson et al., 1981) and of loose galaxy groups (Mulchaey et al., 1996; Helsdon & Ponman, 2000).
Figure 7 shows that, for the faint objects of the CenA group (), there seems to be a threshold in H i masses at values of . All objects below this value have at least a factor of 10 less H i than the ones above. In fact, there is only one detected galaxy below this limit: the dIrr ESO269-G037 with . It seems that the dwarfs situated above the threshold have kept their H i while the ones below are efficiently swept clean of ISM.
Assuming that the threshold indeed exists, we can redefine the morphological classification of dwarf galaxies based on H i properties. In the regime of the CenA group, there are 13 late-type dwarfs ( ) which may keep their ISM for a long period of time. These are objects like [CFC97]Cen6 ( = 1.8). They have an important untapped and stable potential for further star formation. There is also a single detected transition-type galaxy (ESO269-G037) that might currently be loosing its ISM through ram pressure stripping. Finally, there are 12 early-type dwarfs candidates, where no ISM has been detected. Much like Ursa Minor in the Local Group or Scl-dE1 in the Sculptor group, their lack of ISM prohibits any further star formation and they have reached their final evolutionary state. If any of the latter type would contain H i, it should be considered a transition-type object because such low H i content would be short lived and prone to ram pressure stripping. The current sensitivity of H i observations allows to distinguish the late-type dwarfs but does not allow a differentiation between the early and transition type dwarfs at the distance of the CenA group (4.3 Mpc).
Finally, we note that the present investigation has targeted some of the faintest known members of the CenA group. The H i survey for these galaxies, i. e., fainter then , is now complete to an H i mass of . However, it is most likely that not all dwarf galaxies of the CenA or Sculptor groups have been found to date. For example, in the Local Group, 10 of the members are fainter than . In the CenA group there are only four galaxies of the galaxies that are this faint. The advent of next generation optical surveys will probably uncover new group members. These future discoveries and H i followup work will give an even better insight into the properties for galaxies at the faint end of the luminosity function, for different environments.
5 Conclusions
We have presented Parkes single dish and ATCA interferometric H i observations of 18 low luminosity dwarf galaxies belonging to the CenA group, with an emphasis on early-type dwarfs. This was done in order to identify objects with H i reservoirs and, therefore, potential for further star formation. As a result, we can constrain dwarf galaxy evolution scenarios by providing a thorough analysis of a nearby dense environment.
The main conclusions can be summarised as follow:
-
1.
Of the 18 observed dwarfs, five were detected: three were late-type dwarfs and two were of mixed-morphology. None of the early-type objects were found to contain H i. The detection limits on all non-detected early and mixed-type objects are in the range from to , .
-
2.
Unlike the Local Group and the Sculptor group where all mixed-morphology dwarfs are detected in H i, only two of the four CenA mixed-type dwarfs are detected. However, the limits on the non-detections do not exclude H i contents similar to those of other mixed-type dwarfs in the Sculptor or Local Group.
-
3.
The H i masses of the detected objects range from to , the H i mass to luminosity ratios range from 0.04 to 1.81 . The H i velocities vary between 500 and 750 km s-1, compatible with the expected velocities for the CenA group members.
-
4.
There is a gap in H i properties for low mass CenA dwarf galaxies. These objects either have H i masses or are not detected, consequently must have . This gap can be explained by the ram pressure exerted by an IGM of density cm-3.
-
5.
The dE ESO269-G066 has , which is much lower than the value expected from the gas accumulated through normal stellar evolution. The orbit of the dwarf may bring it regularly into the radio-lobes of the the active galaxy NGC5128 constantly sweeping it free of gas. Other galaxies may have been similarly affected by the presence of NGC5128.
-
6.
An H i distribution similar to what is expected from the effects of mild ram pressure is found in UGCA365, ESO384-G016 and, possibly, in ESO269-G037.
Further investigation of denser environments, such as nearby clusters, with equally low H i detection limits are required to establish whether the gap in H i properties of dwarf galaxies is common. If this is the case, it may have profound implications on our understanding of dwarf galaxy evolution.
References
- Babusiaux et al. (2005) Babusiaux, C., Gilmore, G., & Irwin, M. 2005, MNRAS, 359, 985
- Banks et al. (1999) Banks, G. D., Disney, M. J., Knezek, P. M., Jerjen, H., Barnes, D. G., Bhatal, R., de Blok, W. J. G., Boyce, P. J., Ekers, R. D., Freeman, K. C., Gibson, B. K., Henning, P. A., Kilborn, V., Koribalski, B., Kraan-Korteweg, R. C., Malin, D. F., Minchin, R. F., Mould, J. R., Oosterloo, T., Price, R. M., Putman, M. E., Ryder, S. D., Sadler, E. M., Staveley-Smith, L., Stewart, I., Stootman, F., Vaile, R. A., Webster, R. L., & Wright, A. E. 1999, ApJ, 524, 612
- Barnes et al. (2001) Barnes, D. G., Staveley-Smith, L., de Blok, W. J. G., Oosterloo, T., Stewart, I. M., Wright, A. E., Banks, G. D., Bhathal, R., Boyce, P. J., Calabretta, M. R., Disney, M. J., Drinkwater, M. J., Ekers, R. D., Freeman, K. C., Gibson, B. K., Green, A. J., Haynes, R. F., te Lintel Hekkert, P., Henning, P. A., Jerjen, H., Juraszek, S., Kesteven, M. J., Kilborn, V. A., Knezek, P. M., Koribalski, B., Kraan-Korteweg, R. C., Malin, D. F., Marquarding, M., Minchin, R. F., Mould, J. R., Price, R. M., Putman, M. E., Ryder, S. D., Sadler, E. M., Schröder, A., Stootman, F., Webster, R. L., Wilson, W. E., & Ye, T. 2001, MNRAS, 322, 486
- Beaulieu et al. (2006) Beaulieu, S. F., Freeman, K. C., Carignan, C., Lockman, F. J., & Jerjen, H. 2006, AJ, 131, 325
- Bessell et al. (1998) Bessell, M. S., Castelli, F., & Plez, B. 1998, A&A, 333, 231
- Binggeli et al. (1987) Binggeli, B., Tammann, G. A., & Sandage, A. 1987, AJ, 94, 251
- Binggeli et al. (1990) Binggeli, B., Tarenghi, M., & Sandage, A. 1990, A&A, 228, 42
- Blitz & Robishaw (2000) Blitz, L., & Robishaw, T. 2000, ApJ, 541, 675
- Bouchard et al. (2003) Bouchard, A., Carignan, C., & Mashchenko, S. 2003, AJ, 126, 1295
- Bouchard et al. (2006) Bouchard, A., Carignan, C., & Staveley-Smith, L. 2006, AJ, 131, 2913
- Bouchard et al. (2004) Bouchard, A., Da Costa, G. S., & Jerjen, H. 2004, PASP, 116, 1031
- Bouchard et al. (2005) Bouchard, A., Jerjen, H., Da Costa, G. S., & Ott, J. 2005, AJ, 130, 2058
- Buyle et al. (2005) Buyle, P., De Rijcke, S., Michielsen, D., Baes, M., & Dejonghe, H. 2005, MNRAS, 360, 853
- Carignan et al. (1998) Carignan, C., Beaulieu, S., Côté, S., Demers, S., & Mateo, M. 1998, AJ, 116, 1690
- Conselice et al. (2003) Conselice, C. J., O’Neil, K., Gallagher, J. S., & Wyse, R. F. G. 2003, ApJ, 591, 167
- Cooke et al. (1978) Cooke, B. A., Lawrence, A., & Perola, G. C. 1978, MNRAS, 182, 661
- Côté et al. (1997) Côté, S., Freeman, K. C., Carignan, C., & Quinn, P. J. 1997, AJ, 114, 1313
- De Rijcke et al. (2003) De Rijcke, S., Dejonghe, H., Zeilinger, W. W., & Hau, G. K. T. 2003, A&A, 400, 119
- De Rijcke et al. (2004) —. 2004, A&A, 426, 53
- Dottori & Fourcade (1973) Dottori, H. A., & Fourcade, C. R. 1973, A&A, 23, 405
- Dressler (1980) Dressler, A. 1980, ApJ, 236, 351
- Einasto et al. (1974) Einasto, J., Saar, E., Kaasik, A., & Chernin, A. D. 1974, Nature, 252, 111
- Feigelson et al. (1981) Feigelson, E. D., Schreier, E. J., Delvaille, J. P., Giacconi, R., Grindlay, J. E., & Lightman, A. P. 1981, ApJ, 251, 31
- Gallart et al. (2001) Gallart, C., Martínez-Delgado, D., Gómez-Flechoso, M. A., & Mateo, M. 2001, AJ, 121, 2572
- Grebel (2001) Grebel, E. K. 2001, Astrophysics and Space Science Supplement, 277, 231
- Grebel et al. (2003) Grebel, E. K., Gallagher, J. S., & Harbeck, D. 2003, AJ, 125, 1926
- Gunn & Gott (1972) Gunn, J. E., & Gott, J. R. I. 1972, ApJ, 176, 1
- Helsdon & Ponman (2000) Helsdon, S. F., & Ponman, T. J. 2000, MNRAS, 315, 356
- Huchtmeier et al. (2001) Huchtmeier, W. K., Karachentsev, I. D., & Karachentseva, V. E. 2001, A&A, 377, 801
- Huchtmeier et al. (2003) —. 2003, A&A, 401, 483
- Huchtmeier et al. (2000) Huchtmeier, W. K., Karachentsev, I. D., Karachentseva, V. E., & Ehle, M. 2000, A&AS, 141, 469
- Israel (1998) Israel, F. P. 1998, A&A Rev., 8, 237
- Jerjen et al. (2000a) Jerjen, H., Binggeli, B., & Freeman, K. C. 2000a, AJ, 119, 593
- Jerjen et al. (1998) Jerjen, H., Freeman, K. C., & Binggeli, B. 1998, AJ, 116, 2873
- Jerjen et al. (2000b) —. 2000b, AJ, 119, 166
- Junkes et al. (1993) Junkes, N., Haynes, R. F., Harnett, J. I., & Jauncey, D. L. 1993, A&A, 269, 29
- Karachentsev et al. (2004) Karachentsev, I. D., Karachentseva, V. E., Huchtmeier, W. K., & Makarov, D. I. 2004, AJ, 127, 2031
- Karachentsev et al. (2002) Karachentsev, I. D., Sharina, M. E., Dolphin, A. E., Grebel, E. K., Geisler, D., Guhathakurta, P., Hodge, P. W., Karachentseva, V. E., Sarajedini, A., & Seitzer, P. 2002, A&A, 385, 21
- Karachentsev et al. (2006) Karachentsev, I. D., Tully, R. B., Dolphin, A., Sharina, M., Makarova, L., Makarov, D., Kashibadze, O. G., Karachentseva, V., Sakai, S., Shaya, E. J., & Rizzi, L. 2006, astro-ph/0603091
- Karachentseva & Karachentsev (1998) Karachentseva, V. E., & Karachentsev, I. D. 1998, A&AS, 127, 409
- Karachentseva & Karachentsev (2000) —. 2000, A&AS, 146, 359
- Koribalski et al. (2004) Koribalski, B. S., Staveley-Smith, L., Kilborn, V. A., Ryder, S. D., Kraan-Korteweg, R. C., Ryan-Weber, E. V., Ekers, R. D., Jerjen, H., Henning, P. A., Putman, M. E., Zwaan, M. A., de Blok, W. J. G., Calabretta, M. R., Disney, M. J., Minchin, R. F., Bhathal, R., Boyce, P. J., Drinkwater, M. J., Freeman, K. C., Gibson, B. K., Green, A. J., Haynes, R. F., Juraszek, S., Kesteven, M. J., Knezek, P. M., Mader, S., Marquarding, M., Meyer, M., Mould, J. R., Oosterloo, T., O’Brien, J., Price, R. M., Sadler, E. M., Schröder, A., Stewart, I. M., Stootman, F., Waugh, M., Warren, B. E., Webster, R. L., & Wright, A. E. 2004, AJ, 128, 16
- Lee et al. (2003) Lee, H., Grebel, E. K., & Hodge, P. W. 2003, A&A, 401, 141
- Lo et al. (1993) Lo, K. Y., Sargent, W. L. W., & Young, K. 1993, AJ, 106, 507
- Marcolini et al. (2004) Marcolini, A., Brighenti, F., & D’Ercole, A. 2004, MNRAS, 352, 363
- Mashchenko et al. (2004) Mashchenko, S., Carignan, C., & Bouchard, A. 2004, MNRAS, 352, 168
- Mateo (1998) Mateo, M. L. 1998, ARA&A, 36, 435
- Mayer et al. (2001) Mayer, L., Governato, F., Colpi, M., Moore, B., Quinn, T., Wadsley, J., Stadel, J., & Lake, G. 2001, ApJ, 547, L123
- Moore et al. (1996) Moore, B., Katz, N., & Lake, G. 1996, ApJ, 457, 455
- Mould et al. (1990) Mould, J. R., Bothun, G. D., Hall, P. J., Staveley-Smith, L., & Wright, A. E. 1990, ApJ, 362, L55
- Mulchaey et al. (1996) Mulchaey, J. S., Davis, D. S., Mushotzky, R. F., & Burstein, D. 1996, ApJ, 456, 80
- Olszewski et al. (2006) Olszewski, E. W., Mateo, M., Harris, J., Walker, M. G., Coleman, M. G., & Da Costa, G. S. 2006, AJ, 131, 912
- Pedraz et al. (2002) Pedraz, S., Gorgas, J., Cardiel, N., Sánchez-Blázquez, P., & Guzmán, R. 2002, MNRAS, 332, L59
- Putman et al. (2002) Putman, M. E., de Heij, V., Staveley-Smith, L., Braun, R., Freeman, K. C., Gibson, B. K., Burton, W. B., Barnes, D. G., Banks, G. D., Bhathal, R., de Blok, W. J. G., Boyce, P. J., Disney, M. J., Drinkwater, M. J., Ekers, R. D., Henning, P. A., Jerjen, H., Kilborn, V. A., Knezek, P. M., Koribalski, B., Malin, D. F., Marquarding, M., Minchin, R. F., Mould, J. R., Oosterloo, T., Price, R. M., Ryder, S. D., Sadler, E. M., Stewart, I., Stootman, F., Webster, R. L., & Wright, A. E. 2002, AJ, 123, 873
- Read & Gilmore (2005) Read, J. I., & Gilmore, G. 2005, MNRAS, 356, 107
- Rejkuba (2004) Rejkuba, M. 2004, A&A, 413, 903
- Rejkuba et al. (2006) Rejkuba, M., da Costa, G. S., Jerjen, H., Zoccali, M., & Binggeli, B. 2006, A&A, 448, 983
- Robishaw et al. (2002) Robishaw, T., Simon, J. D., & Blitz, L. 2002, ApJ, 580, L129
- Schlegel et al. (1998) Schlegel, D. J., Finkbeiner, D. P., & Davis, M. 1998, ApJ, 500, 525
- Simien & Prugniel (2002) Simien, F., & Prugniel, P. 2002, A&A, 384, 371
- St-Germain et al. (1999) St-Germain, J., Carignan, C., Côté, S., & Oosterloo, T. 1999, AJ, 118, 1235
- Thomson (1992) Thomson, R. C. 1992, MNRAS, 257, 689
- Tolstoy et al. (2004) Tolstoy, E., Irwin, M. J., Helmi, A., Battaglia, G., Jablonka, P., Hill, V., Venn, K. A., Shetrone, M. D., Letarte, B., Cole, A. A., Primas, F., Francois, P., Arimoto, N., Sadakane, K., Kaufer, A., Szeifert, T., & Abel, T. 2004, ApJ, 617, L119
- van den Bergh (1994) van den Bergh, S. 1994, ApJ, 428, 617
- van Zee et al. (2004) van Zee, L., Skillman, E. D., & Haynes, M. P. 2004, AJ, 128, 121
- Warren et al. (2006) Warren, B. E., Jerjen, H., & Koribalski, B. S. 2006, AJ, 131, 2056
- Young & Lo (1997) Young, L. M., & Lo, K. Y. 1997, ApJ, 476, 127