Characterizing Young Brown Dwarfs using Low Resolution Near-IR Spectra
Abstract
We present near-infrared (1.0–2.4 m) spectra confirming the youth and cool effective temperatures of 6 brown dwarfs and low mass stars with circumstellar disks toward the Chamaeleon II and Ophiuchus star forming regions. The spectrum of one of our objects indicates that it has a spectral type of L1, making it one of the latest spectral type young brown dwarfs identified to date. Comparing spectra of young brown dwarfs, field dwarfs, and giant stars, we define a 1.49–1.56 m H2O index capable of determining spectral type to 1 sub-type, independent of gravity. We have also defined an index based on the 1.14 m sodium feature that is sensitive to gravity, but only weakly dependent on spectral type for field dwarfs. Our 1.14 m Na index can be used to distinguish young cluster members ( Myr) from young field dwarfs, both of which may have the triangular H-band continuum shape which persists for at least tens of Myr. Using Teff’s determined from the spectral types of our objects along with luminosities derived from near and mid-infrared photometry, we place our objects on the H-R diagram and overlay evolutionary models to estimate the masses and ages of our young sources. Three of our sources have inferred ages (10–30 Myr) significantly older than the median stellar age of their parent clouds (1–3 Myr). For these three objects, we derive masses 3 times greater than expected for 1–3 Myr old brown dwarfs with the bolometric luminosities of our sources. The large discrepancies in the inferred masses and ages determined using two separate, yet reasonable methods, emphasize the need for caution when deriving or exploiting brown dwarf mass and age estimates.
Subject headings:
stars: formation, stars: low-mass, brown dwarfs, infrared: stars1. Introduction
In recent years, surveys have begun to find young brown dwarfs with spectral types extending into the L dwarf regime (Kirkpatrick et al. 2006; Luhman 2006; Lucas et al. 2001). The low gravity, and hence youth, of these objects has typically been determined via a triangular H-band continuum shape which exists for brown dwarfs until they are at least tens of Myr old (log 4.5 Kirkpatrick et al. 2006). The masses of these sources have been estimated by placing them on an H-R diagram, with temperatures determined by either fitting theoretical spectra to observed spectra (Lucas et al. 2001) or by using a spectral type-temperature relationship that is intermediate between dwarf and giant stars (Luhman 2006). Both of these methods have systematic uncertainties which grow as one moves to later spectral types.
Spectral types of several young, late-M type brown dwarfs have been determined by comparing observed optical spectra to spectra of giants and dwarfs, with the best fit usually being an average of giant and dwarf spectra (Guieu et al. 2006; Luhman 2004a; Briceño et al. 2002). The spectral energy distributions (SED’s) of late-M type objects peak in the near-IR (Cushing et al. 2005), making them, particularly in the presence of foreground reddening, easier to observe in the near-IR than in the optical. An infrared spectral type classification scheme for young, late-M type objects has been developed by comparing their infrared spectra to those of optically classified young objects (Luhman et al. 2004). Spectral types can then be converted to Teff using a temperature scale (e.g. Luhman et al. 2003) which is intermediate to SpT-Teff relationships for field M dwarfs (Golimowski et al. 2004) and M giants (Perrin et al. 1998).
The tools available for classifying young L type brown dwarfs are considerably less well-developed than the tools for classifying young M stars and brown dwarfs. The L subclass for field dwarfs is defined by the disappearance of TiO and VO bands as seen in their optical spectra (Kirkpatrick et al. 1999). To date, however, there are only five young, optically classified L dwarfs, three of which are field objects displaying spectral signatures of youth (Kirkpatrick et al. 2006; Luhman 2006; Kirkpatrick et al. 2001) and two of which were recently identified in nearby star-forming regions (Allers et al. 2006; Jayawardhana & Ivanov 2006a). The young L dwarfs identified to date are early-L type (L0-L2); it remains unclear how to classify cooler young brown dwarfs, if and when they are found. There are no L giant stars that could be combined with field dwarf observations to fit a spectral type to young objects. Even if a spectral type for a young L dwarf could be determined, the SpT–Teff relationship is unknown for young L brown dwarfs, and there is no L-giant sequence to which one could compare the temperature–spectral type relation. In this paper we discuss the spectral properties of a sample of six M6–L1 young brown dwarfs and low mass stars identified by Allers et al. (2006), and by comparison to field dwarfs and giants, develop an empirical scheme for determining the SpT and verifying the low-gravity of young objects, with a view toward studying young objects of even later spectral type. We derive effective temperatures using the Luhman et al. (2003) SpT-Teff relation and place our objects on an H–R diagram. We then critically examine the disagreements for a few objects between the masses and ages derived from the H–R diagram and those reported in Allers et al. (2006).
2. A Sample of Young Brown Dwarfs
The Spitzer Legacy Program, “From Molecular Cores to Planet Forming Disks” (c2d; Evans et al. 2003) provides IRAC and MIPS imaging of 5 different star forming regions covering a total of 16 square degrees. Allers et al. (2006) conducted a deep near-IR survey (10 limits of better than 22.9, 19.7, 19.1 and 18.6 magnitudes in I, J, H, and Ks respectively), covering 1.5 square degrees towards regions in the Chamaeleon II, Ophiuchus, and Lupus I molecular clouds lying within the Legacy Program boundaries, having modest total extinction (A 7.5 magnitudes; Cambrésy 1999) and containing or close to known T Tauri stars (Wilking et al. 1987; Hartigan 1993; Schwartz 1977). The survey resulted in a sample of 19 candidate young stars and brown dwarfs with disks (Allers et al. 2006) found by dereddening objects to the I, J, H and Ks colors of young brown dwarfs, and selecting objects showing mid-IR excess emission. The mid-IR excess assured that the objects were young, assuming that the disk lifetimes are comparable to those of low-mass YSOs (6 Myr; Haisch et al. 2001). The luminosities of objects in the sample were determined by integrating the dereddened source flux from 0.8 to 3.6 m. Average uncertainties in luminosity were 0.2 dex in log(L∗). The Teff, mass and log of the objects were estimated from the luminosity using model isochrones (Baraffe et al. 2003) and assuming an age of 3 Myr for Chamaeleon II and 1 Myr for Ophiuchus and Lupus I. The faintest source in the Allers et al. (2006) survey showing evidence of a circumstellar disk from 5.8 to 24 m has an observed Ks magnitude of 15.98. All of the sources in the sample are well above their detection limits in the near-IR, thus uncertainties in their photometry are dominated by systematics, approximately 0.05, 0.03, 0.03, & 0.03 magnitudes in I, J, H, and Ks respectively. The Allers et al. (2006) sample has luminosities of 0.56 log(L∗/L⊙) -3.11 and five sources with possible masses below 12 MJ.
3. Near-IR Spectra
3.1. Observations and Data Reduction
We obtained near-IR (0.9–2.5 m) spectra of 6 candidate young brown dwarfs in the Ophiuchus and Chamaeleon II molecular clouds (#1, #2, #5, #11, & #14 in Allers et al. (2006) along with one additional object 1.9″ north of #5). Our spectra were taken on the nights of 2005 April 29 through May 1 using the CorMASS spectrometer111CorMASS is supported by a generous gift to the University of Virginia Astronomy Department from the F.H. Levinson Fund of the Peninsula Community Foundation. (Wilson et al. 2001) on the Landon Clay (Magellan II) telescope at Las Campanas Observatory. For comparison, we also obtained CorMASS spectra of 4 young brown dwarfs in Chamaeleon I with spectral types known from optical observations (Cha H 10 (M6.25), Cha H 11 (M7.25), CHSM 17173 (M8), OTS44 (M9.5); Luhman 2004a; Luhman et al. 2004), 3 field dwarfs (Gl 406 (M6V), LHS 2065 (M9V), Kelu-1 (L2V); Leggett et al. 2001, 2002), and a late-type giant (Br1219-1336 (M9III); Kirkpatrick et al. 1997). The details of our observations are listed in Table 1. For most targets, two exposures were obtained with the object on the slit followed by one exposure with the object off the slit, and this pattern was repeated as necessary. The spectra were reduced with a modified version of the Spextool package (Cushing et al. 2004), which included a correction for telluric absorption following the method described in Vacca et al. (2003).
| Source | Date | Airmass | N exptime |
|---|---|---|---|
| cha1257-7701 | 042905 | 1.49 | 6x180 |
| cha1258-7709 | 050105 | 1.52 | 4x45 |
| cha1305-7739 | 042905 | 1.51 | 6x180 |
| oph1622-2405B | 042905 | 1.01 | 4x120 |
| oph1622-2405A | 042905 | 1.01 | 2x180,2x120 |
| oph1623-2338 | 042905 | 1.03 | 4x120 |
| Cha H 10 | 042905 | 1.53 | 6x120 |
| Cha H 11 | 042905 | 1.52 | 6x120 |
| CHSM 17173 | 042905 | 1.48 | 6x120 |
| OTS44 | 043005 | 1.49 | 6x120 |
| Gl 406 | 050105 | 1.26 | 4x0.5 |
| LHS 2065 | 050105 | 1.13 | 4x20 |
| Kelu–1 | 043005 | 1.01 | 4x90 |
| BR 1219-1336 | 050105 | 1.06 | 4x1 |
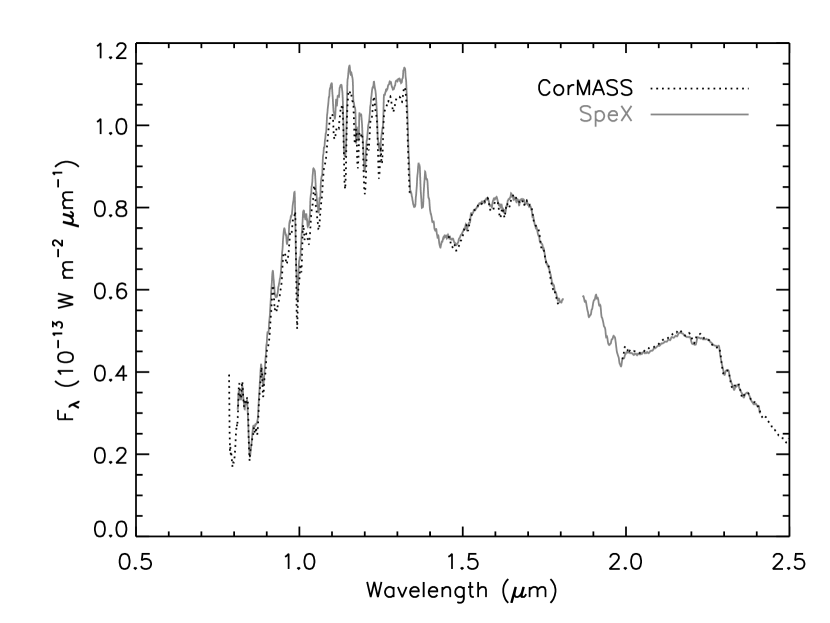
We establish the absolute flux calibration of our R300 CorMASS spectra in W m-2 m-1 by calculating Fλ in J, H, and Ks from photometry of our sources (Allers et al. 2006). For each spectrum, we use 2MASS photometry of young, Chamaeleon I standards or our own near-IR photometry (Allers et al. 2006) to calculate the flux calibration in J, H, & Ks and we apply the average correction of the three bands to the entire near-IR spectrum. A comparison of a calibrated CorMASS spectrum to a SpeX spectrum of LHS 2065 (Cushing et al. 2005) is shown in Figure 1. We used near-IR photometry of LHS 2065 from Leggett et al. (2001) to calibrate our CorMASS spectrum into absolute flux units. The SpeX spectrum of LHS 2065 was flux-calibrated using an observed A0V star (Cushing et al. 2005), and has only been smoothed to R300—we did not alter the flux levels. There is good agreement between not only the flux levels of the spectra, but also the spectral shapes and features. The LHS 2065 CorMASS flux is slightly (5%) below the SpeX flux in the J band. This level of difference is not surprising given that the CorMASS observations were not taken with the slit aligned to the parallactic angle. To quantify the importance of the spectral tilt added by differential atmospheric refraction and/or poor instrumental flux calibration, we can deredden the spectra to achieve a best match with the SpeX results for field dwarfs where spectra taken with both instruments are available, and use the AV correction as a measure of the uncertainty due to spectral tilt. For LHS 2065, the H and K band fluxes in the CorMASS and SpeX spectra agree to within 1%; dereddening its CorMASS spectrum by AV = 0.2 magnitudes (using the reddening law of Fitzpatrick (1999)), increases its J-band flux so that it agrees with its SpeX spectrum. Similar comparisons of CorMASS and SpeX spectra for Gl 240 (M6V) and Kelu-1 (L2V) (Leggett et al. 2002) show that the absolute flux calibrations of SpeX and CorMASS agree to within 10%, and any differences in the shape of the spectra can be resolved by reddening or dereddening the CorMASS spectra by A.
We also obtained observations of G196-3B, a wide L dwarf companion to the young (100 Myr) M dwarf G196-3 (Rebolo et al. 1998). Our near-IR spectrum of the object was taken on 2002 May 30 UT using the SpeX spectrograph (Rayner et al. 2003) on NASA’s Infrared Telescope Facility (IRTF), located on the summit of Mauna Kea, Hawaii. We used the SXD mode to obtain simultaneous spectra from 1.1–2.4 m. The slit was aligned with the parallactic angle, and the target was observed at an airmass of 1.3–1.4. We used the 0.3″ wide slit, producing a spectum with a resolution () of 2000. We obtained nine two-minute exposures for a total integration time of 18 minutes, with the object dithered along the slit between exposures. We observed a nearby A0 star for telluric calibration. The spectra were processed using the facility reduction pipline Spextool (Cushing et al. 2004).
3.2. Spectral Types and Extinction
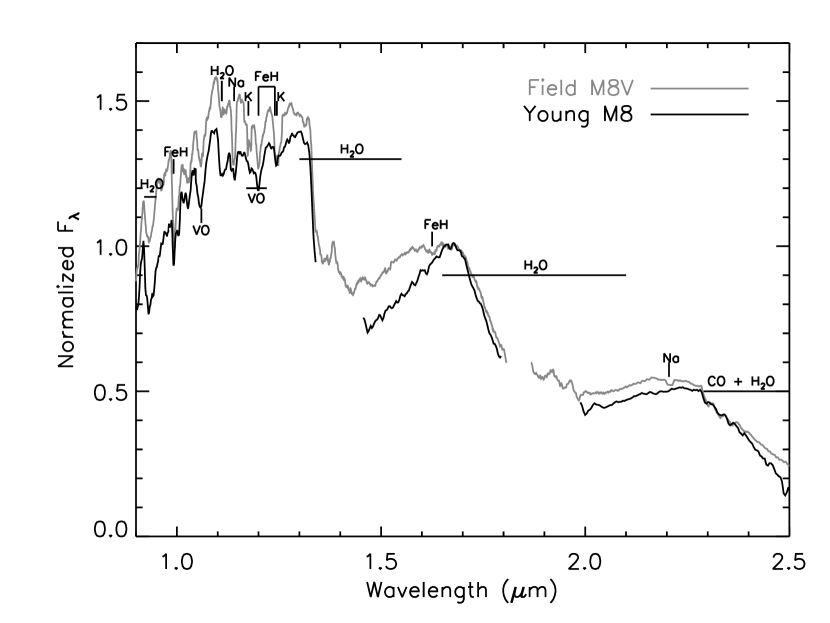
Even at low-resolution, there are significant differences between the infrared spectra of young brown dwarfs and older field dwarfs. Figure 2 shows the CorMASS spectrum of CHSM 17173, a young M8 object in Chamaeleon I (Luhman 2004a), along with the SpeX spectrum (smoothed to R300) of the M8V field dwarf, vB10 (Cushing et al. 2005). Certainly the most dramatic difference between the two spectra is in the H band. The young brown dwarf has a much more sharply peaked H band spectrum, whereas the field dwarf has a plateau from 1.6–1.7 m. While the spectra drop equally quickly at the long wavelength end of the H band, the short wavelength end of this band has much deeper H2O absorption in the spectrum of the young brown dwarf. The triangular shape of the H band for young brown dwarfs has been noted in previous studies (e.g. Luhman et al. 2004; Lucas et al. 2001). The K band spectrum of the young brown dwarf reaches a maximum at a longer wavelength than the field dwarf spectrum, and the young M8 spectrum drops off more steeply from 2.3 to 2.5 m than the field dwarf spectrum. The CHSM 17173 spectrum does not have any trace of the 2.2 m NaI absorption feature which is still readily apparent in the spectrum of vB10. The strongest features in the J band spectra of late M field dwarfs include absorption bands of H2O (0.92 and 1.11 m), VO (1.07 and 1.18 m), and FeH (0.99, 1.20, & 1.24 m) as well as neutral metal lines of NaI (1.14 m) and KI (1.17 and 1.25 m). The young brown dwarf shows deeper and wider H2O features than the field dwarf. The VO absorption is deeper at 1.07 m in the young brown dwarf than the field dwarf, and is blended with KI and FeH at 1.18 m. The young brown dwarf does not have as deep of NaI features as the field dwarf, and shows no noticeable 1.17 m KI absorption. The 1.25 KI/FeH and 1.18 KI/FeH/VO blended features are much more prominent in the field dwarf than in the young object. The noticable differences between the young M8 brown dwarf and field M8 dwarf spectra indicate that we can use the R300 spectra to confirm the youth of our sample, independent of the presence of circumstellar disks.
We determine the spectral types of our objects by comparing their near-IR spectra to spectra of young brown dwarfs in Chamaeleon I with known spectral types determined from optical spectra (Cha H 10 (M6.25), Cha H 11 (M7.25), CHSM 17173 (M8); Luhman 2004a, OTS44 (M9.5); Luhman, in preparation). At 2 Myr old (Luhman 2004a), the Chamaeleon I cloud is roughly the same age as Ophiuchus (1 Myr) and Chamaeleon II (3 Myr). Thus, our Chamaeleon I standards likely have gravities similiar to the sources in our sample, making them acceptable comparison sources. The spectral types of Cha H 10, Cha H 11, CHSM 17173, and OTS44 were determined by comparison of their low resolution red optical spectra to the average spectra of field dwarfs and giants at a given spectral type (Luhman 2004a, Luhman et al. in prep.). Comerón et al. (2000) determine later spectral types for Cha H 10 and Cha H 11 (M7.5 and M8 respectively) than those published by Luhman (2004a), possibly due to their comparison to the optical spectra of field dwarfs only. To determine spectral types later than M9.5, we also include SpeX near-IR spectra (smoothed to R300) of two young field brown dwarfs, 2MASS0141–4633 (L0; Kirkpatrick et al. 2006) and G196–3B (L2; Rebolo et al. 1998; Kirkpatrick et al. 2001). Though 2MASS0141–4633 and G196–3B are older (1–50 Myr and 60–300 Myr old; Kirkpatrick et al. 2006, 2001; Rebolo et al. 1998) than our objects in Chamaeleon II and Ophiuchus, their spectra show the distinct triangular H-band shape indicative of youth. The CorMASS spectra of Cha H 10, Cha H 11, CHSM 17173, and OTS44, dereddened by their published AV’s (Luhman 2004a; Luhman et al. 2004), along with SpeX spectra of 2MASS0141–4633 and G196–3B smoothed to R300, are displayed in Figure 3.
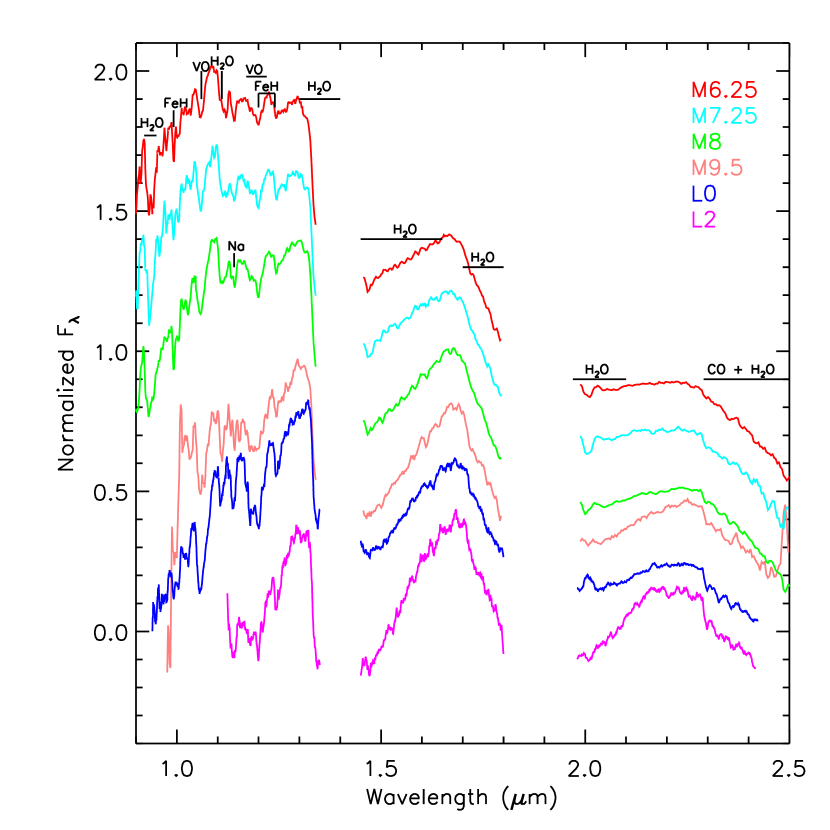
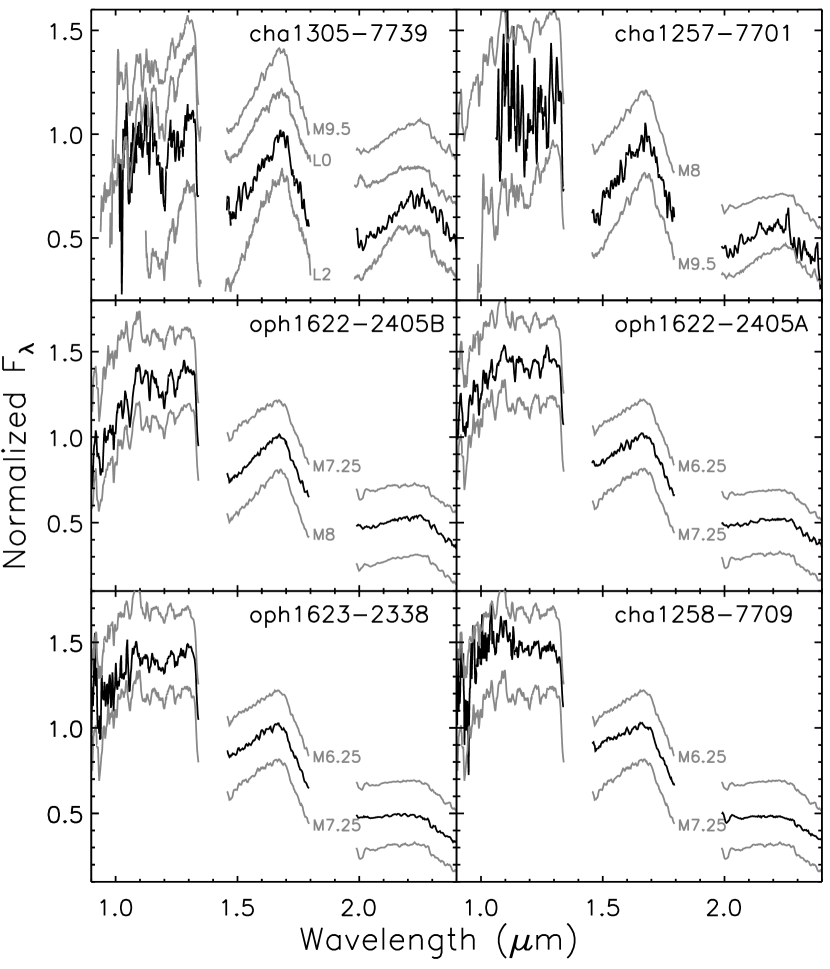
We determine the reddening of the objects in our sample by comparison to each of the young standards using the reddening law of Fitzpatrick (1999), starting with the AV from Allers et al. (2006) and adjusting the value of AV until the fluxes (normalized at 1.68 m) in the J and H bands agree with the fluxes of the standard. Our method assumes that the circumstellar disk makes a negligible contribution to our near-IR spectra, a reasonable assumption given that brown dwarfs disks are too cool to provide any significant near-IR excess emission (Liu et al. 2003; Natta & Testi 2001), particularly in the J and H bandpasses. The continuum shape of the spectra are very sensitive to AV; we can easily distinguish between A. After dereddening our spectra, we compare the overall shape of the spectra and their molecular features. The shape of the H band changes substantially from M6.25 to L2, as the 1.4 to 1.65 m H2O features become deeper and create a triangular shape to the band. The H2O absorption on the short wavelength side of the K band also changes with spectral type. The CO bandhead at 2.3 m becomes more noticeable at later spectral types, having a sharp difference from M6.25 to M7.25. In the J band, the FeH and VO features become more prominent with absorption features at 1.07, 1.20 and 1.24 m becoming wider and deeper at later spectral types. Looking at all of these features together, we can distinguish SpT to within 1 subclass. For sources with spectral types later than M9.5, we are dependent on comparisons to young field objects. Older field dwarfs have intrinsically bluer near-IR spectra and shallower H2O absorption features than younger brown dwarfs, effects noted by Kirkpatrick et al. (2006) and McGovern et al. (2004). Thus, though they have the triangular H-band shape indicative of youth, the spectra of our young field standards are likely intrinsically bluer and have shallower H2O absorption features than would be expected for younger (5 Myr) cluster brown dwarfs of the same spectral type. Figure 4 displays our dereddened spectra, along with the dereddened spectra of the closest-matching young brown dwarf standards (Figure 3). Spectral types and AV’s for our objects are listed in Table 2. A discussion of our derivation of spectral type for each object (ordered from earlier to later spectral type) follows.
3.2.1 Cha1258-7709
Cha1258-7709 was first identified as the young brown dwarf candidate, ISO-ChaII 13, based on its large mid-IR excess (Persi et al. 2003). We deredden cha1258-7709 by A to make the J and H band flux levels (normalized to Fλ at 1.68m) agree with the flux levels of Cha H 10. The slope of the H and K band H2O features in cha1258-7709 are best matched to the spectrum of Cha H 10 (M6.25), but are slightly less steep. The triangular shape of the H band spectrum confirms this object’s youth. The CO bandhead at 2.3 m is slightly more pronounced in the spectrum of cha1258-7709 than for Cha H 10. The J-band FeH and H2O features are well matched. Overall, the cha1258-7709 spectrum matches the spectrum of Cha H 10 (M6.25) quite well, but since the H and K band slopes are slightly shallower in cha1258-7709, we assign a spectral type of M6. Our spectral type determination is slightly earlier than that reported from its optical spectrum (M7; Alcalá et al. 2006), though the two spectral types agree to within our uncertainties. Alcalá et al. (2006) find a best fit AV of 5.00.5 for cha1258-7709, while we determine an AV that is more than a factor of 2 larger, and in better agreement with the photometrically determined AV of Allers et al. (2006). Dereddening the near-IR spectrum of cha1258-7709 by an AV of 5.0 rather than 10.4 does not allow a reasonable fit to any of our near-IR young spectral standards.
3.2.2 Oph1623-2338
The spectrum of oph1623-2338, dereddened by A has its closest match to the spectrum of Cha H 11 (M7.25). The slopes of the H2O features in the H and K band are much shallower than for a young M8 object, and are somewhat shallower than Cha H 11. Comparison to a young M6.25 spectrum, however, yields a poor match of the FeH features and the 2.3 m CO bandhead, which are much deeper for oph1623-2338. The CO bandhead agrees best with the spectrum of Cha H 11 (M7.25). We assign a spectral type of M7 to oph1623-2338.
3.2.3 Oph1622-2405A
Oph1622-2405A is not in the Allers et al. (2006) sample because in the c2d catalogs, its 5.8 and 8.0 m mid-IR fluxes were not resolved from a source 1.9″ to the south. The binary nature of oph1622-2405 is discussed in Allers (2005), Luhman et al. (2007), Close et al. (2006), and Jayawardhana & Ivanov (2006b). The spectrum of oph1622-2405A, dereddened by AV=-0.2, is best matched to Cha H 11 (M7.25). The published AV value for Cha H 11 (A; Luhman 2004a) might be underestimated, and an AV of -0.2 for an unreddened object is well within our uncertainty of A0.5. We assign an AV of 0.0 for oph1622-2405A. The H2O, VO, and CO features of oph1622-2405A agree quite well with Cha H 11. We assign a spectral type of M7 to oph1622-2405A. Our spectral type is in agreement with the spectral type derived from its optical spectrum (M7.25) by Luhman et al. (2007), but is earlier than the spectral type (M9) reported by Jayawardhana & Ivanov (2006b). The 1.14 m NaI feature is slightly stronger and the 1.11 m H2O feature is slightly weaker in oph1622-2405A than in Cha H 11, which may be indicative of a slightly higher gravity (though still well below the gravities of field dwarfs) for oph1622-2405A.
3.2.4 Oph1622-2405B
Oph1622-2405B dereddened by A matches the spectrum of CHSM 17173 (M8) almost perfectly. The band shapes, FeH, VO, and CO features all agree very well between oph1622-2405B and CHSM 17173, so we assign a spectral type of M8 to oph1622-2405B. As is the case for oph1622-2405A, the J-band NaI and H2O features in oph1622-2405B hint at a slightly higher gravity than CHSM 17173. Based on optical follow-up this souce has a spectral type of M8.75-M9 (Luhman et al. 2007; Jayawardhana & Ivanov 2006a), which agrees with our spectral type determination to within the uncertainties.
3.2.5 Cha1257-7701
The spectrum of cha1257-7701 has the lowest S/N of any of our CorMASS spectra, so comparison of the FeH and CO features is difficult, and we must base our comparison on the continuum shapes of the bands. Compared to OTS44 (M9.5) and 2MASS0141–4633 (L0), cha1257-7701 dereddened by A has similar H and K band shapes, but its flux level from 1.0 to 1.2 m is noticibly higher than for both OTS44 and 2MASS0141–4633, which indicates an earlier spectral type (notice the J-band spectral shapes in Figure 3). The J-band continuum shape of cha1257-7701, dereddened by AV=5.5, matches CHSM 17173 fairly well, but the H and K band H2O absorption features are noticibly deeper in cha1257-7701. The spectrum of cha1257-7701 appears intermediate to that of CHSM 17173 (M8) and OTS44/2MASS0141–4633 (M9.5/L0). We thus assign a spectral type of M9 and an AV of 4.01.0 to cha1257-7701. Our spectral type agrees with the spectral type of cha1257-7701 determined from its optical spectrum (Jayawardhana & Ivanov 2006a).
3.2.6 Cha1305-7739
The H-band spectrum of cha1305-7739 (dereddened by A) is fairly similar to that of OTS44 (M9.5). The 1.5–1.7 m slope of cha1305-7739 is steeper than 2MASS0141–4633 (L0), but clearly not as steep as G196–3B (L2). Cha1305-7739 has a more sharply peaked K band spectrum than both OTS44 and 2MASS0141–4633, and deeper and wider 1.2 m VO/FeH/KI and 1.25 m FeH/KI features, indicating a later spectral type for cha1305-7739 than OTS44 and 2MASS0141–4633. In general, the spectrum of cha1305-7739 appears intermediate between 2MASS0141–4633 and G196–3B. We assign a spectral type of L1 to cha1305-7739, making it among the latest type young brown dwarfs discovered to date. The strengths of the H2O absorption features in the near-IR are known to become weaker for higher gravity objects (e.g. McGovern et al. 2004). Our young field standards are likely to have slightly higher gravities, and thus shallower H2O absorption features at a given spectral type, than young objects in Chamaeleon II and Ophiuchus. As a result, using the young field dwarfs as standards for determining the spectral type of cha1305-7739 could result in a spectral type determination that is too late, though the magnitude of this effect is unknown. The L spectral class for field dwarfs is defined by the absence of TiO in their optical spectra. The spectral type determined from the optical spectroscopy followup of cha1305-7739 is L02 (Jayawardhana & Ivanov 2006a); in good agreement with our near-IR determined spectral type.
3.2.7 Spectral Type Sensitive Indices
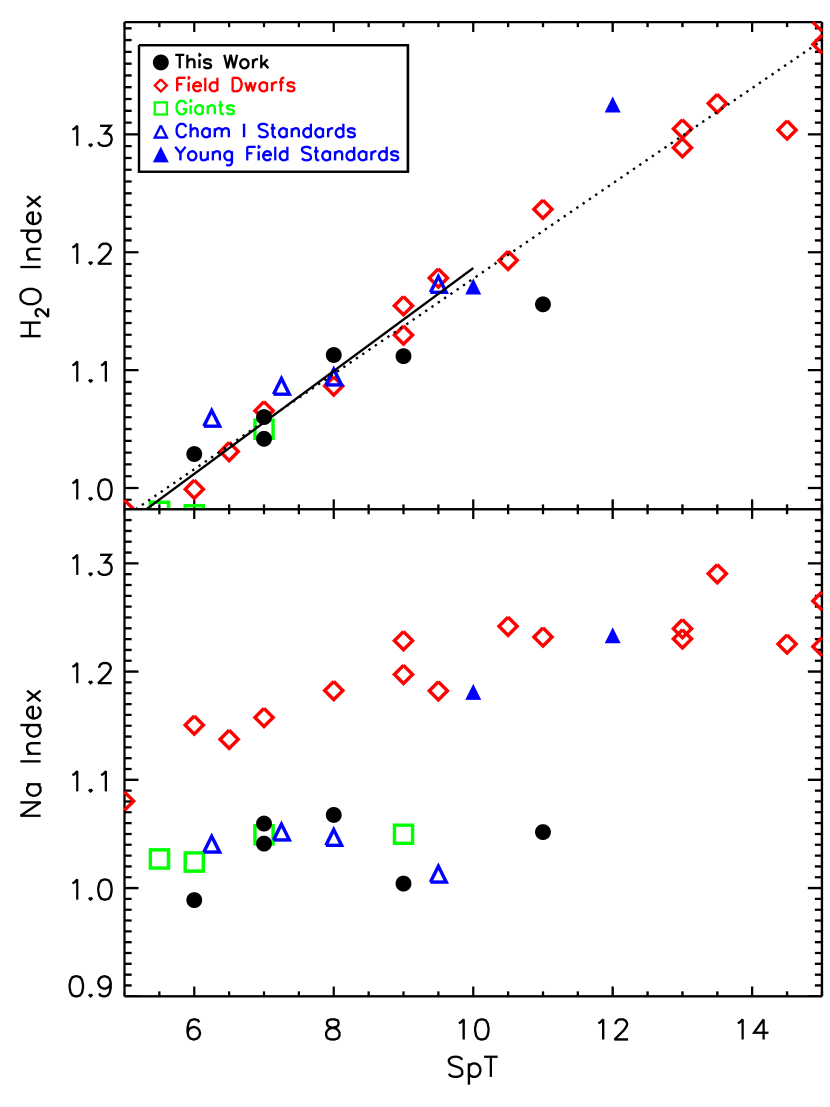
Several near-IR spectral indices have been suggested for use in determining spectral type. The H2O bands are commonly used in obtaining near-IR spectral indices used for classification, particularly for field brown dwarfs (Geballe et al. 2002; Reid et al. 2001; Delfosse et al. 1999). We tested several suggested H2O indices found in the literature (Gorlova et al. 2003; Geballe et al. 2002; Reid et al. 2001; Lucas et al. 2001; Delfosse et al. 1999) on our spectra of field dwarfs, young dwarfs and giants, and found that the index-SpT relationships based on these indices are highly gravity dependent. Thus, determining the spectral type from H2O indices in the literature requires prior knowledge about the gravity of the object. Given the differences in the shape of H2O absorption features between field and young dwarfs (Figure 2), this is not surprising. One feature to note in Figure 2 is that the slope of the blue end of the H band (1.50–1.57 m) is very similar in the two spectra, hinting that an H2O index measuring the slope of this feature might be insensitive to gravity. By combining our data for field dwarfs, young brown dwarfs and giants, along with additional field dwarf and giant spectra from the IRTF Spectral Library (Cushing et al. 2005), we can test indices as a function of spectral type and gravity. We find that a spectral index defined as yields an index-SpT relationship that is independent of gravity (Figure 5). Fitting a line to the index versus spectral types of field dwarfs, giants, and young standards for spectral types of M5–L0 (solid line in Figure 5), we find a SpT–index relation:
| (1) |
Our fit includes uncertainties in SpT of 0.5 for field dwarfs and giants (John Rayner and J. Davy Kirkpatrick, personal comm.), 0.25 for our Chamaeleon I standards (Luhman 2004a), and 1 for 2MASS0141–4633 (J. Davy Kirkpatrick, personal comm.), as well as uncertainties in the index calculated from the spectra themselves. The dispersion of the field dwarfs, giants, and young standards about the linear fit is 0.017 in the index. For an object with a spectral type of M8, the uncertainties in the linear fit correspond to uncertainties of 0.04 in the index and 1.0 in the sub-type. The S/N per resolution element (at R300) at the wavelength of the feature needed to achieve an uncertainty in the spectrum equal the uncertainty in the fit to the data is 30. Changing the AV by which the spectra are dereddened by 1 magnitude changes the H2O index by 0.011. We also show a linear fit to the field dwarf indices for SpT’s of M5–L5 (dotted line in Figure 5), giving a SpT–index relation for M5–L5 field dwarfs of:
| (2) |
The SpT–index relations for M5–L5 field dwarfs and M5–L0 field dwarfs, giants, and young standards are very similar. This hints that our SpT–index relation could be used to derive the spectral types of young brown dwarfs later than L0 (for which young, optically-classified standards in clusters do not yet exist). The SpT of our sources derived from the two relations differ by 0.25 sub-types at most, which is much less than the uncertainties from the linear fit. The spectral types of the sources in our sample, as determined from the value of the index, agree very well with the spectral types determined by matching their entire near-IR spectra to our young standards. The largest deviation is 1.5 subtypes, but the others deviate by less than 0.7 subtypes, well within our 1 subtype uncertainty in spectral type determination.
3.2.8 Gravity sensitive indices
Differences in the gravities of young brown dwarfs, field dwarfs and giants are evident in several near-IR spectral features. Alkali metal lines of KI and NaI (e.g. McGovern et al. 2004; Gorlova et al. 2003; Kirkpatrick et al. 2006; Lucas et al. 2001) are stronger in objects with higher gravity, as a larger amount of KII and NaII can recombine at the higher atmospheric pressures in field dwarfs to form neutrals. Gorlova et al. (2003) derive a relationship for log with the pseudo-equivalent width of KI, but limit it to spectral types between M6 and M8. FeH lines are stronger in high-gravity objects, but also vary with spectral type (McGovern et al. 2004; Gorlova et al. 2003). Other possible gravity indicators are VO and TiO (McGovern et al. 2004), which are weaker at higher gravities due to condensation effects. The 2.3 m CO bandhead has long been used as a gravity indicator in stellar objects (e.g. Kleinmann & Hall 1986). We tested indices of KI, NaI, VO, FeH, and CO, and found that the only index which had little correlation with SpT and had well separated index values for high (field dwarf) and low (young objects and giants) gravity objects was one based on the 1.14 m NaI feature. We chose to use indices of flux ratios rather than equivalent widths, since the continuum level in R300 near-IR spectra is masked by the wealth of atomic and molecular absorption features. The bottom panel of Figure 5 shows our gravity sensitive index, defined by the depth of the 1.14 m NaI feature, . Field brown dwarfs have an Na index with values 1.15 at M6, increasing gradually to 1.28 at L5. The giants and young brown dwarfs have an Na index 1.03 over the range from M8 to L1. The gravity sensitivity of NaI has been noted previously using the 2.2 m line (Gorlova et al. 2003). The K band for young objects could suffer from veiling, so we advocate the use of the 1.14 m NaI line to verify the low gravity of sources.
Interestingly, the young field dwarfs 2MASS0141–4633 and G196–3B have NaI indices that agree with older, higher-gravity field dwarfs, despite having the triangular H-band shape indicative of youth. Given that 2MASS0141–4633 and G196–3B are 1–50 and 60–300 Myr old (Kirkpatrick et al. 2006, 2001; Rebolo et al. 1998), compared to our young sources and standards in the 1–3 Myr old Ophiuchus and Chamaeleon clouds, it appears that our NaI index may make the transition from the low value typical of giants and young cluster brown dwarfs to the higher values seen in field dwarfs at a younger age than the age at which the H band continuum transitions from the more triangular shape seen in younger objects to the flat-topped shape seen in older field dwarfs. As a result, the Na index might be a more reliable indicator of cluster membership for the youngest clusters than the H-band continuum shape. Based on Figure 5, an NaI index of less than 1.1 (for spectral types later than M6) safely indicates that a source is low-gravity (either a young object or a giant). A spectral S/N of 80 is needed per resolution element (at R300) to determine if an object is low-gravity based on a 100 determination of the NaI index. Changing the AV by which the spectra are dereddened by 1 magnitude changes the NaI indices by only 0.006; small uncertainties in AV would not change the classification of an object. The wavelength of our NaI index lies on a prominent H2O telluric absorption feature. To test the effect of atmospheric transmission on the calculation of our NaI index, we convolved our object and telluric standard star spectra with models of telluric atmospheric transmission (Grossman 1989) of varying airmass (1–2) and precipitable water vapour content (pwv; 2–8 mm). Differences in airmass of 0.15 and in pwv of 10% between the object and the standard star spectra resulted in only small (1%) changes in the calculated index. All of our objects have NaI indices that are well separated (more than 0.1 in the index) from the field dwarf indices, providing further confirmation that our sources are indeed young, low-gravity objects.
4. Teff, Mass, and Age Estimates
A motivation behind determining the spectral types of our sources is to derive an estimate of their effective temperatures. With effective temperatures and bolometric luminosities, we can place our objects on an H-R diagram, and use model isochrones (Chabrier et al. 2000; D’Antona & Mazzitelli 1997) to estimate masses and ages. Allers et al. (2006) obtained temperature and mass estimates for our objects by assuming ages of 1 Myr and 3 Myr for sources in Ophiuchus and Chamaeleon II respectively, and assigning the parameters (Teff, mass, and log ) of the closest luminosity point on the appropriate Baraffe et al. (2003) isochrone to the observed luminosity. In this section, we convert the spectral types to Teff and use these Teff’s, together with the measured luminosities, to place the sources on an HR diagram for comparison with theoretical brown dwarf isochrones.
For the 6 sources in our sample, we estimate Teff from the spectral type of our objects using the SpT–Teff relationship of Luhman et al. (2003). For objects with spectral types from M6 to M9, we use the Luhman et al. (2003) scale directly. At a spectral type of L1, however, cha1305-7739 lies beyond the end of the Luhman et al. (2003) temperature scale, so we subtract the difference in effective temperature between M9 and L1 field dwarfs (196 K; Golimowski et al. 2004) from the Luhman et al. (2003) Teff for young M9 brown dwarfs (2400 K) and assign a temperature of 2200 K to cha1305-7739. The Teff’s of our sample based on their spectral types are listed in Table 2. The Teff’s estimated from the objects’ spectral types are higher than the Allers et al. (2006) Teff’s, slightly so (100 K) in two cases, but more significantly (200-500 K) for the remaining objects.
We have calculated the luminosities of our objects using the method described in Allers et al. (2006), but using the values of AV in Table 2. The positions of our Ophiuchus sources are within the boundary of the Upper Scorpius region, so we use a distance of 14520 pc (Preibisch & Mamajek 2006) to calculate the luminosities of oph1623-2338 and oph1622-2405, rather than the 125 pc distance (appropriate for the Ophiuchus cloud core) adopted by the “Cores to Disks” Spitzer Legacy team and used by Allers et al. (2006). The uncertainties in luminosity, including photometric, AV, and distance uncertainties, total 0.10 and 0.13 dex for our sources in Chamaeleon II and Ophiuchus/Upper Sco respectively. Our calculated luminosities (Table 2) agree to within 0.2 dex with the Allers et al. (2006) luminosities for all of the sources in our sample.
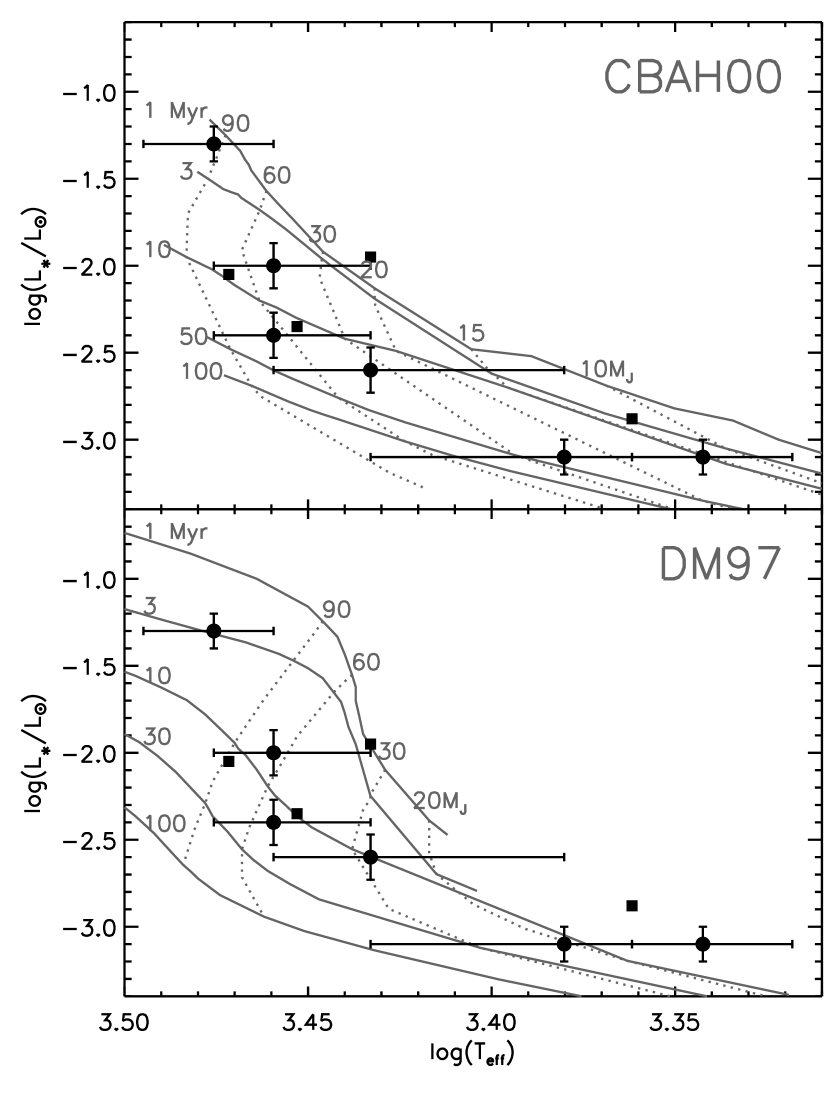
Figure 6 shows the placement of our objects on the H-R diagram. The error bars showing the uncertainties in Teff correspond to 1 sub-type (Luhman et al. 2003; Golimowski et al. 2004) but assume that the SpT-Teff relation is correct. Table 2 shows the ages and masses of our sources inferred from both the DUSTY evolutionary models (Chabrier et al. 2000, hereafter CBAH00) and the evolutionary models of D’Antona & Mazzitelli (1997, hereafter DM97) overlaid on the H-R diagram. In top panel of Figure 6, the Allers et al. (2006) masses are roughly equivalent to moving horizontally from each source’s position to the 3 Myr (for Chamaeleon II) and 1 Myr (for Ophiuchus) isochrones. The derived ages and therefore the masses of our two brightest sources (oph1623-2338 and cha1258-7709), as determined from the CBAH00 model isochrones (5 and 1 Myr respectively), are in good agreement with the 1 Myr and 3 Myr ages assumed for Ophiuchus and Chamaeleon II in Allers et al. (2006). Using the DM97 model isochrones yields ages for oph1623-2338 and cha1258-7709 (7 and 3 Myr respectively) that are in good agreement with the CBAH00 model results, however, the masses estimated from DM97 are 1.6 times greater than those estimated from CBAH00 for these two sources. The luminosity and temperature of our faintest source, cha1305-7739, do not fall within the DM97 model parameter space, but the age and mass we derive using the CBAH00 isochrones (10 Myr, 15 MJ) agree to well within the uncertainties with the age of the Chamaeleon II cloud and the 10 MJ mass from Allers et al. (2006). The other three sources (cha1257-7701, oph1622-2405B and oph1622-2405A) have implied ages of 20–30 Myr (CBAH isochrones) or 10–15 Myr (DM97 isochrones), and masses 2–4 times larger than those reported by Allers et al. (2006). Given that two of these sources (cha1257-7701 and oph1622-2405B) show mid-IR excess emission, presumably from a circumstellar disk, and that typical lifetimes for T Tauri disks are 6 Myr (Haisch et al. 2001), it is unlikely that these sources are 20 and 30 Myr old if brown dwarf disks have similar lifetimes as T Tauri disks. Our near-IR spectra of these sources also show that they must be young (based on their H-band continuum shape and NaI indices). The discrepancy between the Allers et al. (2006) and our derived Teff’s, masses and ages from the same group of model isochrones could be a result of 1) our choice of SpT–Teff relation, 2) an underestimation of the source luminosities, or 3) an older population of brown dwarfs associated with the Chamaeleon II and Ophiuchus regions that still show signatures of youth. An additional source of uncertainty in the derived masses and ages of our objects lies in the evolutionary models themselves. Further discussion of each of these possibilities follows.
4.1. Uncertainties in the SpT–Teff Relation
A possible source of the inconsistency in the effective temperatures and masses from Allers et al. (2006) and those in Figure 6 lies in the sensitivity of the derived parameters to the choice of SpT–Teff relation. The best available relation is a compromise between the SpT-Teff relation for field dwarfs and that for giants (Luhman 1999; Luhman et al. 2003). The intermediate position was determined by requiring all four components of the TTau system to lie on the same isochrone in the models of Baraffe et al. (1998). The sources lie along the 1 Myr isochrone, consistent with ages of other Taurus YSOs. Interestingly, the 1 Myr isochrone is parallel to the 3 Myr isochrone at both higher and lower temperatures, but, just in the temperature range relevant for TTau Bb (2800 K), the 1 Myr isochrone jumps closer to the 3 Myr line (Baraffe et al. 1998). If this anomaly were not present, the coevality requirement would have forced the later spectral types to lower temperatures. This would bring the present results into better agreement with the results of Allers et al. (2006). Uncertainties in the SpT–Teff relation, however, cannot explain the low luminosity of some of our sources relative to young standards of similar spectral type (as seen in Figure 6).
| CBAH00 | DM97 | |||||||||
|---|---|---|---|---|---|---|---|---|---|---|
| Source | (J2000) | (J2000) | SpT | AV | L∗ | TeffaaFrom the SpT-Teff relationships of Luhman et al. (2003) and Golimowski et al. (2004) | M∗bbEstimated from the DUSTY model isochrones of Chabrier et al. (2000) | AgebbEstimated from the DUSTY model isochrones of Chabrier et al. (2000) | M∗ccEstimated from the 1998 update of the D’Antona & Mazzitelli (1997) isochrones. Cha1305-7739 does not fall in the parameter space of the D’Antona & Mazzitelli (1997) models. | AgeccEstimated from the 1998 update of the D’Antona & Mazzitelli (1997) isochrones. Cha1305-7739 does not fall in the parameter space of the D’Antona & Mazzitelli (1997) models. |
| mag | log | K | MJ | Myr | MJ | Myr | ||||
| cha1257-7701 | 12 57 58.7 | -77 01 19.5 | M9 | 4.0 | -3.1 | 2400 | 30 | 30 | 20 | 15 |
| cha1258-7709 | 12 58 06.7 | -77 09 09.5 | M6 | 10.4 | -1.3 | 2990 | 90 | 1 | 140 | 3 |
| cha1305-7739 | 13 05 40.8 | -77 39 58.2 | L1 | 3.0 | -3.1 | 2200 | 15 | 10 | – | – |
| oph1622-2405B | 16 22 25.2 | -24 05 15.6 | M8 | 1.0 | -2.6 | 2710 | 35 | 20 | 30 | 10 |
| oph1622-2405A | 16 22 25.2 | -24 05 13.7 | M7 | 0.0 | -2.4 | 2880 | 65 | 20 | 55 | 15 |
| oph1623-2338 | 16 23 05.8 | -23 38 17.8 | M7 | 8.2 | -2.0 | 2880 | 40 | 5 | 65 | 7 |
4.2. Underestimating the Luminosity
Allers et al. (2006) rigorously tested their method of calculating L∗ using field M6-L6 dwarfs with known distances and hence accurate luminosities (Golimowski et al. 2004) and found uncertainties well below 5%. It might be possible that the luminosities of our 3 discrepant objects are underestimated either because the objects are more distant than the cloud (145 pc for Ophiuchus and 178 pc for Chamaeleon II; Preibisch & Mamajek 2006; Whittet et al. 1997) or because they are detected in scattered light. In the case of cha1257-7701, our derived extinction (AV=4.0), is greater than the total cloud extinction in the vicinity of cha1257-7701 (A2; Cambrésy 1999), so it is possible that the source lies slightly behind the Chamaeleon II cloud. In order for the source luminosity to lie on the 3 Myr CBAH00 isochrone for a Teff of 2400 K, however, cha1257-7701 would have to lie 90 pc behind the cloud, which seems unlikely given that the Chamaeleon II cloud is only 5 pc wide, and presumably of similar depth. Oph1622-2405A and B lie close to the boundary defining the Upper Scorpius association (d=14520 pc; Preibisch & Mamajek 2006). If Oph1622-2405A and B lie behind the Ophiuchus cloud and are members of Upper Scorpius, using the maximum distance for sources in Upper Sco, 165 pc (rather than 125 pc as used in Allers et al. (2006)) to calculate the luminosities would place them close to the 10 Myr isochrone in Figure 6, in reasonable agreement with the age of Upper Scorpius (5 Myr Preibisch et al. 2002). Oph1622-2405A and B show no sign of foreground reddening, even though the AV of the Ophiuchus cloud is 4.5 magnitudes (Ridge et al. 2006) at the position of oph1622-2405A and B, which makes it unlikely that oph1622-2405A and B lie behind the Ophiuchus/Upper Sco cloud material. Detection in scattered light is another possible explanation for the low luminosity of the three discrepant sources. However, our full 0.8–24.0 m SED’s show no indication of wavelength-dependent Rayleigh scattering (i.e. their colors are in good agreement with models for a brown dwarf with a passively heated disk). The two sources showing mid-IR excess also agree with the constant Lexcess/L∗ found by Allers et al. (2006), which would be unlikely if they are detected in scattered light. Optical spectra of oph1622-2405 and cha1257-7701 (Luhman et al. 2007; Jayawardhana & Ivanov 2006a), which would be more more sensitive to the effects of Rayleigh scattering than our near-IR spectra, also show no evidence for detection in scattered light.
4.3. An Older Cluster Population
Another possibility is that these three sources could indeed be older than the main population in their associated clusters. An older population has been suggested as a possible explanation for bifurcation on the H–R diagram of sources in the Orion Nebula Cluster (Palla et al. 2005; Slesnick et al. 2004). Since two of our three discrepant objects are known to harbor circumstellar disks, this might seem unlikely given the relatively short lifetime of T Tauri disks (6 Myr Haisch et al. 2001). If the disk is depleted mainly by accretion, however, it may be possible for brown dwarf disks to be longer lived than T Tauri disks. Mass accretion rates (based on H emission) depend strongly on the mass of the central source, with M for masses from 150 MJ down to roughly 25 MJ (Muzerolle et al. 2005; Natta et al. 2006). If the disk is depleted mainly via accretion onto the central source, the –M∗ relation indicates that the timescale for depleting the disk is inversely proportional to the stellar mass, or T M. Thus, a 50 MJ object could have a disk for 2.1 times longer than a 100 MJ object. The Haisch et al. (2001) lifetimes were determined by observing disk fractions (as measured by L′ excess) towards clusters with ages from 0.3–30 Myr. The younger clusters in their sample have lower mass completion limits than the older clusters in their sample both because sources of a given mass are brighter at younger ages and because the older clusters in their survey are 3–4 times more distant than their young clusters. Thus, the measured disk fractions for the young clusters in their survey may be artificially higher than their older clusters if lower-mass objects do indeed have longer disk lifetimes. Oph1622-2405B is 4 times less massive than the lowest mass sources in Haisch et al. (2001) and 30 times less massive than the 1 M⊙ completeness limit for their 5 Myr old sources in NGC 2362. Based on the Haisch et al. (2001) assumptions, along with the longer disk lifetimes for young brown dwarfs implied by their mass accretion rates, it is plausible that a 30–40 MJ object could have a disk for as long as 30 Myr. As mentioned in §3.2.3 and 3.2.4, oph1622-2405A and B have slightly stronger NaI features than the young standards to which they are compared, which might hint at a higher gravity and somewhat older age, in agreement with the 5 Myr age independently determined for oph1622-2405 by Luhman et al. (2007) and Close et al. (2006). Our spectrum of cha1257-7701 has too low of S/N for comparison of gravity sensitive atomic lines.
4.4. Uncertainties in the Evolutionary Models
Table 2 shows the masses and ages of our sources derived using two different sets of evolutionary models, CBAH00 and DM97. Visual inspection of Figure 6 reveals that the slopes and positions of the two sets of isochrones and mass tracks differ substantially. Not surprisingly, the masses and ages derived from the two sets of isochrones vary by as much as a factor of 1.6 in mass and a factor of 3 in age. The descrepancy in mass is highest (a factor of 1.6) for the brightest source in our sample, cha1258-7709, whereas the masses of the lower luminosity sources fall within the error bars. The spread in source ages is smaller when derived from the DM97 models (3–15 Myr) than the spread in ages determined using the CBAH00 models (1–30 Myr). The differences in the masses and ages of our sample as determined from the DM97 and CBAH00 models are not surprising given that evolutionary models, in general, are unable to reproduce the dynamically determined masses of pre-main-sequence stars to consistently better than 30% (Hillenbrand & White 2004). For both sets of evolutionary models the isochrones and mass tracks become almost parallel at the lowest temperatures, implying that their power to distinguish age differences from mass differences is diminished.
5. Summary
We have presented follow-up near-IR spectroscopy of 5 candidate objects with circumstellar disks reported in Allers et al. (2006) as well the spectrum of a probable companion to oph1622-2405B. The spectral features confirm the young age of these objects. We are able to use our R300 0.8-2.4 m spectra to establish the spectral types of our objects by comparison to young brown dwarfs in Chamaeleon I with spectral types known from optical spectra (Luhman 2004a; Luhman et al. 2004) as well as to two young field dwarfs, 2MASS0141–4633 and G196–3B (Kirkpatrick et al. 2006, 2001; Rebolo et al. 1998). The results are accurate to 1 subtype. Our spectrum of cha1305-7739 indicates that it has a spectral type of L1, making it among the latest type young brown dwarfs with circumstellar disks discovered to date.
Comparing spectra of young brown dwarfs, field dwarfs and giants, we found an H2O index capable of determining spectral type to 1 sub-type independent of gravity. We also created an index based on the 1.14 m NaI feature that is sensitive to gravity, but only weakly dependent on spectral type for field dwarfs. Our NaI index appears to be a more sensitive gravity indicator than the triangular H-band continuum shape, and can distinguish between young sources in clusters with 5 Myr and young members of the field population with ages of tens of Myr.
Placing our objects on the H-R diagram using the luminosities from Allers et al. (2006) and Teff’s from our spectral types using the SpT-Teff relationship of Luhman et al. (2003) gives masses and ages consistent with the Allers et al. (2006) results for half of our sources but yields older ages and masses up to 5.5 times larger for three of our sources. The cause of the discrepancy could lie in the SpT-Teff relation, an underestimation of the distance to the sources, the detection of the sources in scattered light, or the existence of a bona-fide older population of brown dwarfs with circumstellar disks. The large differences in derived masses (from the same set of model isochrones) using two independent but reasonable methods implies that we need to be quite circumspect in quoting masses for young brown dwarfs. Refinements to the SpT-Teff relation and/or spectroscopic techniques for direct determination of surface gravity may reduce the age and mass problem significantly. Uncertainties in the evolutionary models themselves can be quite large. Using two separate sets of model isochrones (Chabrier et al. 2000; D’Antona & Mazzitelli 1997) to derive the physical properties of our sample yields differences as large as a factor of 1.6 in mass and a factor of 3 in age.
References
- Alcalá et al. (2006) Alcalá, J. M., Spezzi, L., Covino, E., Porras, A., Merín, B., & Persi, P. 2006, A&A, in press.
- Allard et al. (2001) Allard, F., Hauschildt, P. H., Alexander, D. R., Tamanai, A., & Schweitzer, A. 2001, ApJ, 556, 357
- Allard et al. (2000) Allard, F., Hauschildt, P. H., & Schwenke, D. 2000, ApJ, 540, 1005
- Allers (2005) Allers, K. N. 2005, PhD thesis, University of Texas, Austin, www.lib.utexas.edu/etd/d/2005/allersk65089/allersk65089.pdf
- Allers et al. (2006) Allers, K. N., Kessler-Silacci, J. E., Cieza, L. A., & Jaffe, D. T. 2006, ApJ, 644, 364
- Baraffe et al. (1998) Baraffe, I., Chabrier, G., Allard, F., & Hauschildt, P. H. 1998, A&A, 337, 403
- Baraffe et al. (2003) Baraffe, I., Chabrier, G., Barman, T. S., Allard, F., & Hauschildt, P. H. 2003, A&A, 402, 701
- Briceño et al. (2002) Briceño, C., Luhman, K. L., Hartmann, L., Stauffer, J. R., & Kirkpatrick, J. D. 2002, ApJ, 580, 317
- Cambrésy (1999) Cambrésy, L. 1999, A&A, 345, 965
- Chabrier et al. (2000) Chabrier, G., Baraffe, I., Allard, F., & Hauschildt, P. 2000, ApJ, 542, 464
- Close et al. (2006) Close, L. M., et al. 2007, ApJ, submitted, arXiv:astro-ph/0608574
- Comerón et al. (2000) Comerón, F., Neuhäuser, R., & Kaas, A. A. 2000, A&A, 359, 269
- Cushing et al. (2005) Cushing, M. C., Rayner, J. T., & Vacca, W. D. 2005, ApJ, 623, 1115
- Cushing et al. (2004) Cushing, M. C., Vacca, W. D., & Rayner, J. T. 2004, PASP, 116, 362
- D’Antona & Mazzitelli (1997) D’Antona, F., & Mazzitelli, I. 1997, Memorie della Societa Astronomica Italiana, 68, 807
- de Geus et al. (1989) de Geus, E. J., de Zeeuw, P. T., & Lub, J. 1989, A&A, 216, 44
- Delfosse et al. (1999) Delfosse, X., Tinney, C. G., Forveille, T., Epchtein, N., Borsenberger, J., Fouqué, P., Kimeswenger, S., & Tiphène, D. 1999, A&AS, 135, 41
- Evans et al. (2003) Evans, N. J., II, et al. 2003, PASP, 115, 965
- Fitzpatrick (1999) Fitzpatrick, E. L. 1999, PASP, 111, 63
- Geballe et al. (2002) Geballe, T. R., et al. 2002, ApJ, 564, 466
- Golimowski et al. (2004) Golimowski, D. A., et al. 2004, AJ, 127, 3516
- Gorlova et al. (2003) Gorlova, N. I., Meyer, M. R., Rieke, G. H., & Liebert, J. 2003, ApJ, 593, 1074
- Grossman (1989) Grossman, E. 1989, A T program, Air Head Software, 2069 Bluff St., Boulder, CO 80302, unpublished
- Guieu et al. (2006) Guieu, S., Dougados, C., Monin, J.-L., Magnier, E., & Martín, E. L. 2006, A&A, 446, 485
- Haisch et al. (2001) Haisch, K. E., Lada, E. A., & Lada, C. J. 2001, ApJ, 553, L153
- Hartigan (1993) Hartigan, P. 1993, AJ, 105, 1511
- Hillenbrand & White (2004) Hillenbrand, L. A., & White, R. J. 2004, ApJ, 604, 741
- Jayawardhana & Ivanov (2006a) Jayawardhana, R., Ivanov, V. D., 2006, ApJ, 647, 167.
- Jayawardhana & Ivanov (2006b) Jayawardhana, R., Ivanov, V. D., 2006, Science, in press
- Kirkpatrick et al. (1999) Kirkpatrick, J. D., et al. 1999, ApJ, 519, 802
- Kirkpatrick et al. (2006) Kirkpatrick, J. D., Barman, T. S., Burgasser, A. J., McGovern, M. R., McLean, I. S., Tinney, C. G., & Lowrance, P. J. 2006, ApJ, 639, 1120
- Kirkpatrick et al. (2001) Kirkpatrick, J. D., Dahn, C. C., Monet, D. G., Reid, I. N., Gizis, J. E., Liebert, J., & Burgasser, A. J. 2001, AJ, 121, 3235
- Kirkpatrick et al. (1997) Kirkpatrick, J. D., Henry, T. J., & Irwin, M. J. 1997, AJ, 113, 1421
- Kleinmann & Hall (1986) Kleinmann, S. G., & Hall, D. N. B. 1986, ApJS, 62, 501
- Leggett et al. (2002) Leggett, S. K., et al. 2002, ApJ, 564, 452
- Leggett et al. (2001) Leggett, S. K., Allard, F., Geballe, T. R., Hauschildt, P. H., & Schweitzer, A. 2001, ApJ, 548, 908
- Liu et al. (2003) Liu, M. C., Najita, J., & Tokunaga, A. T. 2003, ApJ, 585, 372
- Lucas et al. (2001) Lucas, P. W., Roche, P. F., Allard, F., & Hauschildt, P. H. 2001, MNRAS, 326, 695
- Luhman (1999) Luhman, K. L. 1999, ApJ, 525 466
- Luhman (2004a) Luhman, K. L. 2004a, ApJ, 602, 816
- Luhman (2006) Luhman, K. L. 2006, ApJ, 645, 676
- Luhman (2004b) Luhman, K. L. 2004b, ApJ, 614, L398
- Luhman et al. (2005a) Luhman, K. L., Adame, L., D’Alessio, P., Calvet, N., Hartmann, L., Megeath, S. T., & Fazio, G. G. 2005a, ApJ, 635, L93
- Luhman et al. (2007) Luhman, K. L., Allers, K. N., Jaffe, D. T., Cushing, M. C., Williams, K. A., Slesnick, C. L., Hillenbrand, L. A., & Vacca, W. D., 2007, ApJ, submitted.
- Luhman et al. (2005b) Luhman, K. L., D’Alessio, P., Calvet, N., Allen, L. E., Hartmann, L., Megeath, S. T., Myers, P. C., & Fazio, G. G. 2005b, ApJ, 620, L51
- Luhman et al. (2004) Luhman, K. L., Peterson, D. E., & Megeath, S. T. 2004, ApJ, 617, 565
- Luhman et al. (2003) Luhman, K. L., Stauffer, J. R., Muench, A. A., Rieke, G. H., Lada, E. A., Bouvier, J., & Lada, C. J. 2003, ApJ, 593, 1093
- McGovern et al. (2004) McGovern, M. R., Kirkpatrick, J. D., McLean, I. S., Burgasser, A. J., Prato, L., & Lowrance, P. J. 2004, ApJ, 600, 1020
- Muzerolle et al. (2005) Muzerolle, J., Luhman, K. L., Briceño, C., Hartmann, L., & Calvet, N. 2005, ApJ, 625, 906
- Natta et al. (2002) Natta, A., et al. 2002, A&A, 393, 597
- Natta & Testi (2001) Natta, A., & Testi, L. 2001, A&A, 376, L22
- Natta et al. (2006) Natta, A., Testi, L., & Randich, S. 2006, A& A, 452, 245
- Palla et al. (2005) Palla, F., Randich, S., Flaccomio, E., & Pallavicini, R. 2005, ApJ, 626, L49
- Perrin et al. (1998) Perrin, G., Coude Du Foresto, V., Ridgway, S. T., Mariotti, J.-M., Traub, W. A., Carleton, N. P., & Lacasse, M. G. 1998, A&A, 331, 619
- Persi et al. (2003) Persi, P., Marenzi, A. R., Gómez, M., & Olofsson, G. 2003, A&A, 399, 995
- Preibisch et al. (2002) Preibisch, T., Brown, A. G. A., Bridges, T., Guenther, E., & Zinnecker, H. 2002, AJ, 124, 404
- Preibisch & Mamajek (2006) Preibisch, T. & Mamajek, E. 2006, Handbook of Star Forming Regions, ASP Conference Series, submitted
- Rayner et al. (2003) Rayner, J. T., Toomey, D. W., Onaka, P. M., Denault, A. J., Stahlberger, W. E., Vacca, W. D., Cushing, M. C., & Wang, S. 2003, PASP, 115, 362
- Rebolo et al. (1998) Rebolo, R., Zapatero Osorio, M. R., Madruga, S., Bejar, V. J. S., Arribas, S., & Licandro, J. 1998, Science, 282, 1309
- Reid et al. (2001) Reid, I. N., Burgasser, A. J., Cruz, K. L., Kirkpatrick, J. D., & Gizis, J. E. 2001, AJ, 121, 1710
- Ridge et al. (2006) Ridge, N. A., et al. 2006, AJ, 131, 2921
- Schwartz (1977) Schwartz, R. D. 1977, ApJS, 35, 161
- Slesnick et al. (2004) Slesnick, C. L., Hillenbrand, L. A., & Carpenter, J. M. 2004, ApJ, 610, 1045
- Vacca et al. (2003) Vacca, W. D., Cushing, M. C., & Rayner, J. T. 2003, PASP, 115, 389
- Whittet et al. (1997) Whittet, D. C. B., Prusti, T., Franco, G. A. P., Gerakines, P. A., Kilkenny, D., Larson, K. A., & Wesselius, P. R. 1997, A&A, 327, 1194
- Wilking et al. (1987) Wilking, B. A., Schwartz, R. D., & Blackwell, J. H. 1987, AJ, 94, 106
- Wilson et al. (2001) Wilson, J. C., et al. 2001, PASP, 113, 227