The 300 kpc Long X-ray Jet in PKS 1127-145, Quasar: Constraining X-ray Emission Models.
Abstract
We present a ksec Chandra X-ray observation and new VLA radio data of the large scale, 300 kpc long X-ray jet in PKS 1127-145, a radio loud quasar at redshift z=1.18. With this deep X-ray observation we now clearly discern the complex X-ray jet morphology and see substructure within the knots. The X-ray and radio jet intensity profiles are seen to be strikingly different with the radio emission peaking strongly at the two outer knots while the X-ray emission is strongest in the inner jet region. The jet X-ray surface brightness gradually decreases by an order of magnitude going out from the core. The new X-ray data contain sufficient counts to do spectral analysis of the key jet features. The X-ray energy index of the inner jet is relatively flat with and steep in the outer jet with . We discuss the constraints implied by the new data on the X-ray emission models and conclude that “one-zone” models fail and at least a two component model is needed to explain the jet’s broad-band emission. We propose that the X-ray emission originates in the jet proper while the bulk of the radio emission comes from a surrounding jet sheath. We also consider intermittent jet activity as a possible cause of the observed jet morphology.
1 Introduction
Jets span distances of hundreds of kpc to Mpc and constitute the largest physical manifestation of the AGN phenomenon. However, fundamental questions about the nature of jets remain unanswered, while emission processes associated with the production of X-rays and -rays are critical to understanding quasars. The discovery of many X-ray jets over the last 6 years with the Chandra X-ray Observatory (Weisskopf et al., 2002) (Chandra hereafter) indicate that jets, and in particular large scale jets ( kpc) are common (e.g. Schwartz et al 2000, Marshall et al 2001, Worrall et al 2001, Sambruna et al 2002, Siemiginowska et al 2003, Sambruna et al 2004, Marshall et al 2005)
The synchrotron origin of the radio to optical jet emission has now been well established. However the origin of the jet X-ray emission is puzzling (see Harris & Krawczynski 2006 for review) since a straight extrapolation of the synchrotron (radio-to-optical) continuum into the X-rays severely underpredicts the luminosity of powerful Chandra large scale jets. Thus, the same single power-law population of electrons cannot produce the radio, optical, and X-ray emission in the framework of a homogeneous one-emission zone approximation (see for example Sambruna et al 2004). The synchrotron self-Compton (SSC) process cannot easily explain the data because it does not produce enough X-rays at the equipartition fields and therefore requires large departures from the minimum-power condition (Chartas et al 2000, Harris & Krawczynski 2002, Kataoka & Stawarz 2005). It was proposed that the X-rays from large-scale quasar jets might be associated with inverse-Compton scattering of the Cosmic Microwave Background (IC/CMB) photons implying large jet bulk Lorentz factors () at hundreds of kpc from the active nuclei (Tavecchio et al. 2000, Celotti et al. 2001, Schwartz 2002). However, recent Chandra observations indicate several problems with this simple model: (1) the observed offsets between X-ray and radio peak brightnesses in some jet knots, with the X-ray peak being closer to the core; (2) the large variety of X-ray spectral indices observed in several jets; (3) the spectral dependence of the knot shapes and profiles, as well as possible knot substructure (see Harris & Krawczynski 2006 for a wide discussion).
The most widely discussed types of models fall into two main classes: (i) synchrotron scenarios invoking separate populations of radiating electrons and/or non-standard broad-band electron spectra (Dermer & Atoyan 2004, Stawarz et al 2004) and (ii) more complex versions of the inverse-Compton/CMB models involving knot inhomogeneity or jet deceleration (Tavecchio et al 2003, Georganopoulous & Kazanas 2004). The most recent Spitzer and Chandra observations of the famous 3C 273 jet reported by Uchiyama et al. (2006) and Jester et al. (2006) seem to favor the former (i.e. synchrotron) scenario, revealing peculiar spectral shapes of the synchrotron (polarized) knot continua in the IR-to-UV photon frequency range, and characteristic broad-band spectral changes along the outflow. Both of these are consistent with the ‘two-electron population’/‘non-standard particle spectra’ synchrotron model, but could not be explained in the framework of the inverse-Compton scenario. Yet the question remains if the 3C 273 jet is representative of other large-scale quasar jets detected by Chandra, or is a unique source.
A possible discriminant between synchrotron and IC/CMB emission models in all the sources is related to significant differences in lifetimes of the radiating particles, which will manifest itself in the observed jet morphologies at different wavelengths. In particular, X-rays emitting synchrotron electrons (with Lorentz factors ) have much shorter lifetimes than the lower energy radio emitting electrons and hence one may expect the X-ray emission from knots to be more compact than the corresponding radio emission. Instead the electron cooling times related to the IC/CMB emission are long since the X-rays are produced by a low energy population of electrons () thus implying continuous, intra-knot X-ray emission outside the bright knots. Such an idealized picture may be however significantly complicated by intermittent/modulated jet activity and efficient particle acceleration acting within the entire jet volume (Stawarz et al. 2004). In such a case, the multiwavelength morphology of the outflow is controlled by the jet activity and acceleration timescales rather than by the radiative cooling timescales of the particles.
The differences in the lifetimes of the radiating electrons could also shape the spectral profiles along the jets, i.e. runs of both broad-band (e.g., radio-to-optical) power-law slopes, and also of the narrow-band (e.g., radio, or X-ray) spectral indices. However, in order to extract such informations from the data, deep multiwavelength observations are needed. We note that Sambruna et al (2004) found very flat () to almost inverted () spectra in a few X-ray jets (though with large uncertainties - the majority have errors from 0.3-0.9), which they associated with the IC/CMB from the electron population near the low energy cut-off of the electron distribution. Alternatively, in the framework of the synchrotron scenario, flat X-ray continua may indicate spectral pile-up occurring at the high-energy part of the electron energy distribution, which is in fact expected if the continuous particle acceleration acts efficiently enough (see Stawarz & Ostrowski 2002).
One of the longest X-ray jets known111see http://hea-www.harvard.edu/XJET/ was discovered by Chandra in the second year of the mission (Siemiginowska et al. 2002, Paper I). With a length of almost 300 kpc projected onto the sky, this jet, associated with the redshift z=1.18 radio-loud quasar PKS 1127-145 , poses several questions for X-ray emission models. The one-sided jet shows an X-ray surface brightness which declines with the distance from the core, while the radio brightness increases. The jet slightly curves, with position angle (with respect to the core) changing from at the core to at the jet’s end. The discovery observation identified three main knots along the jet with the furthest knot C being the weakest. The prominent knots A and B are connected by continuous X-ray emission that stops beyond knot B at arcsec from the core. The VLA radio maps show very low brightness emission along the jet (Fig.5 in Siemiginowska et al 2002) and the X-ray to radio intensity ratio decreases along the jet. The HST WFPC2 observation gives upper limits to the knots optical brightness, but they are too high for constraining the emission models. Thus only radio and X-ray observations can be used to study emission processes in this jet.
The new Chandra data significantly improve on the discovery observation. With the deep exposure and high S/N it is obvious that the jet morphology is complex and some substructure is clearly visible in the large knots. We now do not detect offsets of 0.8-2 arcsec between the X-ray and radio peak brightnesses reported in Paper I, but conclude that they are now mostly attributable to the jet substructure. We also obtain well constrained spectral information for the main jet features. We discuss the results in the context of currently considered emission models and pose questions. This is clearly a remarkable jet providing us with many constraints on the current emission models. Below we discuss in detail “one-component” emission models and show that they fail to explain the PKS 1127-145 jet data. We suggest that a two-component model (the proper jet and a sheath) can describe the data. We also consider the possibility of modulated jet activity, which might be responsible for the observed jet morphology.
The X-ray data are presented in Section 2, radio data in Section 3, jet morphology and spectral properties are presented in Sections 4 and 5, optical data in Section 6, and a discussion of the results and implications for jet models is in Section 7. Throughout this paper we use the cosmological parameters based on the WMAP measurements (Spergel et al. 2003): H71 km sec-1 Mpc-1, , and . At , 1″ corresponds to 8.3 kpc. For a power law radiation spectrum we adopt the convention: flux density, .
2 Chandra Observations
The new observation of PKS 1127-145 with Chandra was obtained on April 25-27, 2005 (obsid 5708) with 106 ksec exposure. This was the second Chandra observation of this quasar following the discovery of the X-ray jet in AO1 pointing (30 ksec, obsid=866). The source was placed 30 arcsec from the default aim-point position on the ACIS-S backside illuminated CCD, chip S3 (Proposers’ Observatory Guide, POG222http://cxc.harvard.edu/proposer/POG/index.html). To reduce the effects of pileup we collected the data in 1/8 subarray readout mode of one CCD only, which resulted in a 0.441 sec frame readout time. The quasar’s count rate of 0.62 cts s-1 gives 8-10 pileup in the core for this choice of the readout mode (see POG). After standard filtering, the effective exposure time for this observation was 103,203 sec.
The standard off-set pointing was used in this observation to avoid the node boundary. However, due to the drift of the optical axis since the Chandra launch in 1999 the aim point location has moved closer to the node boundary (POG) and the quasar core was crossing the node during the observation. This affected the core data and about 30% of the core photons were marked as bad due to their location on the node boundary. Because of a choice of the roll angle the jet was placed away from the node and the jet data more than 3 arcsec away from the quasar centroid are not affected by the node boundary.
The X-ray data analysis was performed with the CIAO 3.3 software333http://cxc.harvard.edu/ciao/ using calibration files from the CALDB 3 database. We ran acis_process_events to remove pixel randomization and to obtain the highest resolution image data. The X-ray position of the quasar (RA, DEC J2000) agrees with the radio position (Johnston et al., 1995) to better than 0.25, (which is smaller than Chandra’s 90 pointing accuracy of 0.6″, Weisskopf et al. 2003). All spectral modeling was done in Sherpa (Freeman et al., 2001).
3 VLA Observations
The VLA observations of Feb 2001 from program AH730 (1.4 and 8.5 GHz) are described in Paper I, but are also included in Table 1 for completeness. The 1.4 GHz data were rummaged here with a smaller (uniform weighted) beam revealing the presence of the X-ray detected feature O. This is the only radio detection of this knot at the sensitivity of the higher frequency VLA maps (below).
We also reduced 5 GHz observations obtained as part of this program (June 2001) which were not available at the time of submission of Paper I. These data were taken in a less extended (B) configuration to synthesize matched resolution images at different frequencies (Figure 6). All data were calibrated in AIPS(Bridle & Greisen, 1994) and imaging was done in DIFMAP (Shepherd, Pearson, & Taylor, 1994). Four antennas were sub-arrayed to another project as our observations commenced, so effectively, only 23 antennas participated in this experiment.
New longer integration 8.5 GHz data were obtained in May 2005 mainly to improve the sensitivity in order to better define the radio jet morphology than in the previous 2001 image published in Paper I. Three antennas were being retrofitted for the EVLA at the time leaving 24 in the new experiment. The first hours of observations were flagged as this was when the target was rising (15-25 deg elevation) and high cloud cover was reported. This left 6.25 hours of on-source time in the 8 hr observing run. After standard calibration and imaging, we removed the core (3.23 Jy) with the UVSUB task in AIPS to isolate the inner jet emission. We merged the new 8.5 GHz dataset with the previous one from 2001 but found no significant improvement in the images produced; only data from the latter epoch are used here. In the final core-subtracted image clean components were convolved with a circular Gaussian of FWHM=0.7”, so radio structures appearing non-circular in Figures 7 & 8 are intrinsically elongated.
Off-source rms levels for the radio images are listed in Table 1 along with the resultant dynamic range relative to the image peaks. In all cases, the rms is higher than the expected theoretical limit (factors from 3–10 times larger). This is presumably due to a combination of the bright radio core and the low-declination of the target making the field difficult to map. In the vicinity of the core, imaging artifacts (in the north-south direction) are somewhat obvious and the rms levels are even higher than the off-source values. This is reflected in the upper limits for several of the undetected inner radio knots reported in Table 2.
4 Jet Morphology
4.1 X-ray Morphology
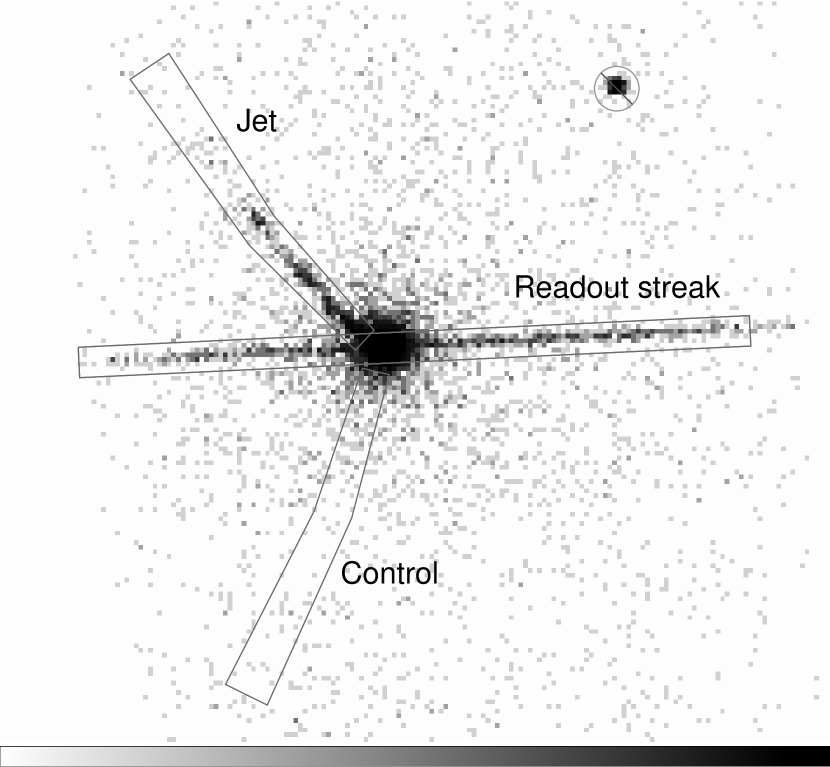
We consider the X-ray morphology of the large scale jet starting 3 arcsec away from the quasar centroid. The analysis of the quasar core and the small scale structure in the vicinity of the quasar will be presented elsewhere.
The smoothed ACIS-S image in Fig. 1 shows a complex structure of a continuous X-ray emission along the jet up to arcsec distance from the core. There are several brightenings present within a diffuse X-ray emission between the brightest knots. The jet width is resolved and a structure at arcsec distance from the core showing a kink is “real”. We discuss this kink in the section below.
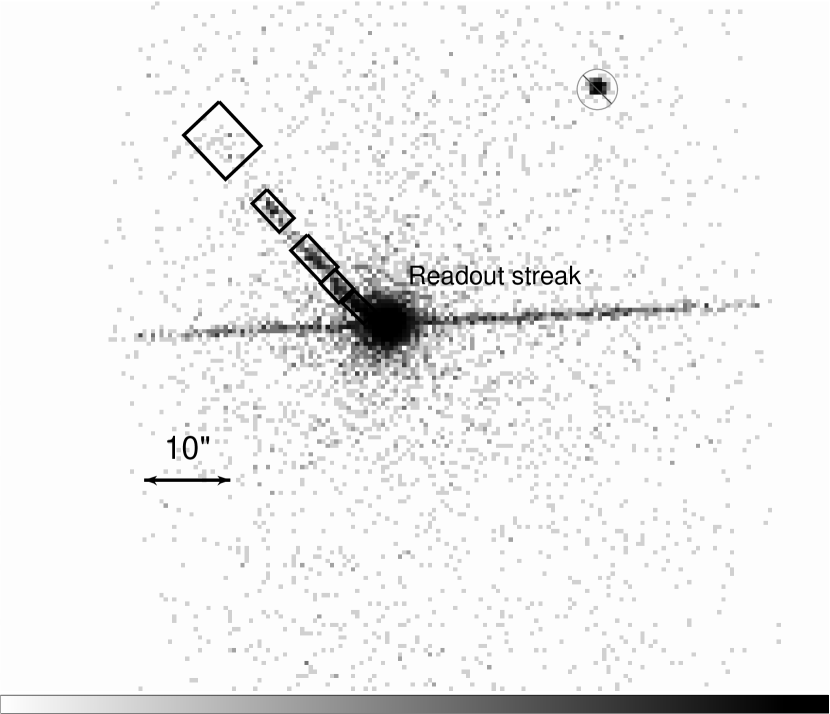
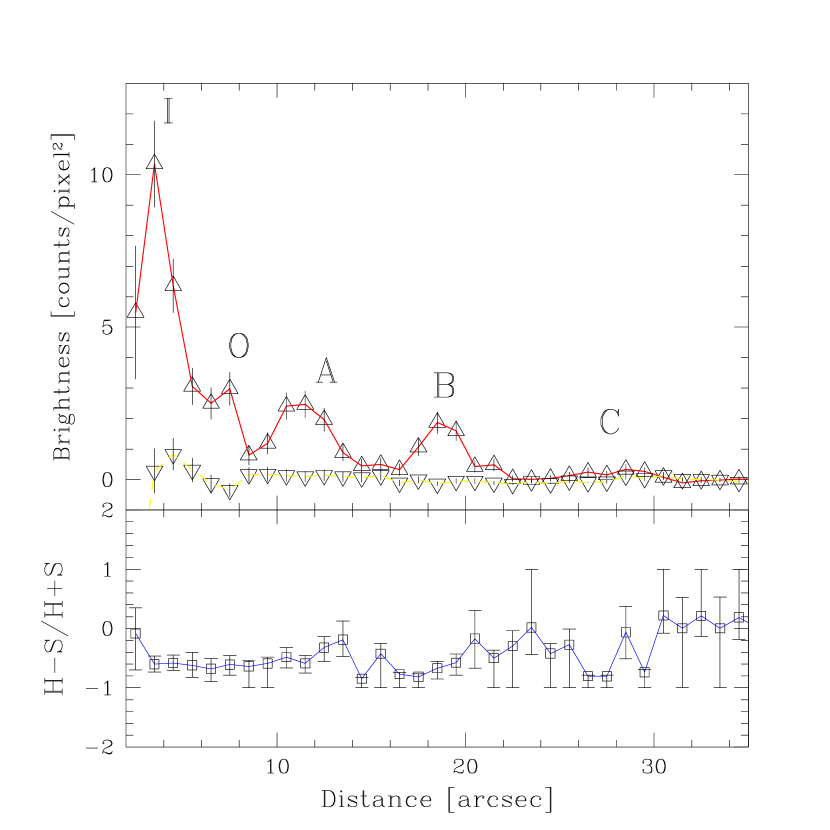
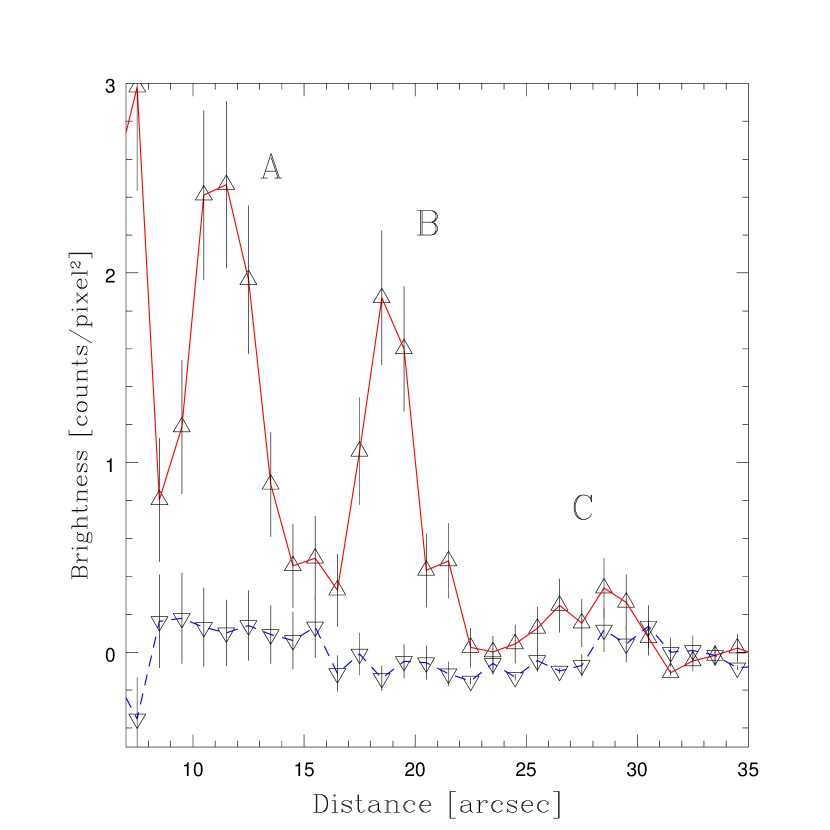
We constructed an X-ray jet profile along the jet and a control profile with the regions shown in Fig. 2. The background for each jet’s cell was taken from an annulus with radial widths of the jet cell, excluding the readout streaks, the control region and a bright point source. The resulting profile is presented in Fig. 3. The jet X-ray emission declines gradually along the jet with the knots A, B and C present. Figure 4 is a zoomed version of Fig. 3 to present the emission beyond knot B. The X-ray jet emission seems to stop at the “edge” of knot B before it slightly increases to form knot C. Comparison between the jet and control profiles in Fig. 4 indicates that the emission of knot C ends at arcsec, although the emission within the final 4 arcsec (between 26-30”) is only marginally detected.
The morphology of each knot is quite different. The profile of knot A shows a relatively sharp rise and a plateau before a gradual decline, while knot B profile is more peaked with a strong rise and decline (see Fig. 4). Knot C is the faintest knot with the X-ray emission spread over a larger area. As we show below, X-ray emission covers the area of the strongest radio emission, which is also diffuse here. One gets an impression that knot C looks more like a lobe than a knot. Although, even with Chandra resolution we still can only resolve structures on arcsec scales and even “compact” knots A and B are of the size of the entire M87 jet for example (see Fig.6 in Harris & Krawczynski 2006 for comparison of the jet projected lengths). Thus what we see reflects the overall integrated intensity within each region, while there might be many smaller scale regions which cannot be resolved.
Looking at both the jet profile and the smoothed X-ray image it is clear that the morphology of the jet is complex. In addition to the three knots we identify brightenings (knots O and I) between the core and knot A, as well as a drop in the surface brightness at arcsec from the core. We also detect the emission in between the knots.
4.2 Radio Morphology
The VLA radio maps 1.4 GHz and 5 GHz are presented in Fig. 6. The VLA 8.5 GHz map is in Fig. 7 and Fig. 8 and in this map the core has been subtracted to highlight the very faint jet structure. It is obvious that the radio emission of the innermost jet is very faint, with knot A at the detection threshold. The emission becomes strong at the outermost regions with knots B and C being quite strong. There is continuous emission between the last two knots, so their peak brightnesses are connected.
The 8.5 GHz radio profile of the jet shown in Fig. 5 shows the jet brightness increasing towards the final knot. The brightness of the last two knots is almost identical. The innermost regions of the jet, identified as region I are also detected at this frequency while there is only an upper limit to the radio emission at the location of the O feature.
Table 2 presents the radio flux density measurements for each map. Given the three radio frequencies we can determine the radio spectral index for the brightest knots and get equal to 0.8 and 0.9 for knots B and C respectively.
4.3 Radio and X-rays Connection.
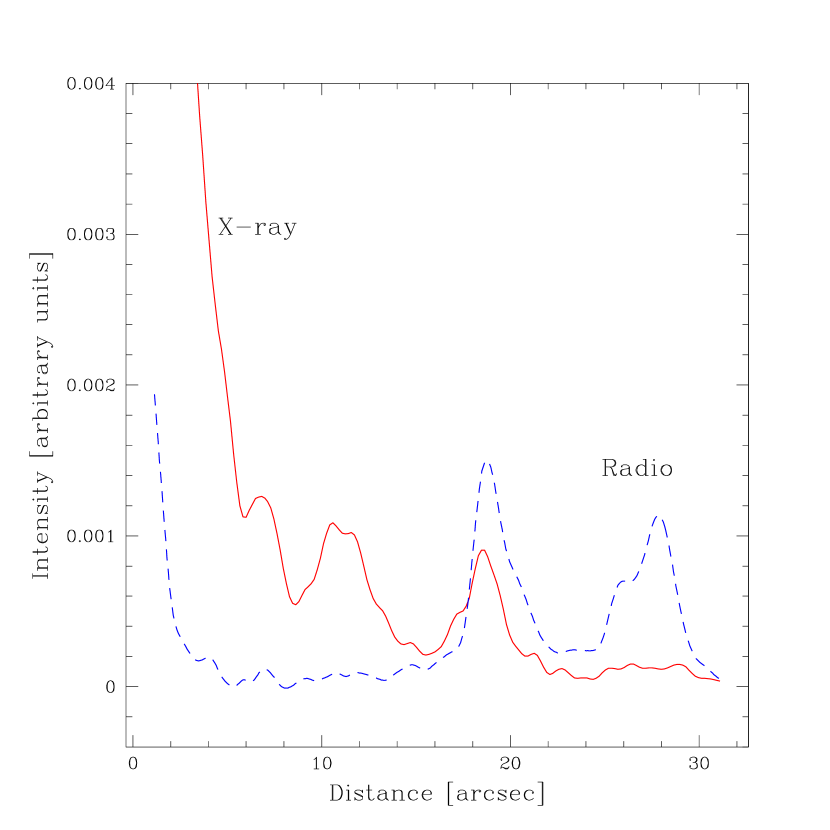
Figure 5 compares X-ray and radio intensities along the jet. The profile intensities were extracted assuming the same box region for the radio 8.5 GHz and X-ray (0.3-7 keV) data (using ds9 projection) and taking 2.5 arcsec width for the region box. The two profiles look quite different. The X-ray intensity decreases with the knots on top of a continuous emission, while the radio intensity stays at a very low level to about 16 arcsec when it sharply rises to form knot B, than decays to a diffuse level and rises again to form knot C. The three knots I, A and B are the strongest X-ray features, while knots B and C dominate the radio emission.
The X-ray emission of knot A is very prominent in comparison to the radio emission. It does not have an obvious peak, but rather a broad flat profile. Knot A is very faint in radio and its radio spectrum is very steep () in comparison to knots B and C whose spectra are more typical, (see Table 2).
The emission from knot B is very prominent in both radio and X-rays and the knot profiles can be studied in more details. In Paper I we reported the offsets between the radio and X-ray peak brightnesses of 1.4 arcsec for this knot (using the radio data with the uncertainties of 1 arcsec at 1.4 GHz and X-rays with uncertainties of 0.3 arcsec). Now, with the improved S/N Chandra image and 8.5 GHz radio data we can model directly the profiles of the knot and obtain more accurate locations of the peaks (see Fig. 5). We measure that the radio (8.5 GHz) and X-ray peak brightnesses are coincident to within 0.2 arcsec. The X-ray emission precedes the radio emission for this knot in the sense that the X-rays start rising before the radio and decay earlier than the radio. Thus the X-ray profile of this knot seems to be shifted in comparison to the radio profile.
The radio emission of knot C is strong and its profile shows a step before the final rise to the maximum at 28 arcsec. Then the emission drops and the knot ends at 31 arcsec. The X-ray emission is very faint with constant intensity.
5 Spectral Properties of the X-ray Knots
Fig. 3 show the hardness ratio along the jet. We define the hardness ratio as (H-S/H+S), where H is the hard source counts with 2-7 keV energies, and S is the soft source counts with 0.5-2 keV energies. The hardness ratio errors are calculated using the Bayesian algorithm of Park et al (2006). The jet’s X-ray spectrum has a constant hardness ratio up to about 8 arcsec, in the vicinity of the “kink” with a sudden drop in the jet intensity. The hardness ratio suggests a spectral change at this point which continues further along within knot A. It seems that the jet spectrum hardens along knot A, and then becomes softer again before hardening within knot B. The Signal-to-Noise ratio is too low to study the hardness ratio variations beyond knot B.
To characterize the jet spectral properties we extracted the X-ray spectra of small parts of the jet, assuming the box regions shown in Fig.2. The total number of counts and the best fit power law model parameters are presented in the Table 2. The power law slope indicates a hard (flat) spectrum for the inner regions I, O and knot A and a soft (steep) spectrum, , for the outer knots B and C.
To check whether the difference in the X-ray emission from the inner and outer jet is significant we extracted the spectra from the two large regions: the inner jet region contains knots I,O and A, and the outer jet knots B and C. We then fit these two spectra (using the calibration files appropriate for the new extraction regions) with an absorbed power law model. We obtain the power law slopes for each region, and . Thus the spectral difference between the two regions is at level. The hardness ratios based on the source counts for the inner and outer jets are -0.48 and respectively.
5.1 X-ray Diffuse Emission
We analyzed the X-ray emission between the knot A and B regions, e.g. in the annulus with inner and outer radii of 14 and 16.5 arcsec. There are total of 24 counts with energy between 0.3-8 keV and 18.3 net counts (assuming a background annulus with the same radii, but excluding the jet region). The detected number of counts is too small for detailed spectral analysis. However, the spectrum is soft based on the hardness ratio of -0.73.
6 Optical Jet?
An optical image of PKS 1127-145 that was taken with HST (Siemiginowska et al., 2002) shows a number of galaxies with a large galaxy across the X-ray jet. A Damped Lyman- system (DLA) at redshift 0.312 has been described by Bergeron & Boisse (1991) and Bechtold et al. (2001) (see also Bechtold et al. (2002) for detailed optical spectra). Because the DLA galaxy has to be located close to the line of sight to the quasar, it may affect the emission from the quasar jet. Our comparison between the X-ray and radio jet morphology indicates that the change in the jet shape is present in both bands (see Fig. 1 and Fig. 6), thus we can exclude the absorption of jet emission by the foreground galaxy as a cause for the observed jet morphology. A slight change in the direction of the jet might therefore be intrinsic to the jet or a result of gravitational lensing of the jet by the foreground galaxy.
There is no detection of the optical jet and the limits for the optical jet emission were given in Siemiginowska et al. (2002) for knots B and C. The limits for knot A and remaining inner knots cannot be obtained due to the galaxies in the field. These limits are too high to provide additional constraints on the jet properties. Deeper optical/IR imaging is necessary to improve the limits.
7 Discussion
The radio and X-ray images of the PKS 1127-145 jet and the analysis of the jet’s broad-band spectral properties reveal significant differences between the inner () (knots I, O, and A; hereafter ‘the inner jet’), and the outer portions of the jet (, knots B and C; hereafter ‘the outer jet’). This is not unusual among the large-scale quasar jets and it is seen in the 3C 273 jet for example (Uchiyama et al. 2006 and references therein). However, one should note the large extension of the PKS 1127-145 jet: both its inner and outer parts have projected sizes of kpc each, while the entire 3C 273 jet structure is only kpc-long.
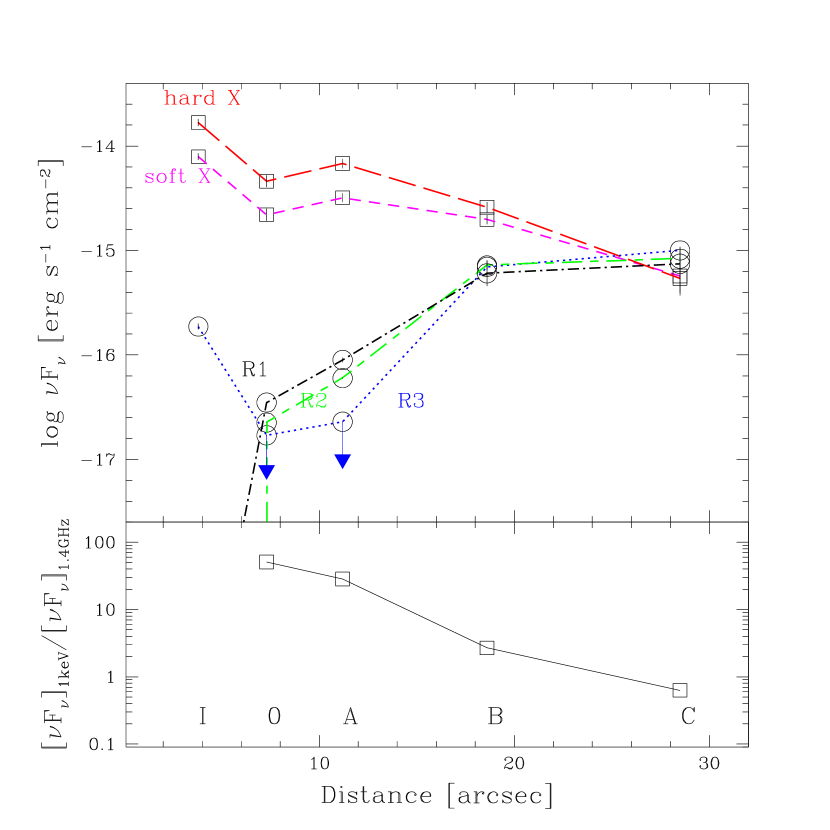
The PKS 1127-145 inner jet is very weak in the radio band, especially at high frequencies ( GHz), while it is bright in X-rays. However, the X-ray and radio luminosities of the outer jet are roughly comparable (see figures 5, 7, and 9). A general trend of a smooth decrease in the X-ray flux, and a slow increase in the radio flux can be noted along the jet, with the exception of the innermost knot I (for which the measured radio fluxes may suffer from contamination of the extremely bright core). This, discussed previously by Hardcastle (2006), is again reminiscent of the 3C 273 jet. In particular, the ratio of keV to GHz luminosities decreases by about two orders of magnitude starting from at the position of knot O, to at the position of knot C. At high radio frequencies this decrease seems to be even stronger, since the upper limits for the GHz flux for knots O and A translates to the luminosity ratio .
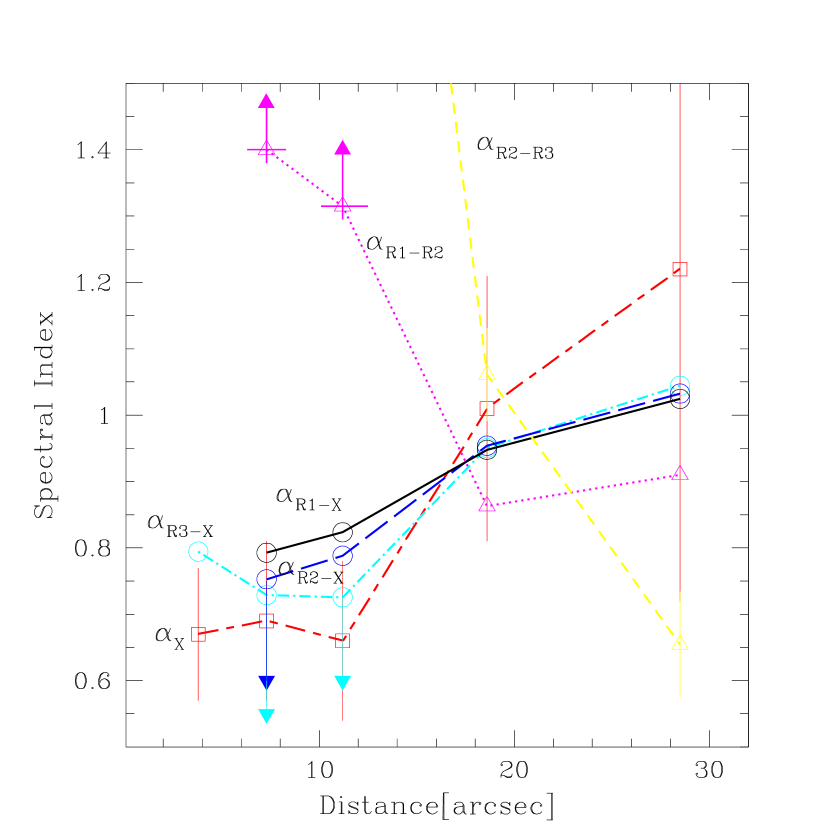
The X-ray spectral index is constant within the inner jet, , and it is slightly smaller than the radio spectral indices between , and GHz, namely . Also it is smaller than the radio-to-X-ray power-law slopes (see figure 10), although the errors in estimating the appropriate radio fluxes are large. We note that at the position of knot A the GHz flux is especially low and the high frequency part of the radio continuum is very steep. Thus, the electrons emitting X-ray photons in the inner jet, regardless of the particular emission process (synchrotron or inverse-Compton), are characterized by a much flatter energy spectrum than the radio-emitting ones. The situation is however much different for the outer jet. Here the relatively large X-ray spectral indices, , seem to be larger than the radio-to-X-ray power-law slopes or radio spectral indices, which are all (see figure 10).
Lack of reliable optical data makes it difficult to investigate the broad-band energy distribution of the inner jet emission. On the other hand, as shown recently by Uchiyama et al. (2006) and Jester et al. (2006) for the case of the 3C 273 jet, a comparison between the broad-band radio-to-optical and the optical-to-X-ray power-law slopes can be misleading in deducing the origin of the jet X-ray emission unless detailed optical photometry, and not solely upper limits, is available. Such detailed optical information is unfortunately not available for the PKS 1127-145 jet, and so below we focus strictly on the confrontation of the radio and X-ray data, in particular their global characteristics, instead of modeling isolated knot regions. First we discuss whether the observed morphological and spectral properties of the radio/X-ray PKS 1127-145 jet can be explained in the framework of the ‘one emitting-zone’ IC/CMB and synchrotron models. The particular issues to be explained are: (i) a decrease of the X-ray flux, (ii) an increase of the radio flux, (iii) a steepening of the X-ray continuum, and (iv) a flattening of the radio continuum along the jet. Later, in the last two sub-sections, we present a two-component jet emission model and finally discuss the application of intermittent/modulated jet activity to this source.
7.1 The ‘One-Zone’ Inverse-Compton Hypothesis
The simplest version of the one-zone IC/CMB model to consider would involve relativistic outflow with negligible bulk deceleration and energy dissipation, expanding adiabatically when propagating through the intergalactic medium. This, in fact, was argued by Tavecchio et al. (2004) to be the case for the Chandra jets in PKS 1510-089 and 1641+399, and so below we check if it also applies to PKS 1127-145 source. Under the above assumptions, the appropriate inverse-Compton luminosity of the jet plasma with the comoving volume observed at a given frequency can be written as
| (1) |
where and are the jet Lorentz and Doppler factors, is the jet comoving energy density of the CMB radiation, and is the electron energy distribution such that the electron energy density is (see, e.g., Stawarz et al. 2003). Here the unprimed quantities correspond to the stationary rest frame at the redshift of the source. The adiabatic losses due to the jet’s expansion between the location and from the nucleus leads to and , where , and or for 2D or 3D expansion, respectively (see, e.g., Stawarz et al. 2004). Thus, the observed monochromatic — e.g., X-ray — inverse-Compton luminosity is evolving along the adiabatically expanding (in 2D, the case considered hereafter for illustrative purposes) and non-decelerating jet as , where we assumed a power-law form for the electron energy distribution .
Meanwhile, changes of the observed synchrotron luminosity at some given observed frequency , where is the jet magnetic field intensity, can be found from the appropriate expression
| (2) |
where is the jet comoving magnetic field energy density. Thus, the observed monochromatic synchrotron — e.g., radio — luminosity scales as , since magnetic field intensity does change within adiabatically expanding outflow, . As a result, the ratio of the observed inverse-Compton to synchrotron luminosities at chosen observed frequencies (e.g., keV and GHz) reads as , assuming that the shape of the electron energy distribution is roughly the same all along the jet (which is a good approximation for the value suggested by the observed range of the X-ray and low-frequency radio indices in the PKS 1127-145 jet). Note that the ratio is then completely described by the magnetic field evolution and the electron spectral index so long as does not change down the jet.
It follows immediately from the above that in the case of adiabatic expansion of a jet with conserved magnetic energy flux, both inverse-Compton and synchrotron luminosities decrease along the outflow. For example, if the jet magnetic field consists predominantly of a poloidal or toroidal component, the field is expected to scale with a distance as or , respectively. The former (‘poloidal’) scaling cannot however hold along the entire jet length, i.e. from the jet base (a few to several Schwartzschild radii from the nucleus) up to the jet termination point (about kpc from the active center). Indeed, taking the maximum magnetic field intensity G at the jet base (as appropriate for ten Schwartzschild radii from the central black hole with mass ) it would imply unrealistically low intensities on hundred kpc scales, G (see recent discussion in Sikora et al. 2005 regarding the magnetic field in quasar jets). Therefore we consider only the case (see in this context Tavecchio et al. 2004), in which the X-ray (inverse-Compton) luminosity scales with distance as while the radio (synchrotron) one as for the assumed . This scaling of luminosities indicates that in the framework of the one-zone IC/CMB model no adiabatic expansion of the PKS 1127-145 jet is possible, since otherwise the expected attenuation of the X-ray and radio fluxes would be inconsistent with the data. Indeed, taking the positions of knots O and C relative to the core as and , respectively (see Table 2), one should expect , and . Meanwhile, the observations indicate that although the keV luminosity decreases by about an order of magnitude between knots O and C, the GHz luminosity increases by as much as a factor of instead of decreasing be a factor of 100..
Given the above conclusion we now consider an efficient confinement of the outflow, i.e. no jet expansion, which would give the slowest attenuation of the synchrotron (radio) luminosity. We also allow for the jet deceleration, , and non-adiabatic changes of the jet magnetic field due to the related dissipation of the jet kinetic energy. The expressions (1) and (2) give then and . In this case, an increase of the radio luminosity could be obtained if the jet magnetic field is amplified. For instance, for a choice of and the X-ray luminosity decreases as , while the radio luminosity increases like , resulting in (required by the data) a factor of change in the X-ray-to-radio luminosity ratio. However, such changes would imply a significant amplification of the jet magnetic field energy density, since so that . If, therefore, the energy equipartition between the jet magnetic field and the radiating electrons is valid for knot O, , then for knot C the equipartition would have to be broken, . In order to keep the energy equipartition, one would have to assume that the normalization of the electron energy distribution also increases along the jet just like , giving and , i.e. that the amount of the jet energy dissipated to the radiating particles is always equal to the one transferred to the jet magnetic field. This would imply then slightly more efficient deceleration and slightly less efficient magnetic field amplification, namely and , to reproduce the observed luminosity profiles.
Sambruna et al. (2006) fit the ‘one-zone’ IC/CMB model to two X-ray jets, in the quasars 1136-135 and 1150+497, with similar jet luminosity trends to that observed in PKS 1127-145, and obtained exactly the same change in IC/CMB model parameters as calculated above, i.e. lowering with increase in the B field and in the normalization of the electron distribution along the jet (see their Fig. 12). As shown above, this is in fact a natural consequence of the equipartition requirement in the IC/CMB model if the decreasing (along the outflow) X-ray luminosity anticorrelates with the radio one. Tavecchio et al (2006) proposed that such changes in the jet parameters and the resulting radio and X-ray profiles are due to the entrainment of the intergalactic medium by the large-scale jet, but as shown by Hardcastle (2006) the entrained masses required are implausibly high in some cases.
Yet, the observed changes of the X-ray and radio spectral indices along the PKS 1127-145 jet pose problems to the Inverse-Compton scenario. Indeed, in the framework of the IC/CMB model electrons emitting the observed keV photons have Lorentz factors , while the electrons emitting the observed GHz synchrotron radiation have Lorentz factors , where G. Thus, for any Doppler factor and a magnetic field close to the equipartition value (see Siemiginowska et al. 2002, Kataoka & Stawarz 2005) one has . This means that radiative cooling, if being a dominant factor shaping the spectral indices’ profiles along the PKS 1127-145 jet, would be more pronounced in radio frequencies than in the X-rays. In other words, the radio continuum should have to steepen more significantly with distance than the X-ray continuum. In fact the observed behaviour is just the opposite: the radio spectral indices decrease along the jet, while the X-ray spectral index eventually increases. Which is even more surprising is that in the outer portion of the jet the X-ray spectral index is larger than the radio one, what — in the framework of the IC/CMB model — would imply that the energy distribution of the radiating electrons unexpectedly steepens towards the lower energies.
Thus, we conclude that the simplest one-zone IC/CMB model is not consistent with the observed morphological and spectral properties of the PKS 1127-145 radio/X-ray jet unless arbitrary additional assumptions are invoked. In any case, its adiabatic version can be completely rejected.
7.2 The ‘One-Zone’ Synchrotron Hypothesis
Because of the extremely large jet lengths and extremely short radiative cooling timescales of electrons with energies required for the synchrotron X-ray emission (Lorentz factors ) one obvious requirement of the synchrotron hypothesis is continuous acceleration of the high-energy electrons along the jet. The simplest version of the ‘one-zone’ synchrotron model would be therefore a scenario in which some unspecified acceleration mechanism is acting continuously and similarly within the entire uniform jet volume, producing and maintaining a uniform electron energy distribution with the steep power law plus flat spectrum component at high energies. Such an energy spectrum could be characterized in a zero-order approximation by two power-laws with indices and at low and high electron energies, respectively. As in the case of the inverse Compton hypothesis let us check if such a simple model can account for the observed properties of the PKS 1127-145 jet.
Just like in the previous subsection, one can conclude that no adiabatic expansion of the jet is possible, since the radio luminosity would decrease along the jet much faster than the X-ray. An efficient confinement of the jet and non-negligible dissipation of the bulk kinetic energy give a scaling of the high- and low-energy synchrotron luminosities and , and thus . Lets take the illustrative spectral indices of the electron energy distribution close to (representing the low-frequency radio continuum) and (representing freshly accelerated, i.e. uncooled X-ray emitting electrons). We note that for example relatively well understood stochastic acceleration of particles due to resonant scattering on turbulent MHD waves characterized by the energy spectrum is expected to result in formation of the steady state particle energy distribution where (for particle energies below the maximum energy defined by the radiative loss timescale; see the discussion in Kataoka et al. 2006). Thus, for the typical turbulence energy index one should indeed expect particle spectra with , i.e. much flatter than the ones claimed by the shock scenarios ().
It follows immediately that the agreement between the predicted and the observed luminosity profiles along the PKS 1127-145 jet is possible only if the high-energy spectral component of the radiating electrons is very flat, and if in addition the magnetic field is strongly amplified along the jet. Namely, the decrease of the X-ray luminosity by a factor of and the increase of the radio luminosity by a factor of would be possible for only if and , while would require even more drastic magnetic field amplification. These changes of the jet parameters are worrisome, simply because it is difficult to isolate the appropriate mechanisms causing such a strong jet deceleration and extremely effective conversion of the jet kinetic energy to the magnetic one (see again comments by Hardcastle 2006 on the entrainment process on large scales). Although it can be argued that some magnetic field amplification and some bulk deceleration are taking place along the extragalactic large-scale jets anyway, as suggested by the observed in many cases the increase in the radio surface brightness and decrease in the jet-couterjet brightness asymmetry away from a core, the particular model parameters obtained above are rather too extreme and should be considered implausible.
On the other hand, the assumption about the uniform electron energy distribution within the entire jet is not a natural nor a realistic one for the synchrotron/continuous acceleration scenario. In fact, if the high-energy flat-spectrum (pile-up) component in the electron distribution is produced, it results most probably from turbulent acceleration processes. Thus, the normalization, the effective spectral index, and the cut-off energy of such a pile-up component should depend on the local plasma conditions at a given distance along the jet (magnetic field intensity, turbulence parameters, jet velocity structure, etc.). These factors can influence significantly model predictions when compared to the simplest scenario discussed above (which can hardly explain the observed radio/X-ray flux profiles along the PKS 1127-145 jet). Discussing all these effects would require much deeper insight into the microscopic processes in relativistic magnetized plasma, which are still hardly known. We can however consider briefly one simple possibility and discuss the consequences of the assumption that the normalization of the high-energy flat spectrum electron component producing synchrotron X-rays depends on the kinematic parameters of the jet. Since the jet shear boundary layer is the site of choice for generation of the high energy electrons (Stawarz & Ostrowski 2002), one could speculate that the efficiency of the particle acceleration process (and thus the normalization of the electron distribution , where at high energies) is somehow proportional to the velocity shear across the relativistic outflow, (where is the radial jet dimension and is the jet radius), at any distance from the core. That is to say, for the confined cylindrical jet () and a constant jet viewing angle, we introduce a simple scaling with the power-law coefficient being for generality. In such a case, with and considered previously, the synchrotron X-ray and radio luminosities should go like and . Taking therefore as an arbitrary illustrative value, one can find that moderate changes and reproduces well the luminosity profiles observed along PKS 1127-145 jet. These are then not implausible anymore.
However, the observed changes of the X-ray and radio spectral indices are again problematic for the simple synchrotron model discussed here. While it is true that one should expect some ageing of the X-ray continuum, it is not clear why the observed increase of the X-ray spectral index is so gradual, and in addition accompanied with a flattening of the radio spectrum. If one assumes that the freshly accelerated high-energy part of the electron energy distribution is indeed very flat () then the spectral index of the constantly injected radiatively cooled (by the standard synchrotron-type energy losses) high-energy particles should be equal to . This is quite close to the X-ray spectral index observed within the inner jet. Meanwhile, in the outer jet the X-ray spectral index steepens, suggesting either a significant change in the initial power-law slope of the electron pile-up component (down to ), or significant differences in the cooling mechanism in the inner and outer jet. Whatever the case, it is hard to understand why in the inner jet, where the postulated pile-up emission would be relative flat (and hence the required acceleration process is especially efficient), the observed synchrotron continuum at high radio frequencies is very steep.
To summarize, we conclude that also the simplest one-emitting zone version of the synchrotron model with uniform (though non-standard, i.e. concave) electron energy spectrum, cannot easily explain the observed morphological and spectral properties of the PKS 1127-145 radio/X-ray jet.
7.3 A Two-Component Model: the Jet and a Sheath.
A natural solution to the problems encountered by the homogeneous one zone models is to assume that the observed radio and X-ray radiative components are produced in separate regions, possibly by separate and different acceleration processes. Here, we suggest that indeed the detected X-ray photons originate within the proper jet flow, while the radio photons come from a sheath — a slow moving radial extension of the jet boundary (mixing) layer. Such a possibility is in fact not novel, since it is a variation of the stratified jet scenario (see De Young 1986, Komissarov 1990, Laing 1996, Ostrowski 2000, discussing different aspects of this issue), noted before in the particular case of the Chandra quasar jets by Hardcastle (2006). We emphasize, that this proper jet-sheath model is not exactly the same as the spine-shear layer. The sheath here is associated with some extension of the jet boundary (similarly to 3C 273 jet/cocoon system; see Bahcall et al. 1995), while the proper jet means a fast spine together with the shear layer.
In a framework of the two-component jet model, all the information regarding the broad-band jet emission is restricted to the X-ray band. In other words, there are not many additional constraints which could help to distinguish between the synchrotron and inverse-Compton origin of the observed X-ray keV photons — both these possibilities have to be kept in mind. However, in an analogy to the X-ray jet in 3C 273, where almost the same gradual decrease of the X-ray flux and steepening of the X-ray continuum along the jet is observed, one could argue that also in the case of PKS 1127-145 the X-ray radiation is most probably due to the synchrotron emission of the high energy electrons accelerated continuously within the jet volume (see a discussion in Uchiyama et al. 2006, Jester et al. 2006, and references therein).
Note also, that assuming a radio-to-X-ray continuum characterized by a single power-law with a slope (corresponding to the particle spectral index ), the expected radio emission of the proper jet would be always below the observed radio emission from the PKS 1127-145 jet regions, since all the radio-to-X-ray spectral indices shown in figure 10 are . The same is true for the optical emission, as the optical upper limits available for the knots B and C (Siemiginowska et al. 2002) imply optical-to-X-ray power-law slopes . That is not to say that the jet broad-band emission is in reality a single power-law form. Indeed, it may be characterized by a more complicated spectral shape for which however we do not have any strong evidence.
By definition, a two-component model doubles the number of free parameters, making model predictions more flexible when confronted with the data. Lets therefore briefly discuss whether the observational X-ray/radio constraints (i)-(iv) listed at the beginning of this section could be explained in a natural way in a framework of such a scenario.
7.3.1 The Proper Jet
The observed smooth decrease of the X-ray flux, when unconnected with the increase of the radio one, is in fact expected as a result of the decrease in the inverse-Compton or synchrotron luminosities along (even extremely slowly) decelerating and/or expanding jet. These luminosities (see equations 1 and 2 above) can be expressed as
| (3) |
and
| (4) |
respectively, where erg cm-3 at the redshift of PKS 1127-145, where the factor characterizes the electron energy spectrum with considered hereafter, and is the comoving emitting volume of some cylindrical portion of the jet with the longitudinal and radial (with respect to the jet axis) dimensions and , respectively. For example, assuming the energy equipartition along the jet, an attenuation of the jet magnetic field (where ), and a constant jet’s (small) opening angle , one obtains the synchrotron luminosity profile , if only the broad-band spectral shape of the emitting electrons (i.e., factor ) is roughly constant along the jet. Thus, the observed decrease of the X-ray luminosity, by a factor of between knots I and C (see figure 9), requires for the negligible changes in the jet Doppler factors. This, in turn, implies a decrease of the jet magnetic field by a factor of along the jet, which is the most extreme change needed, i.e. a lower limit, since some non-negligible (though rather small) decrease of the jet Doppler factor should be expected. Indeed, if the jet Doppler factor decreases by only a factor of between knots I and C, then no decrease of the jet magnetic field intensity is needed to explain the observed decrease of the X-ray (i.e., synchrotron) luminosity along the PKS 1127-145 jet. This is much more comfortable situation than a significant amplification required by one-zone models discussed above.
Similarly, in the case of the inverse-Compton X-ray luminosity assuming the radiating electrons-magnetic field energy equipartition , one gets , leading to the required for the negligible changes in the jet Doppler factor between knots I and C. This would imply a significantly larger decrease of the jet magnetic field intensity than before (by a factor of ) but, again, any small decrease of along the jet can adjust required parameters.
We now check if the observed gradual increase in the jet X-ray spectral index (i.e. when decoupled from flattening of the radio continuum) can be incorporated into the synchrotron and the inverse-Compton scenarios, by means of adjusting the appropriate radiative losses and dynamical time-scales. We note, that at the redshift of PKS 1127-145, the comoving energy density of the jet magnetic field dominates over the energy density of the CMB radiation as measured in the jet rest frame, , if only G. This condition is difficult to fulfill, since in the case of quasar large-scale jets we expect and G. Thus, radiative cooling of the jet electrons in PKS 1127-145 is expected to be mainly due to inverse-comptonization of the CMB photons.
The transition between slow- and fast-cooling regimes for the X-ray emitting electrons occurs at the distance along the jet, , where the dynamical time-scale equals the radiative losses time-scale . Here , and the value of the CMB energy density is erg cm-3. With , the observed X-ray photon energy keV, and the energy of the CMB photons meV at the redshift , one can find
| (5) |
This, when compared to the projected distance of knot B at which the break in the X-ray spectrum is observed, kpc, is extremely large. In fact, it can be found that the deprojected distance of knot B equals the expected break radius only for unrealistic jet parameters. Namely, (where is the jet viewing angle) requires large bulk Lorentz factors of the jet and very large jet inclinations, deg deg for , leading to the energetic problems. This means that the IC/CMB model cannot explain the observed steepening of the X-ray continuum along the PKS 1127-145 jet in terms of the spectral ageing of the low-energy electrons. Instead, an ‘intrinsic’ change of the electron spectral shape (i.e. not due to the radiative cooling but particle acceleration processes) has to be invoked to explain observations, what is also the case for the synchrotron scenario (for which analogously evaluated is much smaller than ).
7.3.2 A Sheath
Now we turn our attention to the jet sheath which, by assumption, dominates the observed radio emission of the PKS 1127-145 jet. Here we investigate if the sheath hypothesis can explain in a simple way the observed increase of the radio flux along the jet accompanied by a flattening of the radio continuum. Note first, that a very similar spectral (radio) behaviour is in general observed in all lobes of FR II radio galaxies. In particular, a steepening and an attenuation of the radio emission away from the jet termination point in the direction of the nucleus observed in FR II sources is widely interpreted as a result of the spectral ageing of the radio-emitting plasma (see Kaiser 2000 and references therein). In the case of the PKS 1127-145, however, we propose that the observed radio emission originates from some radial extension of the outflow rather than from the radio lobe (i.e. plasma backflowing from the jet termination hot spot). Thus the question we should answer is why the inner jet (knots I–A) produces a very weak and steep-spectrum radio sheath, while the outer jet (knots B and C) a relatively bright and flat spectrum one. (On the other hand, a strict distinction between a jet sheath and a lobe may be quite artificial, especially in the outer portions of the jet.)
We propose that the reason for the observed PKS 1127-145 jet behaviour is the difference in the dominant cooling process of the radio-emitting sheath’s electrons: a radiative cooling within the inner sheath (surrounding the inner jet), and an adiabatic cooling within the outer one (corresponding to the outer jet). As is well known, the frequency independent adiabatic losses cannot significantly affect the spectral shape of the synchrotron emission, while the frequency-dependent radiative losses result in a spectral steepening above a given frequency. Such a steepening may be significant (resulting even in spectral cut-offs at low radio frequencies), depending on the detailed evolution of the radiating particles, which in turn depends on the structure of the magnetic field in the emission region. This could possibly explain a flat radio spectrum outer sheath and steep spectrum outer sheath. In order to investigate this idea in more detail, we assume a non-relativistic bulk velocity of the sheath plasma, and inefficient particle acceleration processes acting thereby. This is rather for illustrative purposes only and an order-of-magnitude estimate, since in the observer’s rest-frame the sheath material may be still moving relativistically, if only the inertia of the proper jet is big enough to ensure a relativistic advance velocity of the jet’s head. In fact, this may be the case of PKS 1127-145, which can also help to understand an apparent lack of the counter-sheath on the other side of the nucleus (just like in 3C 273 as discussed in Stawarz 2004).
The radiative (synchrotron and IC/CMB at ) cooling time scale for the electrons emitting synchrotron photons at frequency can be expressed as
| (6) |
where ‘min’ indicates a minimum of two values, Hz and, as before, G. Meanwhile, the time scale for the adiabatic losses can be approximated as
| (7) |
where kpc, and we assumed that the sheath expansion velocity is roughly constant at a given distance from the nucleus, . Our model requires then for the inner sheath, and for the outer one. As argued below, this may be in fact expected.
Assuming that the radio sheath in PKS 1127-145 is in a direct contact with the gaseous environment of the intergalactic medium (IGM) characterized by the particle number density and temperature , the velocity of the sideway expansion for the sheath can be found as , where is the internal pressure of the radio emitting (ultrarelativistic) plasma. With the minimum power condition fulfilled within the sheath, one has , and therefore , where cm-3. Now, for the inner sheath we assume pressure balance , where is the thermal pressure of IGM. This implies that the expansion of the inner sheath is happening at the sound speed, , i.e., for the expected K, and that the magnetic field intensity within the sheath, , is simply . Interestingly, for the expected on kpc distances from the center of the typical galaxy group environment (see, e.g., Mathews & Brighenti 2003), coinciding by assumption with the core of PKS 1127-145 radio source, our simple model gives very realistic value , and thus the radiative lifetime Myrs for the electrons emitting GHz synchrotron photons. This timescale, as required, is then shorter than the expansion timescale Myrs. Moreover, the obtained radiative cooling is roughly comparable to the jet lifetime at the position of knot A, which can be crudely evaluated as Myrs for the jet advance velocity and the assumed jet viewing angle . Thus, a very weak (and steep-spectrum) radio emission at the position of knot A may be explained by the sheath hypothesis.
Meanwhile, further away from the core, at the position of the outer jet, a decreased pressure of the ambient medium is likely to result in a more rapid expansion of the sheath. Namely, anticipating relatively steep profile of the IGM density with , one can expect thermal medium surrounding the outer sheath being as rarified as . In this case, taking as before, one obtains the adiabatic cooling timescale Myrs, likely shorter than (or at least comparable with) the radiative timescale for the electrons emitting GHz synchrotron photons, again as required by the model. Thus, dominant adiabatic cooling can indeed result in the flat-spectrum radio emission at the position of knots B and C. Interestingly, the expansion velocity of the outer sheath in a framework of the proposed scenario is expected to be larger than the sound speed in IGM, . This can possibly result in formation of a weak shock in the thermal medium being in the closest vicinity of the radio structure. Further investigation of this issue, involving analysis of the X-ray environment of PKS 1127-145 radio source, is in preparation.
7.4 Modulated Jet Activity
The bolometric luminosity of the PKS 1127-145 nucleus, based on the observed optical-UV isotropic continuum, is about erg sec-1 (Błażejowski et al. 2004). The black hole mass determined by Fan & Cao (2004) is about M⊙ which gives an Eddington luminosity of erg sec-1. Thus, PKS 1127-145 seems to accrete close to the Eddington limit, since . During the jet activity epoch the quasar would then provide a total energy of
| (8) |
where is the efficiency factor of converting the accretion power into the kinetic power carried with the jet. Because the kpc projected length of the PKS 1127-145 jet implies Myrs (with the speed of light providing an upper limit for the jet advanced velocity, and with the illustrative jet viewing angle of deg), the total energy transported by the jet is ergs, assuming continuous jet activity (i.e. constant kinetic power of the outflow during the entire activity epoch)
In this context we raise an issue on the nature of the knots in PKS 1127-145: can they be considered as the extended shock waves formed within a more or less continuous jet outflow? In our opinion not, since the projected linear sizes of these knots are uncomfortably large ( kpc). Instead, we believe that it is much more natural to consider knots I, O, A, B, and C as representing the separate portions of the jet produced by the active PKS 1127-145 core in separate epochs of its higher activity (see a discussion in Stawarz et al. 2004 and Siemiginowska et al 2002). Since all of the PKS 1127-145 knots are a few tens of kpc long, the postulated duration of a continuous activity epoch would be roughly yrs. It is therefore not surprising that this kind of intermittency is the most pronounced in PKS 1127-145, possessing the longest X-ray jet known.
Interestingly, the radio core of PKS 1127-145 itself has been classified as a Giga-Hertz-Peaked Spectrum (GPS) source (Stanghellini et al. 1998), which are established to be young, i.e. yrs old, versions of powerful radio galaxies (see O’Dea 1998). However, as argued by Błażejowski et al. (2004) based on the multiwavelength spectrum and the luminosity dominated by -rays, the unresolved core (at least the component producing its high-energy emission) seems to be related rather to the blazar phenomenon (see in this context also Tornikoski et al. 2001). The presence of -kpc-long radio/X-ray jet additionally questions the GPS nature of PKS 1127-145 quasar. On the other hand, in a framework of the ‘modulated jet activity’ scenario — evidenced by double-double radio galaxies (Schoenmakers et al. 1999) and postulated by Reynolds & Begelman (1997) to explain statistics of GPS sources — there may be no contradiction in the above. Namely, the blazar core of PKS 1127-145 at the moment of the observation could be considered as being again in the very active state, i.e., producing another portion of the jet matter with the enhanced kinetic luminosity. At this moment, the new-born portion of the jet resembles the ‘classical’ GPS object, but at some later time it will be observed as an extended jet ‘knot’ (similar to the knots I, O, A, B and C discussed in this paper).
We note that signatures of intermittent AGN jet activity have been suggested also by many recent Chandra observation of X-ray clusters (Fabian et al 2003, McNamarra et al 2005). Typical timescales for this activity can be determined from the cluster X-ray and radio morphology, and they are within 10 years depending on the source (see, e.g., Nulsen et al. 2005a, 2005b, Forman et al. 2005, 2006). A total energy of ergs contained within large radio cavities in the most powerful clusters provides an estimate of the total energy carried out by the jet and radio plasma, consistent with our estimates for the quasar PKS 1127-145.
8 Summary and Conclusions
The new X-ray and radio data of the PKS 1127-145 jet do not provide an unambiguous conclusion on the dominant jet X-ray emission process. It is clear that simple synchrotron or inverse-Compton models do not apply and more complex models need to be developed. However, one needs to remember that the above discussion is based on averaging X-ray and radio morphologies that do not closely match and ignoring any individual sub-structures that might be present in the jet. As noted at the beginning of the discussion the PKS 1127-145 jet is about 10 times longer than the 3C 273 jet, while characteristic timescales for energy losses in both jets are similar. In addition, nearby sources (e.g. M87 or Cen A) show that jets have smaller scale structures that cannot be resolved in the higher redshift sources.
The X-ray and radio morphology and spectral properties of the PKS 1127-145 jet are similar to the 3C 273 jet, indicating that the 3C 273 jet is not unusual but a representative case for other quasar jets. The homogeneous one-zone (either IC/CMB or synchrotron) models are not consistent with the PKS 1127-145 X-ray and radio data, and their adiabatic versions can be rejected in general. A possible solution is a model in which the radio emission is produced within a jet sheath, while the X-rays come from the proper jet. This implies possibly a much different spectral and spatial evolution of the X-ray and radio spectra. In addition to this, we speculate that the jet intermittency also plays a role in shaping the observed jet morphology in PKS 1127-145.
One needs to remember that the two highest redshift X-ray jets known to date (GB 1508+5714, Siemiginowska et al. 2003; 1745+624, Cheung et al. 2006) are faint and the resolution scale in X-rays is of order kpc. Thus the conclusions about the dominant emission processes are based on averaging over unknown jet structures. Statistical analysis of large samples of high redshift jets may be the only method available to study jet properties and their impact on the environment in the early Universe.
References
- Bahcall et al. (1995) Bahcall, J. N., Kirhakos, S., Schneider, D. P., Davis, R. J., Muxlow, T. W. B., Garrington, S. T., Conway, R. G., & Unwin, S. C. 1995, ApJ, 452, L91
- Bechtold et al. (2001) Bechtold, J., Siemiginowska, A., Aldcroft, T. L., Elvis, M., & Dobrzycki, A. 2001, ApJ, 562, 133
- Bechtold et al. (2002) Bechtold, J., Dobrzycki, A., Wilden, B., Morita, M., Scott, J., Dobrzycka, D., Tran, K.-V., & Aldcroft, T. L. 2002, ApJS, 140, 143
- Bergeron & Boisse (1991) Bergeron, J., & Boisse, P. 1991, A&A, 243, 344
- Błażejowski et al. (2004) Błażejowski, M., Siemiginowska, A., Sikora, M., Moderski, R., & Bechtold, J. 2004, ApJ, 600, L27
- Bridle & Greisen (1994) Bridle, A. H. & Greisen, E. W. 1994, The NRAO AIPS Project – a Summary: AIPS Memo 87; Charlottesville: NRAO
- Celotti et al. (2001) Celotti, A., Ghisellini, G., & Chiaberge, M. 2001, MNRAS, 321, L1
- Chartas et al. (2000) Chartas, G., et al. 2000, ApJ, 542, 655
- Cheung et al. (2006) Cheung, C. C., Stawarz, Ł., & Siemiginowska, A. 2006, ApJ, 650, 679
- Dermer & Atoyan (2004) Dermer, C. D., & Atoyan, A. 2004, ApJ, 611, L9
- De Young (1986) De Young, D. S. 1986, ApJ, 307, 62
- Fabian et al. (2003) Fabian, A. C., Sanders, J. S., Allen, S. W., Crawford, C. S., Iwasawa, K., Johnstone, R. M., Schmidt, R. W., & Taylor, G. B. 2003, MNRAS, 344, L43
- Fan & Cao (2004) Fan, Z.-H., & Cao, X. 2004, ApJ, 602, 103
- Forman et al. (2005) Forman, W., et al. 2005, ApJ, 635, 894
- Forman et al. (2006) Forman, W., et al. 2006, astro-ph/0604583
- Freeman et al. (2001) Freeman, P., Doe, S., & Siemiginowska, A. 2001, Proc. SPIE, 4477, 76
- Georganopoulos & Kazanas (2004) Georganopoulos, M., & Kazanas, D. 2004, ApJ, 604, L81
- Hardcastle et al. (2004) Hardcastle, M. J., Harris, D. E., Worrall, D. M., & Birkinshaw, M. 2004, ApJ, 612, 729
- Hardcastle (2006) Hardcastle, M. J. 2006, MNRAS, 366, 1465
- Harris & Krawczynski (2002) Harris, D. E., & Krawczynski, H. 2002, ApJ, 565, 244
- Harris & Krawczynski (2006) Harris, D. E., & Krawczynski, H. 2006, astro-ph/0607228
- Jester et al. (2006) Jester, S., Harris, D. E., Marshall, H. L., & Meisenheimer, K. 2006, ArXiv Astrophysics e-prints, arXiv:astro-ph/0605529
- Johnston et al. (1995) Johnston, K. J., et al. 1995, AJ, 110, 880
- Kataoka et al. (2006) Kataoka, J., Stawarz, Ł., Aharonian, F., Takahara, F., Ostrowski, M., & Edwards, P. G. 2006, ApJ, 641, 158
- Kataoka & Stawarz (2005) Kataoka, J., & Stawarz, Ł. 2005, ApJ, 622, 797
- Kaiser et al. (2000) Kaiser, C. R., Schoenmakers, A. P., & Röttgering, H. J. A. 2000, MNRAS, 315, 381
- Komissarov (1990) Komissarov, S. S. 1990, Soviet Astronomy Letters, 16, 284
- Laing (1996) Laing, R. A. 1996, ASP Conf. Ser. 100: Energy Transport in Radio Galaxies and Quasars, 100, 241
- Marshall et al. (2005) Marshall, H. L., et al. 2005, ApJ, 156, 13
- Marshall et al. (2001) Marshall, H. L., et al. 2001, ApJ, 549, L167
- Mathews & Brighenti (2003) Mathews, W. G., & Brighenti, F. 2003, ARA&A, 41, 191
- McNamara et al. (2005) McNamara, B. R., Nulsen, P. E. J., Wise, M. W., Rafferty, D. A., Carilli, C., Sarazin, C. L., & Blanton, E. L. 2005, Nature, 433, 45
- Nulsen et al. (2005a) Nulsen, P. E. J., Hambrick, D. C., McNamara, B. R., Rafferty, D., Birzan, L., Wise, M. W., & David, L. P. 2005a, ApJ, 625, L9
- Nulsen et al. (2005b) Nulsen, P. E. J., McNamara, B. R., Wise, M. W., & David, L. P. 2005b, ApJ, 628, 629
- O’Dea (1998) O’Dea, C. P. 1998, PASP, 110, 493
- Ostrowski (2000) Ostrowski, M. 2000, MNRAS, 312, 579
- Park et al. (2006) Park, T., Kashyap, V. L., Siemiginowska, A., van Dyk, D. A., Zezas, A., Heinke, C., & Wargelin, B. J. 2006, astro-ph/0606247
- Reynolds & Begelman (1997) Reynolds, C. S., & Begelman, M. C. 1997, ApJ, 487, L135
- Sambruna et al. (2004) Sambruna, R. M., Gambill, J. K., Maraschi, L., Tavecchio, F., Cerutti, R., Cheung, C. C., Urry, C. M., & Chartas, G. 2004, ApJ, 608, 698
- Sambruna et al. (2002) Sambruna, R. M., Maraschi, L., Tavecchio, F., Urry, C. M., Cheung, C. C., Chartas, G., Scarpa, R., & Gambill, J. K. 2002, ApJ, 571, 206
- Sambruna et al. (2006) Sambruna, R. M., Gliozzi, M., Donato, D., Maraschi, L., Tavecchio, F., Cheung, C. C., Urry, C. M., & Wardle, J. F. C. 2006, ApJ, 641, 717
- Schoenmakers et al. (1999) Schoenmakers, A. P., de Bruyn, A. G., Röttgering, H. J. A., & van der Laan, H. 1999, A&A, 341, 44
- Schwartz (2002) Schwartz, D. A. 2002, ApJ, 569, L23
- Shepherd, Pearson, & Taylor (1994) Shepherd, M. C., Pearson, T. J., & Taylor, G. B. 1994, BAAS, 26, 987
- Siemiginowska et al. (2002) Siemiginowska, A., Bechtold, J., Aldcroft, T. L., Elvis, M., Harris, D. E., Dobrzycki, A. 2002, ApJ, 570, 543
- Siemiginowska et al. (2003a) Siemiginowska, A., Smith, R. K., Aldcroft, T. L., Schwartz, D. A., Paerels, F., and Petric, A. O. 2003a, ApJL, 598, L15
- Siemiginowska et al. (2003b) Siemiginowska, A., et al. 2003b, ApJ, 595, 643
- Sikora et al. (2005) Sikora, M., Begelman, M. C., Madejski, G. M., & Lasota, J.-P. 2005, ApJ, 625, 72
- Spergel et al. (2003) Spergel, D. N., et al. 2003, ApJS, 148, 175
- Stanghellini et al. (1998) Stanghellini, C., O’Dea, C. P., Dallacasa, D., Baum, S. A., Fanti, R., & Fanti, C. 1998, A&AS, 131, 303
- Stawarz & Ostrowski (2002) Stawarz, Ł., & Ostrowski, M. 2002, ApJ, 578, 763
- Stawarz et al. (2003) Stawarz, Ł., Sikora, M., & Ostrowski, M. 2003, ApJ, 597, 186
- Stawarz (2004) Stawarz, Ł. 2004, ApJ, 613, 119
- Stawarz et al. (2004) Stawarz, Ł., Sikora, M., Ostrowski, M., & Begelman, M. C. 2004, ApJ, 608, 95
- Tavecchio et al. (2000) Tavecchio, F., Maraschi, L., Sambruna, R. M., & Urry, C. M. 2000, ApJ, 544, L23
- Tavecchio et al. (2003) Tavecchio, F., Ghisellini, G., & Celotti, A. 2003, A&A, 403, 83
- Tavecchio et al. (2006) Tavecchio, F., Maraschi, L., Sambruna, R. M., Gliozzi, M., Cheung, C. C., Wardle, J. F. C., & Urry, C. M. 2006, ApJ, 641, 732
- Tornikoski et al. (2001) Tornikoski, M., Jussila, I., Johansson, P., Lainela, M., & Valtaoja, E. 2001, AJ, 121, 1306
- Uchiyama et al. (2006) Uchiyama, Y., et al. 2006, ApJ, 648, 910
- Weisskopf et al. (2002) Weisskopf, M. C., Brinkman, B., Canizares, C., Garmire, G., Murray, S., & Van Speybroeck, L. P. 2002, PASP, 114, 1
- Worrall et al. (2001) Worrall, D. M., Birkinshaw, M., & Hardcastle, M. J. 2001, MNRAS, 326, L7
| Program | Obs. Date | Config. | Freq. | Integ. | Beamsize | rms | Dynamic |
|---|---|---|---|---|---|---|---|
| Time | Range | ||||||
| (GHz) | (hr) | (mJy beam-1) | |||||
| AH730 | 2001 Feb 6 | BnA | 1.4 | 2.1 | 2.71” 1.62” at PA=84.4 deg | 0.30 | 18,000 |
| 8.5 | 3.4 | 0.63” 0.37” at PA=77 deg | 0.053 | 65,000 | |||
| 2001 Jun 18 | CnB | 4.9 | 2.6 | 2.77” 1.66” at PA=84 deg | 0.12 | 33,000 | |
| AC779 | 2005 May 10 | B | 8.5 | 6.25 | 0.7” 0.7” | 0.04 | 81,000 |
Notes: The beamsizes indicate the FWHM of the major and minor axes of the elliptical Gaussian restoring beam used in the images (Figures 6, 7 & 8).
| Da | Countsb | Netb | F(0.5-2 keV)c | F(2-10 keV)b | S(1.4)d | S(5)d | S(8.5)d | |||
|---|---|---|---|---|---|---|---|---|---|---|
| I | 3.8 | 475±22 | 323.6±25.1 | 0.67 | 7.9±0.6 | 16.8±1.3 | 2.2±1.0 | |||
| O | 7.3 | 118±11 | 89.9±12.1 | 0.69 | 2.2±0.3 | 4.6±0.6 | 2.5±0.3 | |||
| A | 11.2 | 156±12 | 132.7±13.4 | 0.66 | 3.2±0.3 | 6.8±0.7 | 6.4±0.9 | 1.2±0.2 | 1.32±0.17 | |
| B | 18.6 | 87±9 | 77.35±9.8 | 1.0 | 1.98±0.25 | 2.6±0.3 | 43.2±4.3 | 14.4±1.4 | 8.2±0.8 | 0.91±0.07 |
| C | 28.5 | 40±6 | 20.9±7.7 | 1.2 | 0.57±0.21 | 0.54±0.20 | 53.2±5.3 | 16.7±1.7 | 11.8±1.2 | 0.85±0.08 |
Notes: a D - Distance from the core to the center of the box region measured in arcsec. b Total or Net Counts with energy within 0.3-8 keV c Flux in units of 10-15 erg cm-2s-1; Flux errors based on the counts errors only. d Flux density in mJy (at a given in the parentheses radio frequency are in GHz), estimated for the regions defined by the X-ray features (see Fig.2). The rms in the maps and the beam size is given in Table 1 The size of the regions assumed for extracting the spectra: I:3.4”x1.98”, O:3.1”x2.36”,A:5.12”x2.64”, B:4.41”x2.13”, C:7.03”x5.63”. e Radio spectral index measured between 1.4 and 8.5 GHz.