The Bulge Radial Velocity Assay (BRAVA): I. Techniques and a Rotation Curve
Abstract
We are undertaking a large scale radial velocity survey of the Galactic bulge which uses M giant stars selected from the 2MASS catalog as targets for the CTIO 4m Hydra multi-object spectrograph. The aim of this survey is to test dynamical models of the bulge and to quantify the importance, if any, of cold stellar streams in the bulge and its vicinity. Here we report on the kinematics of a strip of fields at and . We construct a longitude-velocity plot for the bulge stars and the model data, and find that contrary to previous studies, the bulge does not rotate as a solid body. From the rotation curve has a slope of roughly and flattens considerably at greater and reaches a maximum rotation of . We compare our rotation curve and velocity dispersion profile to both the self-consistent model of (Zhao, 1996) and to N-body models; neither fits both our observed rotation curve and velocity dispersion profile. The high precision of our radial velocities yields an unexpected result: hints of cold kinematic features are seen in a number of the line of sight velocity distributions.
Subject headings:
Galaxy: bulge – Galaxy: kinematics and dynamics – Stars: late-type – stars:kinematics – techniques: radial velocities1. Introduction
The COBE image of the bulge (Dwek et al., 1995; Binney, Gerhard, & Spergel, 1997) and models of the projected 2 light shows a bar-like structure that is also detected in star counts of red clump stars (Stanek et al., 1997). The anomalously high optical depth of the bulge to microlensing (Alcock et al., 2000) can be explained only by assuming a bar whose major axis extends roughly toward the Sun, thus raising the rate of star-star events (Han & Gould, 2003). Theoretical models of the bulge initially followed axisymmetric models (Kent, 1992) but have graduated to self-consistent rapidly rotating bars (Zhao, 1996; Häfner et al., 2000; Bissantz et al., 2004), with the density and the potential strongly constrained by the observed microlensing rates in the bulge as well as gas kinematics. However, the phase space of the bar is relatively incompletely constrained by stellar kinematic data.
Study of the kinematics of the bulge is complicated by the large and variable foreground extinction, the presence of a contaminating disk population extending from the foreground well into the Galactic Center, and source confusion arising from the high density of stars. Positional measurements from wide field Schmidt plates are therefore impossible, where source confusion makes any astrometric exercise daunting.
M giants, while faint in the traditional optical bandpasses due to their cool temperatures and TiO bands, are bright in the band and are easy targets for spectroscopy, if positions are known. They further have the advantage of being ubiquitous throughout the bulge and are luminous enough to be studied even in fields with substantial extinction. Finally, the short lifetimes of AGB stars and luminous giants limit their numbers enough that source confusion is not an issue.
Mould (1983) was the first to measure the velocity dispersion of the bulge in Baade’s Window, based on the M giant sample of Blanco, McCarthy, & Blanco (1984) that was first classified from low dispersion slitless spectra. Multi-fiber spectroscopy of this sample (Sharples, Walker, & Cropper, 1990) subsequently harvested roughly 250 bulge giant velocities. Despite numerous investigations of the dynamics of stars in the direction of Baade’s Window (Mould, 1983; Rich, 1990; Sharples, Walker, & Cropper, 1990; Sadler, Rich, & Terndrup, 1996) and in other bulge fields (Tyson & Rich, 1991; Minniti et al., 1992; Minniti, 1996; Blum et al., 1994, 1995) there has been, up to now, no large scale survey of the dynamics of the stellar population in the bulge. Beaulieu et al. (2000) survey the planetary nebula population; both the rarity of PNe (due to their brief lifetimes), the problem of disk or bulge membership, and the considerable distance uncertainty make PNe a problematic population; We believe a well selected sample of M giants is likely the best probe of the bulge/bar population.
Frogel & Whitford (1987) showed that the M giant luminosity function is consistent with an old population roughly the age of the halo and globular clusters. The first detailed abundance analysis of M giants (Rich & Origlia, 2005) finds an abundance range similar to that of the K giants (McWilliam & Rich, 1994; Fulbright et al., 2006). In principle, the most metal-poor component of the bulge population might not evolve through the M giant phase as the K giant abundance distribution is peaked at slightly sub-solar metallicities, but most of the stars are more metal-rich than 47 Tuc (at dex) and are therefore candidates to reach the luminosities and effective temperatures characteristic of the M giants (Zoccali et al., 2003).
The proper motion study of Sumi et al. (2004) addresses a number of fields in the bulge (avoiding high extinction) and eventually, a second epoch of 2MASS imaging would provide proper motions for large numbers of giants. However, the addition of radial velocities and ultimately metal abundances, is needed for a complete dynamical model and the M giant population provides the perfect sample of stars to target.

The dynamical model for the bulge/bar has a number of important implications. Large samples of uniform radial velocity data are still of great value in constraining the bar vs. axisymmetric models, and the nature of the orbit families supporting the bar. Further, the interpretation of the microlensing events in the bulge depends on the use of an accurate dynamical model (Han & Gould, 2003). The recent discovery of planetary transit host stars in the bulge (Sahu et al., 2006) gives an additional incentive to improve our knowledge of the bulge/bar model.
With the availability of the Two Micron All-Sky Survey 2MASS (Skrutskie et al., 2006) we realized that the key ingredients of high precision positions and photometry would finally be available everywhere in the Galactic bulge except near the plane of the Galaxy. At this time, we present spectra and have obtained a radial velocity precision of for our most recent (2006) data.
In the past, optical radial velocity studies in the bulge have not emphasized high precision, because of the large velocity dispersion and the expectation that the short orbital periods would phase-wrap any cold structures out of existence in well under a Gyr. Yet our precision is sufficient to enable a search for more cold streams analagous to those associated with the Sagittarious dwarf spheroidal galaxy; some candidate cold features are seen and followup observations are underway (Reitzel et al. 2007 in prep.). Here we report on the kinematics of stars along a band at , obtaining a rotation curve and velocity dispersion profile.
2. Observations and Sample Selection
The choice for optical spectroscopy is driven by the availability of multi-object wide field spectroscopy. IR spectroscopy, such as that of Blum et al. (1995), can be used to great effect in the fields of highest reddening but obviously yields far fewer spectra. Here we present a brief sketch of the selection method and analysis; full details will be given in Howard et al.(2007 in prep).
We use the survey method of Sharples, Walker, & Cropper (1990) as the model for our program. They observe that stars with have a lower velocity dispersion and are likely disk members. When the same field is examined in 2MASS, the vs CMD shows a clearly defined red giant branch. In the SCW90 field, we find that the magnitude limit of corresponds roughly to . Further, there is break in the luminosity function at this magnitude (Frogel & Whitford, 1987). While a few bulge AGB members may be present at brighter magnitudes, the bulk of such bright stars will be foreground contaminants. We adopt a range of as the basis for selecting the 2MASS M giants (Figure 1).
A parallelogram-shaped selection region is adjusted in color and magnitude to encompass completely the red giant branch locus of old stars at the distance and reddening of the field as indicated by the reddening map of Schlegel et al. (1998). We find that reddening varies greatly, ranging from . In fields with high extinction, differential reddening is an issue and we widen the selection region to accommodate the red giant branch as observed (Figure 1). The indicated isochrones show that we admit stars with [Fe/H] a range that spans the entirety of the Zoccali et al. (2003) abundance distribution
2.1. Spectroscopy


We use the Hydra multi-fiber spectrograph at the cassegrain focus of the Blanco 4m telescope at Cerro Tololo. We optimize for spectroscopy in the red, taking advantage of the red colors of M giants and employ the KPGLD grating, blazed at 8500Å giving 0.45Å with 2-pixel on-chip binning yielding an effective resolution of 0.88Å and a full spectra range of 1800Å. We use the slit plate, giving us an increase in resolution; the loss of light from the slit plate is inconsequential to our S/N because the stars are so bright. Our useful spectral range in 2006 was 6891Å to 8714Å; the first two lines of the infrared triplet are often well detected and contribute to our success in obtaining a correlation peak. However, there are also stars that are so red that the Ca triplet is overwhelmed by TiO absorption; in these cases, the wide wavelength range is essential for the velocity measurement. Our exposures are typically but longer exposures were needed when cirrus was present. Each field has on average, 108 successfully exposed M giants and 20 fibers that are used to obtain a sky background spectrum. Flat fielding, sky subtraction, throughput correction, scattered light subtraction, and wavelength calibration for each exposure were all accomplished using the IRAF task dohydra. The spectra are binned to 34.3 and normalized. Radial velocities are measured using the fxcor task in IRAF; this requires the spectra to be Fourier filtered exclude features greater than 50 pixels or smaller than 3 pixels in extent. Regions of the spectrum with obvious telluric features were excluded, leaving only 60% of the spectrum usable for cross correlation. Our final cross correlation regions are 7000-7150Å, 7300-7580Å, 7700-8100Å, and 8300-8600Å.
3 standard stars are all used in the cross correlation, with the final velocity for any given star being the average of the 3 derived velocities. The three standards return velocities that agree to within on average, with a standard deviation of in these differences.
We report radial velocities for a total of 2294 M giants. Here we consider the fields spanning across . We compare our observed velocities and velocity dispersion with those predicted by the self consistent rotating bulge/bar model of Zhao (1996).
3. The Rotation Curve and Velocity Dispersion profile
We now discuss the results from our study, beginning with the minor axis velocity dispersion (Figure 2) resulting from the sum of all fields on the minor axis at to as well as three examples of the fields that went into the summed distribution. The best fit Gaussian to the data gives with . A number of peaks are present in this histogram; these are prominent in the contributing histograms (Figure 2a-c). A comparison with the equivalent region extracted from the Zhao (1996) model is also shown; the agreement is very good, but the velocities in the data appear to be more clumpy than they are in the model. More striking peaks are are found in some of our other fields, but because such features can occur in random draws, new observations are required for confirmation (Reitzel et al. 2007).
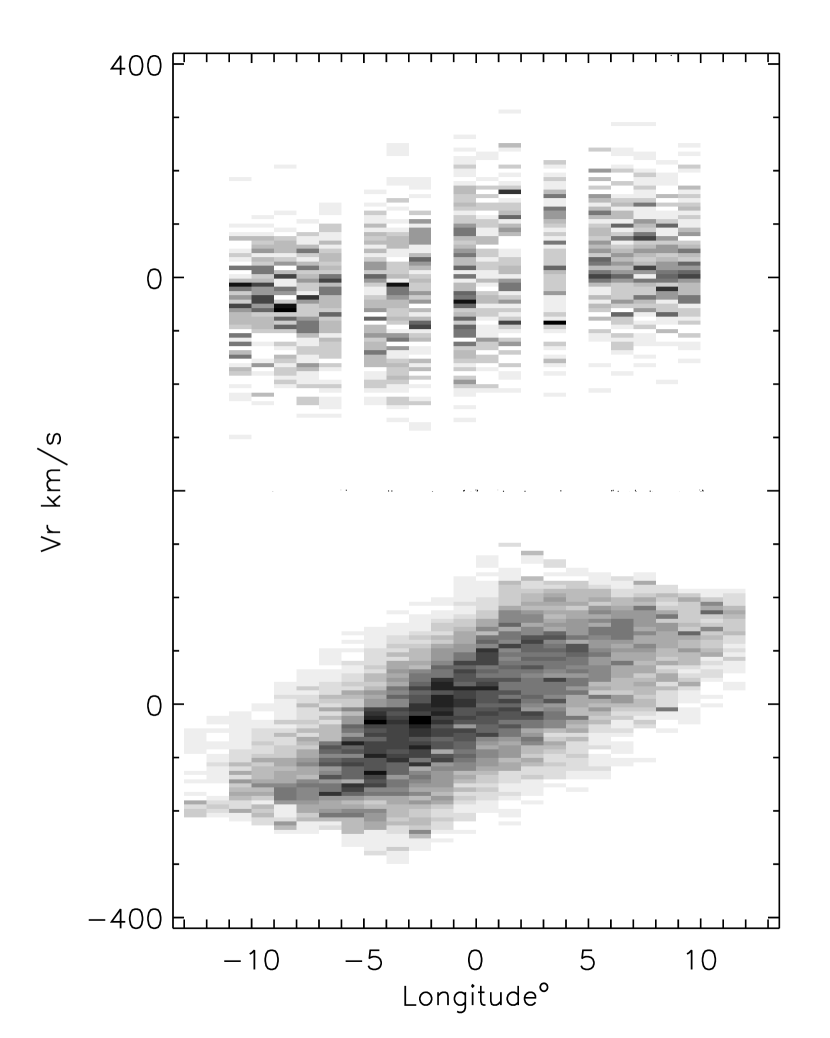
Figure 3a,b shows our rotation curve and velocity dispersion profile compared with that predicted by Zhao (1996); we give the data in Table 1. We do not confirm the solid body rotation claimed by a number of previous studies; after reaching an amplitude of , the rotation curve flattens beyond . The velocity dispersion profile remains higher than even for the fields at . We compare our data with the planetary nebulae (PNe)from (Beaulieu et al., 2000). In order to have a reasonable number of PNe, we have accepted those in the range and we have binned the data. Considering the less secure distances and assignment of population for the PNe, the agreement is good, and settles the question of solid body rotation for the bulge. The Zhao (1996) model is a self-consistent rapidly rotating bar that is constrained to have no retrograde orbits. Also plotted are the N-body bars of Fux (1997) and Sellwood (1993), both of which are N-body bars formed from initially unstable disks. Sellwood’s bar starts from a rigid Plummer sphere with a live Kuzmin disk, with mass ratio 3:7 and no dark matter. Fux’s bar starts from an equilibrium of dark halo, power law nucleus, and an exponential disk; in contrast to the Zhao model that is fit to the data, a best-fit model is selected from a large number of N-body realizations.
We adopt the bar angles and mass normalisations as suggested by Beaulieu et al. (2000) that give an overall good match with the appearance of the COBE map. We project these models and calculate the velocity moments in each line of sight without distinguishing disk and bulge particles. Neither model is satisfactory: Fux’s best model gives a remarkably good fit to the rotation curve but has too low . Sellwood’s bar appears to have a very high . It appears that our data is challenging to fit by both disk-instability formed bars as well as Schwarzschild models with fixed potentials.
In Figure 4, we compare the Zhao (1996) model in longitude-velocity space with our radial velocities, both sampling the slice at ; we have smoothed the data in longitude by and in velocity. The addition of retrograde orbits may improve the agreement of the model and data; we are working toward this end (Zhao et al. 2007 in prep.).
While our claim of slower rotation for the bulge appears to contradict earlier studies, we emphasize our agreement with the PNe. It is also interesting that the kinematics of K giants in the field of Minniti et al. (1992) agrees with our rotation curve (44.5 ); faster rotation (and a lower velocity dispersion) is observed in his but that field that might be disk dominated. Menzies (1990) used a small number of Miras to sample velocities over a wide range in longitude, and found rapid solid body rotation. Small numbers, or contamination by members of the disk, might be invoked to explain the more rapid rotation observed for SiO masers (Izumiura et al., 1995).
Our data are clearly at odds with the widely held view that the bulge rotates as a solid body. The relatively high velocity dispersions of our fields is reassuring in the sense that the M giant selection criterion is yielding good kinematic probes of the bulge/bar population. Extending this survey to a larger number of fields in the bulge offers the possibility of undertaking detailed tests of dynamical models, something that is not presently possible in distant galaxy populations. This will give new insights into the structure and dynamics of the bulge, and into the formation of the Milky Way.
References
- Alcock et al. (2000) Alcock, C. et al. 2000, ApJ, 541, 734
- Babusiaux & Gilmore (2005) Babusiaux, C., & Gilmore, G. 2005, MNRAS, 358, 1309
- Beaulieu et al. (2000) Beaulieu, S., Freeman, K.C., Kalnajs, & Saha, P. 2000, AJ, 120, 85
- Binney, Gerhard, & Spergel (1997) Binney, J., Gerhard, O., & Spergel, D. 1997 MNRAS, 288, 36
- Bissantz et al. (2004) Bissantz, N., Debattista, V. P., & Gerhard, O. 2004, ApJ, 601, L155
- Blanco, McCarthy, & Blanco (1984) Blanco, V.M., McCarthy, M.F., & Blanco, B.M. 1984,AJ,89,636
- Blanco (1987) Blanco, V.M. 1987, AJ, 93, 321
- Blanco (1988) Blanco, V.M. 1988, AJ, 95, 1400
- Blanco (2001) Blanco, V.M. 2001, ARA&A, 39, 1
- Blum et al. (1994) Blum, R. D., Carr, J. S., Depoy, D. L., Sellgren, K., & Terndrup, D. M. 1994, ApJ, 422, 111
- Blum et al. (1995) Blum, R. D., Carr, J. S., Sellgren, K., & Terndrup, D. M. 1995, ApJ, 449, 623
- Dwek et al. (1995) Dwek, E. et al. 1995 ApJ, 445, 716
- Frogel & Whitford (1987) Frogel, J.A., & Whitford, A.E. 1987, ApJ, 320, 199
- Fulbright et al. (2006) Fulbright, J. P., McWilliam, A., & Rich, R. M. 2006, ApJ, 636, 821
- Fux (1997) Fux, R. 1997, A&A, 327, 983
- Girardi et al. (2002) L. Girardi, G. Bertelli, A. Bressan, C. Chiosi, M.A.T. Groenewegen, P. Marigo, B. Salasnich, and A. Weiss, 2002, å, 391, 195.
- Häfner et al. (2000) Häfner, R., Evans, N. W., Dehnen, W., & Binney, J. 2000, MNRAS, 314, 433
- Han & Gould (2003) Han, C., & Gould, A. 2003, ApJ, 592, 172
- Izumiura et al. (1995) Izumiura, H., Deguchi, S., Hashimoto, O., Nakada, Y., Onaka, T., Ono, T., Ukita, N., & Yamamura, I. 1995, ApJ, 453, 837
- Kent (1992) Kent, S.M. 1992, ApJ, 387, 181
- McWilliam & Rich (1994) McWilliam, A., & Rich, R. M. 1994, ApJS, 91, 749
- Menzies (1990) Menzies, J. W. 1990, Workshop on Bulges of Galaxies, 115
- Minniti et al. (1992) Minniti, D., White, S. D. M., Olszewski, E. W., & Hill, J. M. 1992, ApJ, 393, L47
- Minniti (1996) Minniti, D. 1996, ApJ, 459, 175
- Mould (1983) Mould, J.R. 1983, AJ, 273, 530
- Rich (1990) Rich, R. M. 1990, ApJ, 362, 604
- Rich & Origlia (2005) Rich, R. M., & Origlia, L. 2005, ApJ, 634, 1293
- Sadler, Rich, & Terndrup (1996) Sadler, E., Rich, R.M., & Terndrup, D.M. 1996, AJ, 112, 171
- Sahu et al. (2006) Sahu, K. C. et al. 2006, Nature, 443, 534
- Schlegel et al. (1998) Schlegel, D. J., Finkbeiner, D. P., & Davis, M. 1998, ApJ, 500, 525
- Sellwood (1993) Sellwood, J. A. 1993, AIP Conf. Proc. 278: Back to the Galaxy, 278, 133
- Sharples, Walker, & Cropper (1990) Sharples, R., Walker, A. & Cropper, M., 1990,MNRAS, 246, 54
- Skrutskie et al. (2006) Skrutskie, M.F. et al. 2006, AJ, 131, 1163
- Stanek et al. (1997) Stanek, K. Z., Udalski, A., Szymanski, M., Kaluzny, J., Kubiak, M., Mateo, M., & Krzeminski, W. 1997, ApJ, 477, 163
- Sumi et al. (2004) Sumi, T. et al. 2004,MNRAS, 348, 1439
- Tyson & Rich (1991) Tyson, N.D., & Rich, R.M. 1991, ApJ, 367, 547
- Zhao (1996) Zhao, H.S. 1996, MNRAS, 283, 149
- Zoccali et al. (2003) Zoccali, M., et al. 2003, A&A, 399, 931
| l | b | RA (J2000.0) | DEC J2000.0) | N | err() | err() | ||
|---|---|---|---|---|---|---|---|---|
| (degrees) | (degrees) | (hh:mm:ss.s) | (∘:′:′′) | () | () | () | () | |
| -9.98 | -3.99 | 17:36:31.47 | -39:30:42.9 | 93 | -60.8 | 7.5 | 72.1 | 5.3 |
| -9.01 | -4.00 | 17:39:10.83 | -38:41:41.7 | 101 | -33.4 | 7.5 | 74.9 | 5.3 |
| -7.98 | -4.00 | 17:41:56.69 | -37:49:13.2 | 101 | -46.3 | 7.5 | 75.7 | 5.3 |
| -6.98 | -3.99 | 17:44:33.22 | -36:57:55.3 | 103 | -61.3 | 8.5 | 85.9 | 6.0 |
| -6.00 | -3.99 | 17:47:03.54 | -36:07:46.5 | 105 | -42.8 | 8.5 | 87.0 | 6.0 |
| -3.99 | -3.98 | 17:52:02.74 | -34:24:11.0 | 108 | -44.6 | 9.3 | 96.4 | 6.6 |
| -3.01 | -3.99 | 17:54:26.79 | -33:33:26.6 | 111 | -45.7 | 10.5 | 111.0 | 7.5 |
| -1.99 | -3.98 | 17:56:50.87 | -32:40:49.5 | 108 | -25.3 | 10.1 | 104.8 | 7.1 |
| -0.02 | -3.99 | 18:01:28.27 | -30:58:18.6 | 110 | -14.7 | 10.8 | 112.8 | 7.6 |
| 1.04 | -3.95 | 18:03:43.51 | -30:01:49.9 | 73 | -1.1 | 12.9 | 110.2 | 9.1 |
| 2.00 | -4.00 | 18:06:02.64 | -29:13:17.4 | 109 | 29.0 | 11.0 | 115.2 | 7.8 |
| 3.99 | -3.98 | 18:10:19.36 | -27:28:32.3 | 106 | 29.0 | 10.2 | 105.2 | 7.2 |
| 6.01 | -3.99 | 18:14:40.05 | -25:42:06.9 | 108 | 49.3 | 8.5 | 88.3 | 6.0 |
| 6.99 | -3.96 | 18:16:34.61 | -24:49:41.9 | 104 | 29.8 | 9.2 | 94.2 | 6.5 |
| 7.99 | -3.99 | 18:18:44.88 | -23:57:51.7 | 107 | 44.0 | 8.5 | 88.2 | 6.0 |
| 9.01 | -3.98 | 18:20:47.51 | -23:03:31.1 | 104 | 20.1 | 7.2 | 73.9 | 5.1 |
| 10.00 | -3.99 | 18:22:50.13 | -22:11:12.6 | 106 | 34.4 | 8.2 | 84.0 | 5.8 |