SWIFT observations of TeV BL Lac objects
Abstract
Context. We present the results of a set of observations of nine TeV detected BL Lac objects performed by the and detectors on board the satellite between March and December 2005.
Aims. We are mainly interested in measuring the spectral parameters, and particularly the intrinsic curvature in the X-ray band.
Methods. We perform X-ray spectral analysis of observed BL Lac TeV objects using either a log-parabolic or a simple power-law model .
Results. We found that many of the objects in our sample do show significant spectral curvature, whereas those having the peak of the spectral energies distribution at energies lower than 0.1 keV show power law spectra. In these cases, however, the statistics are generally low thus preventing a good estimate of the curvature. Simultaneous observations are important to verify how X-ray spectra can be extrapolated at lower frequencies and to search for multiple emission components.
Conclusions. The results of our analysis are useful for the study of possible signatures of statistical acceleration processes predicting intrinsically curved spectra and for modelling the SED of BL Lacertae objects up to TeV energies where a corresponding curvature is likely to be present.
Key Words.:
radiation mechanisms: non-thermal - galaxies: active - galaxies: BL Lacertae objects, X-rays: galaxies: individual: Mkn 421, 1H 1100230, 1ES 1218+304, H 1426+428, 1ES 1553+113, 1ES 1959+650, PKS 2005489, PKS 2155304, 1ES 2344+514P. Giommi: paolo.giommi@asdc.asi.it
1 Introduction
All blazars detected at TeV energies are nearby High energy peaked BL Lacs (HBL), that is objects with the synchrotron peak in their Spectral Energy Distribution (SED) close to or within the X-ray band (Padovani & Giommi (1995)). The simultaneous study of these sources at TeV and X-ray energies is very important to test the spectral and flux correlations predicted by emission models, in particular the Synchrotron Self Compton (SSC) scenario.
The energy distribution of the synchrotron component in the vs. diagram is generally characterized by a rather smooth broad curvature which can be represented by a logarithmic parabola (e.g. Landau et al. 1986, Massaro et al. 2004a,b). In a recent work on the relations between the parameters of synchrotron and inverse Compton radiation in the SSC scenario applied to Mkn 501, (Massaro et al. 2006) showed that the intrinsic X-ray spectral curvature results in curved TeV spectra.
In this paper we present the results of a number of Swift (Gehrels et al. (2004))
observations of a sample of eight TeV BL Lac objects performed between
March and December 2005 using the XRT (Burrows et al. (2005)) and
(Roming et al. (2005)) telescopes.
We found that some of these objects exhibit a remarkable X-ray spectral
curvature in agreement with previous BeppoSAX results (Massaro et al. 2004a , Massaro et al. 2004b , Costamante et al. (2001), Tagliaferri
et al. 2003).
A recent analysis on XMM-Newton X-ray data of thirteen HBL sources
(Perlman et al. 2005) also found evidence for significant intrinsic
curvature.
Simultaneous UV and X-ray observations are important to extend the frequency window and to search for the existence of single and multiple non-thermal components. Under this respect Swift observations provide a unique opportunity for broad-band studies of this class of non-thermal sources. The present analysis is of crucial importance to measure the intrinsic X-ray spectral curvature, and is devoted to the presentation of new UV-X-ray observations of a sample of BL Lac objects and to their spectral analysis.
2 Swift observations and data reduction
We present results concerning Swift pointings performed between March and December 2005. The satellite operated with all the instruments in data taking mode but here we only consider and data because our sources were not detected by the high energy experiment (Barthelmy et al. (2005)). In addition, we excluded from our analysis all observations for which the total number of net counts in the was not sufficient for a reliable estimate of the spectral parameters, e.g. exposures shorter than 1000s etc. The log of X-ray observations is reported in Table 1.
2.1 XRT data
All the data were reduced using the software (version v1.8.0) developed at the ASI Science Data Center (ASDC) and distributed within the HEASOFT 6.0.5 package by the NASA High Energy Astrophysics Archive Research Center (HEASARC).
The operational mode of XRT is automatically controlled by the on-board software that uses the appropriate CCD readout mode to reduce or eliminate the effects of photon pile-up. When the target count-rate is higher than 1 cts/s the system is normally operated in Windowed Timing (WT) mode whereas the Photon Counting (PC) mode is used for fainter sources (for details of the observing modes see Burrows et al. (2005) and Hill et al. (2004)). For our analysis we selected photons with grades in the range 0–12 for PC mode and 0–2 for WT mode; we also used default screening parameters to produce level 2 cleaned event files. We found that in several cases some pile-up is nevertheless present in PC mode. In these cases we excluded the internal part of the Point Spread Function (PSF) in the event selection. More specifically, spectral data collected in the PC mode were extracted in an annular region with an outer radius of 30 pixels while the inner radius was chosen according to the prescription of Moretti et al. (2005). Spectra were binned to ensure a minimum of 20 counts per bin.
A residual feature at 0.5 keV, is still present in the best XRT calibration available today (Campana et al. 2006). To avoid artificially high values and possible biases in spectral parameter estimation, in accordance with the XRT calibration experts, we decided to exclude from our analysis the energy channels between 0.4 keV and 0.6 keV (Campana & Cusumano 2006, private communication). The corresponding background was estimated in a nearby source-free circular region having a radius of 35 pixels.
| Object | Date | Start UT | Exp. | XRT Mode |
|---|---|---|---|---|
| h m | s | |||
| 1H 1100230 | Jun 30 | 00:08 | 8521 | PC |
| Jul 13 | 14:19 | 2264 | PC | |
| Nov 04 | 20:34 | 1164 | PC | |
| Nov 14 | 14:47 | 554 | PC | |
| Mkn 421 | Mar 01 | 01:13 | 7134 | WT |
| Mar 31 | 00.58 | 6958 | WT | |
| Apr 01 | 04:08 | 2465 | WT | |
| Apr 29 | 17:45 | 2126 | WT | |
| May 03 | 05:04 | 318 | WT | |
| Jul 07 | 19:36 | 2775 | WT | |
| Oct 04 | 04:19 | 8063 | WT/PC | |
| Nov 06 | 02:49 | 1126 | WT/PC | |
| 1ES 1218+304 | Oct 30 | 21:18 | 2013 | PC |
| Oct 31 | 19:49 | 3701 | PC | |
| H 1426+428 | Mar 31 | 00:02 | 2935 | WT/PC |
| Apr 02 | 17:59 | 4646 | WT/PC | |
| Jun 19 | 04:56 | 21373 | PC | |
| Jun 25 | 05:54 | 21203 | WT/PC | |
| 1ES 1553+113 | Apr 20 | 03:37 | 5188 | PC |
| Oct 06 | 01:16 | 10802 | WT/PC | |
| Oct 07 | 23:32 | 10718 | WT/PC | |
| 1ES 1959+650 | Apr 19 | 00:21 | 4437 | WT |
| PKS 2005489 | Mar 31 | 00:06 | 2215 | WT |
| Apr 05 | 00:38 | 8654 | WT/PC | |
| Apr 06 | 00:45 | 19246 | WT/PC | |
| PKS 2155304 | Nov 17 | 19:22 | 1166 | WT/PC |
| 1ES 2344+514 | Apr 19 | 00:30 | 4665 | PC |
| May 19 | 16:10 | 4039 | PC | |
| Dec 03 | 00:10 | 12204 | PC |
2.2 UVOT data
A variety of filter combinations and data modes are available for observations. For fields without bright stars, that is stars bright enough to degrade the detector, the most commonly-used mode observes in six photometric bands: , , and three ultraviolet. In some cases our target was quite bright and saturated the image in all the photometric bands. For this reason not all the optical and UV data could be used for our analysis. The list of all available observations is given in Table 2.
We performed the photometric analysis using a standard tool in HEASOFT 6.0.5. Counts were extracted from a 6′′ radius aperture in the , , and filters and from a 12′′ radius aperture for the other UV filters (, , and ), to properly take into account the wider PSF in these bandpasses. The count rate was corrected for coincidence loss and the background subtraction was performed by estimating its level in an offset region at 20′′ from the source. The estimate of flux uncertainties is complex due to possible instrumental systematics (e.g. residual pile-up in the central region of the PSF) and calibration: in particular, the lack of reference stars in the UV bandpasses. In this paper we adopt the conservative approach to consider a typical uncertainty of 8% for the filters, and of 15% in the UV band.
The correction for the interstellar reddening was obtained assuming the values at the source direction taken from NED and listed in Table 2; the fluxes were derived with the same conversion factors given by Giommi et al. (2006).
| Object | Date | Start UT | |
|---|---|---|---|
| h m | |||
| 1H 1100230 | Jun 30 | 00:06 | 0.059 |
| Jul 13 | 14:19 | ||
| Nov 04 | 20:34 | ||
| Nov 14 | 14:47 | ||
| H 1426+428 | Mar 30 | 23:59 | 0.012 |
| Apr 02 | 17:58 | ||
| Jun 19 | 06:58 | ||
| Jun 25 | 05:58 | ||
| 1ES 1553+113 | Apr 20 | 03:37 | 0.052 |
| Oct 06 | 01:16 | ||
| Oct 07 | 23:32 | ||
| 1ES 1959+650 | Apr 19 | 01:03 | 0.177 |
| 1ES 2344+514 | Apr 19 | 01:12 | 0.216 |

3 Spectral analysis and results
For all the sources the spectral analysis was performed with the absorbing column densities fixed to the Galactic values and using two models for the photon flux:
a simple power law (PL)
| (1) |
and a log-parabolic law (LP)
| (2) |
where is the spectral slope (given by the log-derivative) at 1 keV and measures the spectral curvature. An equivalent functional relationship, useful to obtain independent estimates of and the peak energy in the Spectral Energy Distribution (SED, ), is (LPS):
| (3) |
where .
Eq.(2) was used when the residuals with respect to the power law best fits showed significant systematic deviations, indicating an intrinsic curvature: as an example the spectral data of Mkn 421 are shown in Fig.1. Typically, such deviations from a simple power law were found in the long exposures where the total counting statistics were high enough for a good description of the spectral shape. In these cases the use of the LP law improved significantly the and eliminated the model systematics of the residuals.
In principle there are several possible curved models that could give acceptable fits to the data. For this analysis we apply the LP model for the following reasons: ) BeppoSAX spectral analysis of several blazars has shown that this model describes the well data over a range from keV up to 100 keV (Massaro et al. 2004a , Massaro et al. 2004b , Giommi et al. (2005) Donato et al. (2005)); ) log-parabola is the simplest analytical law to describe a continuous curvatures and, in particular, it implies a linear relation between the spectral slope and the logarithm of energy; ) this spectral distribution is based on a physical interpretation in terms of statistical acceleration of the emitting particles ( Massaro et al. 2004a ,Massaro et al. (2006)); ) the curvature parameter allows to compare the spectral evolution of the sources in a homogeneous way; this comparison would result more complex if the curvature is described by two or more parameters.
An alternative possibility that would probably give technically acceptable fits in the limited XRT energy range is to allow to be a free parameter .
We verified that in some sources a PL best fit with a free absorbing column yields values well in excess of the galactic ones and significantly variable over time scales as short as one day. Such a variation is,however, unlikely for absorbing columns distributed over large distances. Moreover a large intrinsic absorption in the X-rays would imply a strong extinction in the UV band in contrast with the UVOT data reported below.
A summary of the results of this spectral analysis is reported in Table 3, for the sources for which we applied the LP model (or LPS for a direct estimate of ), and in Table 4 for the sources for which the PL gave acceptable fits. For the few observations in which very low best fit curvatures were obtained the spectral parameters are given in both Tables 3 and 4.
In the following we present our results for each source.
3.1 1H 1100230
At =0.186, 1H 1100230 is one of the farthest TeV BL Lac objects. This source was observed by BeppoSAX twice in 1997 and 1998 and showed a stable curvature , although its flux, SED peak position, and spectral slope at 1 keV were found to be variable. In the two states the 2–10 keV flux changed from 2.5 to 3.7erg cm-2 s-1, moved from to and from 1.5 to 4.6 keV, respectively (Giommi et al. (2005)). The source was observed by H.E.S.S. in 2004 and 2005. (Aharonian et al. 2006a ) and its TeV spectrum, after the correction for pair production absorption, showed an intrinsic photon index around the rather flat value of 1.5 when using a low intensity EBL model. Our analysis of Swift data shows a significant spectral curvature only during the longest observation on June 30, with a value of , which is statistically consistent with those found by BeppoSAX and XMM-Newton (Perlman et al. 2005). The much shorter observation on July 13 is compatible with a low curvature spectrum, and the PL fit gave a good (see Table 4). In the other two pointings of November 2005 the statistics were too low to measure any spectral curvature.
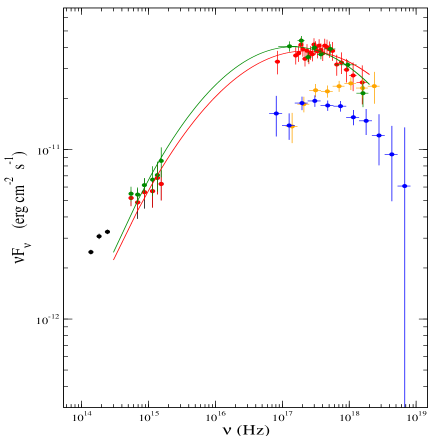
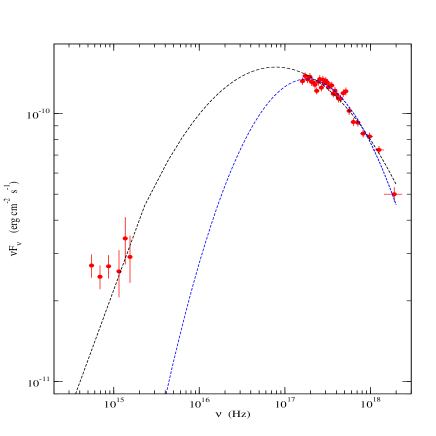
The 2–10 keV flux was remarkably stable during all the pointings, around the value of 4erg cm-2 s-1. The source was detected by UVOT and the optical-UV photometry on June 30 and July 13 gives the flux values reported in Table 5. Fig. 2 shows the SED of 1H 1100230 from the IR to X-ray band, including literature measurements and BeppoSAX data from Giommi et al. (2005). Note the very good agreement between optical and UV data at different epochs while X-ray data show a much stronger variability. We found that the low energy extrapolation of the LP law derived only from X-rays generally fails to match UV points, and therefore we fitted simultaneously UVOT and XRT data. The new values of the spectral parameters were different from those obtained from X-ray data only. We verified that these new values were statistically consistent with the XRT data by computing again the keeping and frozen to the new values. These results are also given in Table 3 with the label UV.
3.2 Mkn 421
Mkn 421, one of the nearest BL Lac objects at =0.031, was the first extragalactic source to be detected at TeV energies (Punch et al. (1992)). It shows strong variability both at X-ray and TeV energies, with time scales ranging from less than one hour to years (e.g. Gaidos et al. 1996). Spectral variability was observed in the TeV band by Krennrich et al. (2002) using the Whipple telescope in 2000/2001 who also discovered a correlation between flux and spectral index when averaging the observations over the whole data set. In the X-ray band Mkn 421 shows strong evidence for intrinsic spectral curvature that can be described very well by a LP law (e.g. Massaro et al. 2004a ).
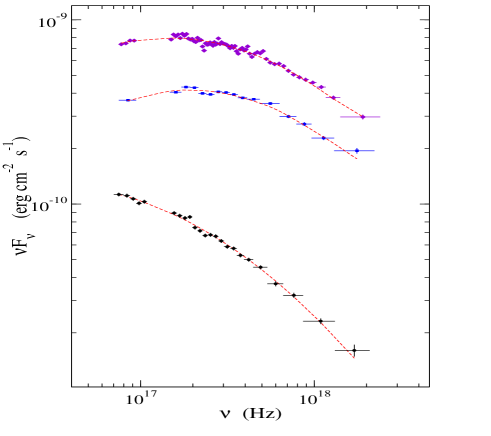
Mkn 421 was observed by Swift eight times from March to November 2005, however, the last two observations were performed mainly in PC mode, and pile-up was too severe for a reliable analysis. Large variations of the 2–10 keV flux, by a factor of about 20, were observed from March to July when it reached the highest level of erg cm-2 s-1; in the two subsequent observations it decreased to 4.5erg cm-2 s-1. In all the observations the spectrum was remarkably curved with ranging from about to ; the peak energy in the SED changed between 0.1 and 0.8 keV. Three SEDs of Mkn 421 are shown in Fig.3, unfortunately UVOT images are saturated and no information on the UV variability related to that observed at X-ray is available.
There is a wide literature on past X-ray observations of this source (e.g. Massaro et al. 2004a, Tanihata et al. 2004 and references therein). In our XRT observations Mkn 421 showed large flux variations that are consistent with historic data. The highest value of flux in the 0.2–10.0 keV band recorded in July 2005 is compatible with those reached on April 2000 (Massaro et al. 2004a), but the curvature is higher with a value of about while in April 2000 it was about . Typical values are different in July 2005 from those of April 2000 was about keV. The description of the dynamic of the X-ray spectral evolution is a complex topic and an exhaustive analysis will be presented in a future paper (Tramacere et al. 2006, in preparation).
3.3 1ES 1218+304
This source (=0.182) has been detected at TeV energies in January 2005 by MAGIC (Albert et al. (2006)). The TeV spectrum is described by a power law with a steep photon index of about , very similar to that found for PKS 2005489 by H.E.S.S. (Aharonian et al. 2005a ). BeppoSAX observed 1ES 1218+304 on 12 July 1999 and found a curvature and a flux about 1.5erg cm-2 s-1(Giommi et al. (2005)).
Swift observed this object in October 2005 and found a flux level similar to that observed by BeppoSAX but the statistics were too low to measure the curvature with a sufficiently small uncertainty. PL best fit indicates a relatively high variation of photon index corresponding to a flux decrease of about 50%.
3.4 H 1426+428
H 1426+428 is one of the most extreme HBL objects: it was observed in February 1999 by BeppoSAX and showed a flat power law spectrum (=0.920.04) which placed the synchrotron peak at energies higher than 100 keV (Costamante et al. (2001)) similar to Mkn 501 and 1ES 2344+514 in high states. At TeV energies it was observed by the CAT telescope during 1998-2000 (Djannati-Ataj et al. (2002)) and no significant evidence of spectral variability has been found (Aharonian et al. (2002)). This source was observed by XMM-Newton in 2001 and Blustin et al. (2004) investigated the presence of intrinsic absorbers using the High Resolution Reflecting Grating Spectrometer (RGS) and did not find evidence for broad absorption features nor for narrow emission and absorption lines. It was also observed in 2002 by RXTE in the 3–24 keV band and showed a significant variability both in flux and spectra (Falcone et. al (2004)). Sometimes these authors observed a spectral index implying a synchrotron peak in excess of 100 keV while at other times they observed the peak in the 2.9–24 keV band.
Swift observed this source four times (see Tab. 1). We fixed to the Galactic value of cm-2, however, leaving it as a free parameter the value returned by the fit was always consistent with that given above. We found evidence for an intrinsic curvature in two cases out of four: on June 19 the source showed a curvature parameter with keV, and on June 25 was and moved to keV. The observation on 31 March 2005 is instead compatible with a PL spectrum with a photon index =; the -test probability for the LP gave a value of about 0.4 and doesn’t help us in choosing between the two spectral models. In this observation the statistics were not rich enough to find the actual position of the peak and one cannot exclude that the SED could rise above 10 keV, but the results of our fit are also consistent with a spectrum with a low curvature of about 0.1–0.2 and the peak around 1–2 keV. Moreover, we also have to take into account that systematic effects due the instrument’s effective area below 2 keV, combined with the effects of the absorption and no firm conclusions can be reached.
The observation on April 2 is similar to that of March 31 but with a better statistics. In this case the source was observed both in PC and WT mode, but due to the poor number of counts of the PC mode, we discuss here the results for the fit of the summed signal of the two modes. We estimated a curvature of for the LP fit and a photon index of 2.050.02 for PL fit: the low value of the -test probability (see Tab.4.), however, suggests that the curved model could give a better description of the data. In this case the peak position derived by a LPS model was keV.
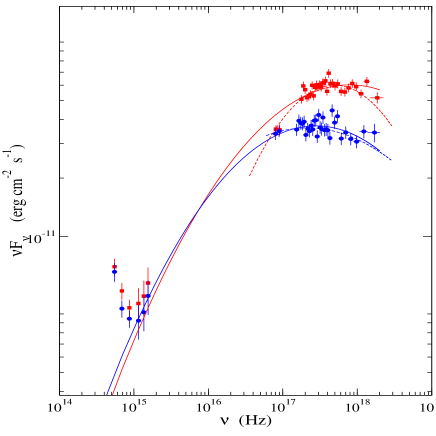
A better determination of the SED is obtained when UVOT data are taken into account (see Fig.4). Note that the optical photometric points ( and ) are dominated by the flux from the host galaxy and that the non-thermal UV flux of H 1426+428 remained substantially stable at variance with the X-ray flux. Therefore, a simultaneous fit in these two bands is not straightforward.
In the June 19 observation we found that LP model can give a good description of the data from UV to the X-rays. We performed a fit on both UVOT and XRT data with a LP (solid line in Fig. 4) and obtained spectral parameters significantly different from those obtained fitting only XRT data (dashed line): the new values are reported in Table 3 with the label UV. On April 02 only a single LP can match approximately both X-rays and UV points: in this case we obtained , consistent with that found for only XRT data () within the statistical errors. The of simultaneous UVOT -XRT fits are also very satisfactory for both observations, confirming that the addition of UV data does not produce inconsistencies. Note, however, that the lowest energy XRT point in the June 19 observation lies significantly below the LP spectrum and is nearly coincident with that of the other pointing. We do not have a simple explanation for this discrepancy: it could simply be a statistical fluctuation, but also an indication of the emerging of another component at energies higher than 1 keV.
| Source/Date | /dof | Flux(2-10 keV) | |||||
| 1020cm-2 | (keV) | erg cm-2s-1 | |||||
| 1H 1100230 | |||||||
| Jun 30 | 5.7 | 1.95(0.03) | 0.40 (0.06) | 2.38(0.04) | 0.95/121 | 1.15(0.09) | 0.44 |
| UV | 2.01 | 0.15 | 2.30(0.03) | 1.13/123 | — | — | |
| Jul 13 | 2.16(0.06) | 0.1 (0.1) | 2.46(0.07) | 0.79/70 | 0.3 (0.4) | 0.42 | |
| UV | 2.08 | 0.17 | 2.40(0.06) | 0.82/72 | — | ||
| Mkn 421 | |||||||
| Mar 01 | 1.61 | 2.58 (0.01) | 0.31(0.03) | 4.35 (0.03) | 1.06/299 | 0.12(0.02) | 0.37 |
| Mar 31 | 2.410(0.008) | 0.35(0.02) | 7.09 (0.04) | 1.097377 | 0.26(0.02) | 0.73 | |
| Apr 01 | 2.201(0.009) | 0.46(0.02) | 18.7 (0.1) | 0.97/396 | 0.60(0.02) | 2.33 | |
| Apr 29 | 2.095(0.008) | 0.44(0.02) | 25.6 (0.1) | 0.97/442 | 0.78(0.02) | 3.76 | |
| May 03 | 2.14 (0.03) | 0.41(0.06) | 15.8 (0.3) | 1.16/169 | 0.67(0.08) | 2.24 | |
| Jul 07 | 2.165(0.005) | 0.37(0.01) | 47.61(0.01) | 1.22/450 | 0.60(0.02) | 6.74 | |
| 1ES 1218+304 | |||||||
| Oct 30 | 1.73 | 1.8 (0.1) | 0.6 (0.2) | 0.17(0.05) | 1.08/32 | 1.5 (0.2) | 0.23 |
| Oct 31 | 2.14(0.06) | 0.3 (0.1) | 1.12(0.04) | 1.09/61 | 0.6 (0.2) | 0.17 | |
| H 1426+428 | |||||||
| Mar 31 | 1.38 | 1.96(0.06) | 0.16(0.1) | 0.67(0.03) | 1.07/70 | 1.3(0.5) | 0.16 |
| Apr 02 | 2.01(0.03) | 0.12(0.06) | 1.48(0.02) | 0.95/215 | 0.8(0.3) | 0.33 | |
| UV | 1.9 | 0.17 | 1.47(0.02) | 0.96/217 | — | ||
| Jun 19 | 1.78(0.02) | 0.34(0.03) | 2.27(0.02) | 0.92/300 | 2.0(0.1) | 0.56 | |
| UV | 1.84 | 0.16 | 2.20(0.02) | 1.03/302 | — | ||
| Jun 25 | 1.89(0.02) | 0.37(0.05) | 1.85(0.02) | 1.15/232 | 1.4(0.05) | 0.38 | |
| 1ES 1553+113 | |||||||
| Apr 20 | 3.67 | 2.25(0.05) | 0.34 (0.09) | 1.60(0.04) | 1.14/100 | 0.4 (0.1) | 0.21 |
| UV | 2.3 | 0.08 | 1.54(0.03) | 1.21/102 | — | ||
| Oct 0 6WT | 2.20(0.02) | 0.32 (0.05) | 4.84(0.07) | 0.98/206 | 0.50(0.09) | 0.69 | |
| UV | 2.16 | 0.08 | 4.36(0.04) | 1.11/208 | — | ||
| Oct 06 PC | 2.14(0.02) | 0.34 (0.05) | 4.57(0.06) | 0.93/229 | 0.61(0.08) | 0.69 | |
| Oct 08 | 2.17(0.02) | 0.23 (0.05) | 4.22(0.06) | 0.89/205 | 0.4 (0.1) | 0.67 | |
| UV | 2.21 | 0.08 | 4.12(0.05) | 0.93/205 | — | ||
| 1ES 1959+650 | |||||||
| Apr 19 | 10.0 | 2.09 (0.02) | 0.46(0.03) | 8.15 (0.06) | 0.98/282 | 0.79(0.05) | 1.17 |
| UV | 2.21 | 0.22 | 8.21 (0.05) | 1.21/284 | —- | ||
| PKS 2005489 | |||||||
| Mar 31 | 5.08 | 2.90(0.03) | 0.27 (0.09) | 1.85(0.04) | 0.94/126 | — | 0.11 |
| PKS 2155304 | |||||||
| Nov 17 | 1.69 | 2.70(0.05) | 0.3 (0.1) | 2.26(0.08) | 0.62/53 | 0.1(0.3) | 0.16 |
(*) estimated from the LPS spectral model
| Source/Date | /dof | P(-test) | Flux(2-10 keV) | |||
|---|---|---|---|---|---|---|
| 1020cm-2 | PL | erg cm-2s-1 | ||||
| 1H 1100230 | ||||||
| Jul 13 | 5.7 | 2.03(0.04) | 2.46(0.07) | 0.81/71 | 0.187 | 0.44 |
| Nov 04 | 2.15(0.07) | 2.0(0.1) | 1.10/25 | 0.42 | ||
| Nov 14 | 2.1(0.1) | 1.6(0.1) | 1.13/15 | 0.41 | ||
| 1ES 1218+304 | ||||||
| Oct 30 | 1.73 | 2.00(0.06) | 1.11(0.05) | 1.25/33 | 0.032 | 0.19 |
| Oct 31 | 2.23(0.04) | 1.06(0.03) | 1.20/62 | 0.016 | 0.29 | |
| H 1426+428 | ||||||
| Mar 31 | 1.38 | 2.01(0.05) | 0.66(0.02) | 1.08/71 | 0.421 | 0.17 |
| Apr 02 | 2.05(0.02) | 1.45(0.03) | 0.97/216 | 0.03 | 0.35 | |
| PKS 2005489 | ||||||
| Apr 05 | 5.08 | 3.16(0.02) | 1.19(0.04) | 0.84/200 | 0.06 | 0.06 |
| Apr 06 | 3.05(0.02) | 0.99(0.02) | 0.82/217 | 0.06 | 0.06 | |
| 1ES 2344+514 | ||||||
| Apr 19 | 16.3 | 2.35(0.06) | 0.74(0.03) | 0.68/48 | 0.11 | |
| May 19 | 2.18(0.08) | 0.67(0.05) | 0.73/27 | 0.13 | ||
| Dec 12 | 2.32(0.05) | 0.60(0.25) | 0.83/65 | 0.09 |
3.5 1ES 1553+113
This object was detected for the first time at TeV energies in 2005 by H.E.S.S. (Aharonian et al. 2006b ). Its redshift is unknown but recently Sbarufatti et al. (2006) estimated a lower limit 0.09 1ES 1553+113 was observed by BeppoSAX on 05 February 1998, and showed a strong spectral curvature with = and a 2–10 keV flux of erg cm-2 s-1.
We report here the results of three Swift observations performed in April and October 2005. In every pointing the curvature is well determined: on April 20 was equal to and a similar value was found on October 06 (see Tab. 3), whereas the 2–10 keV flux (6.8 erg cm-2 s-1) was more than 3 times higher than that recorded at the first epoch. Two days later, on October 07-08, the spectral curvature was slightly lower while the flux was practically unchanged.
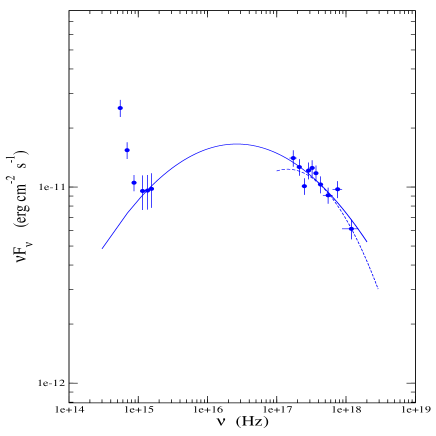
It is very interesting to note that 1ES 1553+113 is the only source in our sample with a SED having the optical/UV emission higher than X-rays, as shown in Fig.5, and this feature was observed in all the pointings. We plotted two best fit spectra: one for the X-ray data only (dashed lines) and the other for both UVOT and XRT points (solid lines). It is evident that when the UV points are included in the fit the resulting values of and are significantly lower: the new values of the spectral parameters are also given in Table 3 and are denoted by UV, whereas the fluxes in the UVOT filters are listed in Table 5. We verified that the new values of XRT data computed with and frozen to the values coming from simultaneous UV-X points remain acceptable (see Tab. 3). Note in particular that the spectral curvature when UV data are taken into account is around 0.1, a value consistent with that found by Perlman et al. (2005) in high statistics XMM-Newton observations.
3.6 1ES 1959+650
1ES 1959+650 has a redshift =0.047 and was detected at TeV energies in 1999 (Nishiyama et al. (1999)) and confirmed by Whipple (Holder (2003)) and HEGRA (Horns). It was observed twice by BeppoSAX in September 2001 when it showed a significant spectral curvature (Tagliaferri et al. (2003)). These authors used a LP law and found a value of of about 0.4. In May 2002 1ES 1959+650 was the subject of a multiwavelength campaign in which a strong TeV/X-ray correlation was found with the remarkable exception of the TeV flare on 4 June 2002 which was not associated to any X-ray activity (Krawczynski et al. (2004)).
We have only one Swift observation of this source. In our spectral analysis we adopted the Galactic value of cm-2, although the possibility of a high intrinsic absorption cannot be excluded. We confirmed the spectral analysis with , a flux of about erg cm-2 s-1and a peak energy at keV.
Similar curvatures were also found by Perlman et al. (2005).
Recently Gutierrez et al. (2006) reported a time resolved spectral analysis of RXTE observations in the 4–15 keV range and found a curvature parameter in the interval 0.1–0.4 over a period of about four years.
As in the case of H 1426+428 and 1ES 1553+113 we found that simultaneous UVOT -XRT data are compatible with a LP law. In Fig.6 (solid line), we plotted the LP broad band best fit, which peaks at 0.3 keV and has 0.2. The for only the XRT data is increased but still acceptable, as for the previous sources.
| Object | Date | ||||||
|---|---|---|---|---|---|---|---|
| 1H 1100230 | Jun 30 | 0.94 | 0.71 | 0.64 | 0.49 | 0.50 | 0.40 |
| Jul 13 | |||||||
| H 1426+428 | Apr 02 | 0.79 | 0.40 | 0.29 | 0.21 | 0.20 | 0.21 |
| Jun 19 | 0.84 | 0.50 | 0.32 | 0.26 | 0.24 | 0.24 | |
| 1ES 1553+113 | Apr 20 | 8.0 | 7.1 | 6.3 | 4.0 | 3.6 | 3.1 |
| Oct 06 | 6.6 | 6.0 | 5.7 | ||||
| Oct 08 | 6.9 | 6.3 | 5.9 | ||||
| 1ES 1959+650 | Apr 19 | 4.9 | 3.6 | 3.1 | 2.2 | 2.5 | 1.9 |
| 1ES 2344+514 | Apr 19 | 4.6 | 2.2 | 1.2 | 0.8 | 0.7 | 0.6 |
3.7 PKS 2005489
PKS 2005489 (0.071) was discovered at TeV energies by H.E.S.S. in 2004 (Aharonian et al. 2005a ) with an integrated flux over 200 GeV of erg cm-2s-1, corresponding to about 25% of the Crab Nebula. Past X-ray observations were performed by BeppoSAX in September 1996 and November 1998. The curvature measured in those pointings was generally very low equal, to and , respectively, and the corresponding 2–10 keV fluxes were erg cm-2 s-1and erg cm-2 s-1(Giommi et al. (2002)).
Swift observations were performed in March and April 2005 and showed again low fluxes and curvatures. On March 03 we found and a flux of about erg cm-2 s-1, while in April the spectrum was consistent with a PL with a soft photon index (see Table 4). The flux computed by this spectral model is about an order of magnitude lower than that recorded in April. It is interesting to note that such a very soft X-ray spectrum corresponds well with that found by H.E.S.S. (Aharonian et al. 2005a ) in the TeV band, for which a photon index of 4 was measured, the softest for a BL Lac at these energies. These authors were confident that it was unlikely to have a high absorption by EBL and argued that the X-ray spectrum must really be soft. Our analysis of Swift data supports this conclusion.
3.8 PKS 2155304
PKS 2155304 (=0.117) is one of the first BL Lac object detected at TeV energies (Chadwick et al. (1999)). During October and November 2003 it was observed by H.E.S.S. and its TeV spectrum was found to be compatible with a PL with photon index of (Aharonian et al. 2005c ). BeppoSAX observed this source three times and the spectral curvature was found in the narrow range , whereas the flux changed from to erg cm-2 s-1(Giommi et al. (2002)).
Swift observed PKS 2155304 in 2005 only once and the statistics of the data were not sufficient to provide a good estimate of (see Table 3) which was found to be compatible with that measured during the previous observations, despite the lower flux level.Note, however, that the value of was significantly higher than 2 confirming the soft SED of this source.
3.9 1ES 2344+514
This BL Lac object (=0.044) was detected at TeV energies by Catanese et al. (1998), and more recent observations have been presented by Schroedter et al. (2005). It was observed by BeppoSAX in December 1996 and June 1998 and showed a strong X-ray variability with large flux and spectral changes (Giommi et al. (2000)).
1ES 2344+514 was observed by Swift on three occasions: its 2–10 keV flux was quite steady at a typical level of about 1erg cm-2 s-1. The low statistics of these observations and the high value of the Galactic column density =cm-2 does not allow us to determine the value of with a good accuracy and PL best fit parameters are given in Table 4. Note that the photon index was always larger than 2., indicating that the peak of the SED is at energies lower than 1 keV, as in the faint state reported by Giommi et al. (2000).
An UVOT observation is available only for the April 19 pointing: the stars in the band image appear elongated, probably from aspect reconstruction problems, but still within the 12′′ photometric radius. The results are reported in Table 5. Because of the large galactic extinction (=0.216), the flux in the M2 band is substantially affected by the 2200 Å interstellar band. Assuming the host galaxy estimate from the HST observation (Urry et al. 2000), we found that it contributes for about 90% of the signal in the and filters, and therefore these data are not representative of the AGN flux. In the UV filters, where the galaxian contribution is much lower, the SED appears substantially flat. In Fig. 7 the dashed line corresponds to LP fit of XRT data, which is not reported in Tab.3 because of the low accuracy of the resulting parameters; the solid line corresponds to the fit of UVOT and XRT data with a single LP law, having a curvature of about 0.15 and .
4 Discussion
Our Swift observations of TeV-detected blazars strongly confirm that the SED of these sources is often curved and well approximated by a LP law with peak energy generally in the X-ray band but that can vary more than one order of magnitude.
The estimate of the curvature parameter, however, is often a complex task as it may be affected by systematic and statistical uncertainties that sometimes can be very important, especially when working on a rather narrow frequency range. Under this respect the Swift instrumentation offers the unique possibility to simultaneously measure the X-ray and UV fluxes, where the contribution from the host galaxy is generally negligible. These data can be used to model the SED over a frequency interval spanning over three decades allowing us to test whether a single emission component can describe all data. This problem was already apparent from the spectral modelling of the BeppoSAX X-ray observations of Mkn 421 (Massaro et al. 2004a) and Mkn 501 (Massaro et al. 2004b), from which it resulted that no simple connection between optical and X-ray points was possible. For the sources presented here, we found that a single component is generally acceptable. However, there are some interesting differences among these sources.
As noted in Sect. 3.5, 1ES 1553+113 is the only source having a SED dominated by the UV emission: when a single LP is used the peak position moves at frequencies lower than 1016 Hz. UV points show a rather satisfactory agreement with the model whereas optical data are aligned along a harder spectrum. Such a discrepancy between optical and UV fluxes, which could be affected by a larger calibration uncertainty, however, it cannot be entirely explained in this way because it is not present in other sources and suggests a contribution from a different origin. Sbarufatti et al. (2005) did not find evidence of a host galaxy and therefore we must conclude that the excess is originated in the nuclear environment, although its nature is unclear.
Another very interesting source is H 1426+428 which shows a significantly larger variability in the X-ray band than at UV frequencies. Note that the flux at 0.3 keV is also rather stable in comparison with that at energies higher than 1 keV, a behaviour that recalls that of Mkn 501 (Massaro et al 2004b). This finding can imply that optical/UV photons are originated from the low energy tail of the same electron population that produces X-rays photons. However, the possibility that the UV radiation is emitted by another electron population, rather stable and of lower energy, non-cospatial to the high-energy one, cannot be excluded. To discriminate between these two possibilities it is useful the study of its time behavior at different wavelengths. We stress that optical and IR observation are not very useful because of the presence of a bright host galaxy that is very well detectable in these bands (see Fig. 4).
Finally, note that all five sources for which the PL model gave an acceptable fit are characterized by photon indices larger than 2, corresponding to values lower than 1 keV. Such steep spectra generally correspond to a low number of net counts in the high energy channels making curvature very hard to estimate.
The shape of X-ray spectra reflects the energy distribution of the emitting particles. The relations between the curvatures of the electron spectrum and those of the Synchrotron and Inverse Compton radiation that they emit has been studied by Massaro et. (2006). Curvature in the electron energy distribution may be the result of statistical acceleration (see Massaro et. al 2004a), therefore the X-ray spectral curvature presented in this paper may be used to investigate possible signs of statistical acceleration arising in different conditions like energy dependent acceleration probability or fluctuations in the energy gain. (Kardashev 1962, Tramacere et al. 2006 in prep.).
An interesting consequence of intrinsic spectral curvature is that it has direct implications in the estimate of the pair production opacity due to Extragalactic Background Light (EBL) as pointed out by Massaro et al. (2006) for the case of Mkn 501 on the basis of simultaneous X-ray and TeV observations. The observed spectra are the combination of the intrinsic shape of the IC radiation and the -ray opacity. At present the amount of EBL is still uncertain (see Schroedter 2005 for a recent compilation) and upper limits on it, derived assuming a PL spectrum for the TeV emission of nearby BL Lac objects, are reduced if intrinsically curved IC spectra are considered.
Acknowledgements.
The authors acknowledge financial support by the Italian Space Agency (ASI) to the ASDC and to the Italian Swift team through grant I/R/039/04 and by the Phys. Dept. by Università di Roma La Sapienza. This work is sponsored at Penn State University by NASA contract NAS5-00136. We thank G. Cusumano for his support with the XRT calibration. We acknowledge the use of the National Extragalactic Database (NED) for the values of listed in table 2.References
- Aharonian et al. (2002) Aharonian, F., Akhperjanian, A., Barrio, J., et al. 2002, A&A, 384, 23
- (2) Aharonian, F., Akhperjanian, A.G., Aye, K.-M. et al. 2005a, A&A, 436, L17
- (3) Aharonian, F., Akhperjanian, A.G., Aye, K.-M. et al. 2005b, A&A, 437, 95
- (4) Aharonian, F., Akhperjanian, A.G., Bazer-Bachi, A.R. et al. 2005c, A&A, 442, 895
- (5) Aharonian, F., Akhperjanian, A.G., Bazer-Bachi, A.R. et al., 2006a, Nature, 440, 1018
- (6) Aharonian, F., Akhperjanian, A.G., Bazer-Bachi, A.R., et al. 2006b, A&A, 448,L19
- Albert et al. (2006) Albert, J., Aliu, E., Anderhub, H. et al., 2006 ApJ 642, L119
- Barthelmy et al. (2005) Barthelmy, S., Barbier, L. M., Cummings, J., et al. 2005, SSRv., 120, 95
- Blustin et. al (2004) Blustin A.J., Page M.J. & Branduardi-Raymont G. 2004, A&A, 417, 61
- Burrows et al. (2005) Burrows, D., Hill, J. E., Nousek, J. A., et al. 2005, SSRv., 120, 165
- Campana et al (2006) Campana, S., Beardmore, A.P., Cusumano, G., Godet O. 2006 “Swift-XRT-CALDB-09”
- Catanese et al. (1998) Catanese, M., Akerlof, C.W., Badran, H.M. et al. 1998, ApJ, 501, 616
- Chadwick et al. (1999) Chadwick, P. M., Lyons, K., McComb, T. J. L., et al. 1999, ApJ, 513, 161
- Costamante et al. (2001) Costamante, L., Ghisellini, G., Giommi, P. et al. 2001, A&A, 371, 512
- Djannati-Ataj et al. (2002) Djannati-Ataj, A. et al., 2002, A&A, 391, L25
- Donato et al. (2005) Donato D., Sambruna R. M., Gilozzi M, 2005, A&A 433 1163
- Draper et al. (2004) Draper P.W., Gray N., Berry D.S. 2004, Starlink User Note 214, 15
- Dwek & Krennich (2005) Dwek E., Krennich F., 2005, ApJ, 618, 657
- Falcone et. al (2004) Falcone A.D., Cui W. & Finley J.P. 2004, ApJ, 601, 165
- Gehrels et al. (2004) Gehrels, N., Chincarini, G., Giommi, P., et al. 2004, ApJ, 611, 1005
- Gaidos et al. (1996) Gaidos J.A, Akerlof C.W, Biller S.D. et al. 1996, Nature, 383, 319
- Giommi et al. (2000) Giommi P., Padovani P., Perlman E.S. 2000, MNRAS, 317, 743
- Giommi et al. (2002) Giommi, P., Capalbi, M., Fiocchi, M. et al, 2002, in ”Blazar Astrophysics with BeppoSAX and Other Observatories”, p. 63
- Giommi et al. (2005) Giommi P., Piranomonte S., Perri, M., Padovani, P. 2005, A&A, 434, 385
- Giommi et al. (2006) Giommi P., Blustin A.J., Capalbi M., Colafrancesco S. et al. 2006 A&A, in press
- Gutierrez et al. (2006) Gutierrez, K., Badran, H.M., Bradbury, S.M. et al. 2006 ApJ, 644 742
- Hill et al. (2004) Hill, J.E., Burrows, D.N., Nousek, J.A. et al., 2004, SPIE, 5165, 217
- Holder (2003) Holder, J. 2003, Proceedings of the 28th International Cosmic Ray Conference, ICRC, 5, 2619
- Krawczynski et al. (2004) Krawczynski, H., Hughes, S.B., Horan, D. et al. 2004, ApJ, 601, 151
- Krennrich et al. (2002) Krennrich, F., Bond, I.H., Bradbury, S.M. et al. 2002, ApJ, 575, L9
- Landau (1986) Landau, R., Golisch, B., Jones, T.J. et al. 1986, ApJ, 308, 78
- (32) Massaro E., Perri M., Giommi P., Nesci R., 2004a, A&A, 413, 489
- (33) Massaro E., Perri M., Giommi P. et al., 2004b, A&A, 422, 103
- Massaro et al. (2006) Massaro E., Tramacere A., Perri M. et al. 2006, A&A, 448, 861
- Moretti et al. (2005) Moretti, A., Campana, S., Mineo, T. et al. 2005, Proc SPIE vol 5898, 360
- Nishiyama et al. (1999) Nishiyama, T. 1999, Proceedings of the 26th International Cosmic Ray Conference, ICRC 3, 370.
- Padovani & Giommi (1995) Padovani P., Giommi P. 1995, ApJ , 444, 567
- Perlman et al. (2005) Perlman E.S., Madejski G., Georganopoulos M. et al., 2005, ApJ 625, 727
- Punch et al. (1992) Punch, M., Akerlof, C.W., Cawley, M.F. et al., 1992, Nature, 358, 477
- Roming et al. (2005) Roming, P.W.A., Kennedy, T.E., Mason, K.O. et al, 2005, SSRv.,120, 143
- Sbarufatti et al. (2006) Sbarufatti et al, 2006, AJ, 132, 1-19
- Schroedter et al. (200) Schroedter, M., Badran, H.M., Buckley, J.H. et al., 2005, ApJ, 634, 947
- Schroedter (2005) Schroedter, M., 2005 ApJ, 628, 617
- Tagliaferri et al. (2003) Tagliaferri, G., Ravasio, M., Ghisellini, G. et al., 2003, A&A, 412, 711
- (45) Tanihata, C., Kataoka J., Takahashi T., et al., 2004, Apj, 601, 759
- Urry et al. (2000) Urry, C. M., Scarpa, R., O’Dowd, M.et al., 2000, ApJ, 532, 816