SDSS J1029+2623: A Gravitationally Lensed Quasar with an Image Separation of 22.5 Arcseconds1
Abstract
We report the discovery of a cluster-scale lensed quasar, SDSS J1029+2623, selected from the Sloan Digital Sky Survey. The lens system exhibits two lensed images of a quasar at . The image separation of makes it the largest separation lensed quasar discovered to date. The similarity of the optical spectra and the radio loudnesses of the two components support the lensing hypothesis. Images of the field show a cluster of galaxies at that is responsible for the large image separation. The lensed images and the cluster light center are not collinear, which implies that the lensing cluster has a complex structure.
I. Introduction
The discovery of SDSS J1004+4112 with an image separation of , the first example of a quasar multiply imaged by a massive cluster of galaxies, opened a new window for understanding our universe (Inada et al., 2003; Oguri et al., 2004; Sharon et al., 2005). Although there are many examples of galaxies (arcs) lensed by clusters, large-separation lensed quasars have several advantages over arcs as a cosmological probe. First, the simpler (point-like) structure of quasars and their well-understood redshift distribution should make the large-separation lensed quasars much cleaner probes of cosmology and structure formation models (e.g., Oguri & Keeton, 2004; Hennawi et al., 2006), while the statistics of arcs remain contentious (Bartelmann et al., 2003). Second, the time-variability of quasars allows the measurement of time delays among the multiple lensed images, thereby breaking the mass-sheet degeneracy of lens models given a priori knowledge of the Hubble constant (e.g., Kochanek, 2002). This was explored in detail for SDSS J1004+4112 (e.g., Oguri et al., 2004; Williams & Saha, 2004; Kawano & Oguri, 2006; Fohlmeister et al., 2006). Our current problem is that the small number of known systems limits their use in statistical analyses, however, current and future large lens surveys will discover many large-separation lensed quasars (Wambsganss, 2003).
In this Letter, we report the discovery of the second large-separation lensed quasar, SDSS J1029+2623, a quasar at doubly imaged by a massive galaxy cluster at . It was discovered in the course of the Sloan Digital Sky Survey Quasar Lens Search (SQLS; Oguri et al., 2006), which is a survey of strongly lensed quasars in the Sloan Digital Sky Survey (SDSS; York et al., 2000). The image separation of makes it the largest separation lens among the lensed quasars known so far (Kochanek, 2006).
II. Candidate Selection and Subaru observations
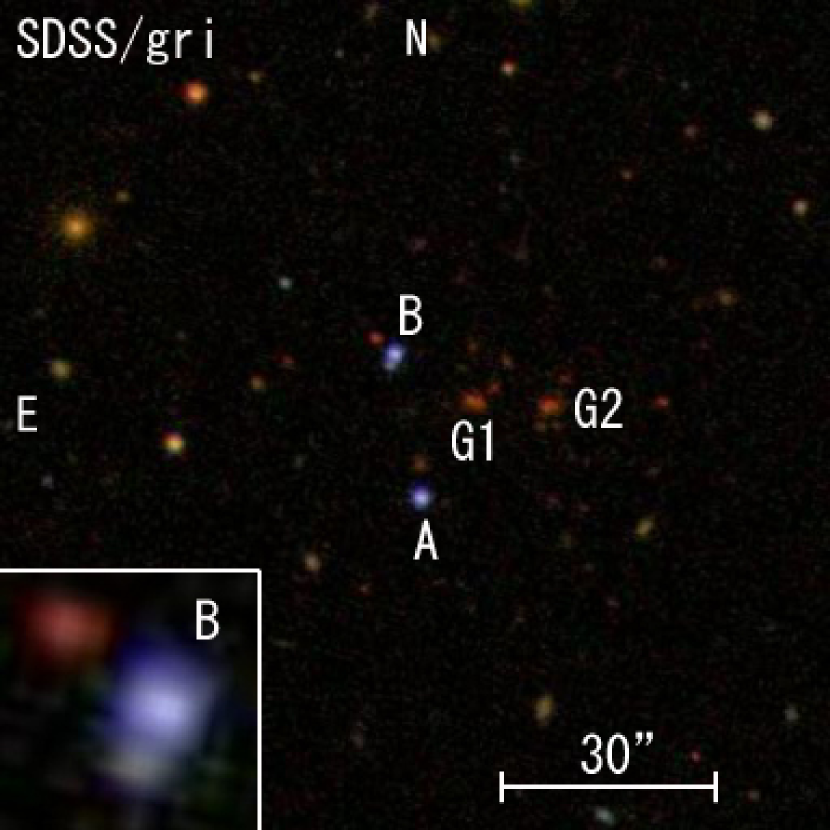
From the SDSS-II Sloan Legacy Survey data, we discovered the lens candidate SDSS J1029+2623 using the algorithm described in Oguri et al. (2006). It consists of a quasar whose redshift was spectroscopically measured by the SDSS to be (hereafter referred to as A) and a stellar object (hereafter B) with almost the same color as component A (see Table 1). Components A and B are separated by . There are no other point sources in the field with similar colors that would be candidates for additional quasar images. In addition to the similar colors, the composite SDSS image shown in the left panel of Figure 1 exhibits a concentration of red galaxies centered on two bright galaxies (named G1 and G2), which implies the existence of a high-redshift cluster of galaxies. Indeed, the photometric redshifts of G1 and G2 are both 0.55 from their SDSS colors (Csabai et al., 2003). The properties of components A, B, G1, and G2 are summarized in Table 1. We note that the details of the SDSS are described in a series of technical papers: Gunn et al. (2006) for the dedicated wide-field ( field of view) 2.5-m telescope; Fukugita et al. (1996), Gunn et al. (1998), Lupton et al. (1999), Hogg et al. (2001), Lupton et al. (2001), Smith et al. (2002), Pier et al. (2003), Ivezić et al. (2004), and Tucker et al. (2006) for the photometric survey; Richards et al. (2002) for the spectroscopic target selection algorithm of quasars; and Blanton et al. (2003) for the tiling algorithm of the spectroscopic survey. Most of the SDSS data are already publicly available (Stoughton et al., 2002; Abazajian et al., 2003, 2004, 2005; Adelman-McCarthy et al., 2006).
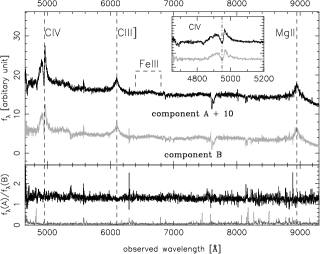
We obtained 600 sec spectra of components A and B with the Faint Object Camera And Spectrograph (FOCAS; Kashikawa et al., 2002) at the Subaru 8.2-meter telescope on 2006 June 28. The observation was conducted in the 31 on-chip binning mode, using the 300B grism, the SY47 filter and a -width slit aligned along components A and B. The spectral resolution, wavelength coverage, and spatial scale of the CCD detector were , from 4700 Å to 9400 Å, and pixel-1, respectively. Although the seeing was poor (18), the separation makes it easy to extract the spectra of the two components using standard IRAF181818 IRAF is distributed by the National Optical Astronomy Observatories, which are operated by the Association of Universities for Research in Astronomy, Inc., under cooperative agreement with the National Science Foundation. tasks. The spectra are shown in the upper panel of Figure 2. It is clear that both components are quasars at the same redshift, (see Table 1). Moreover, the spectral shapes are similar; both components have similar broad absorption line features at the same wavelength in the C IV emission lines, similar profiles for the Fe III emission lines, and similar characteristic shapes of the red wings of the Mg II emission lines. In addition, the spectral flux ratio plotted in the lower panel of Figure 2 is constant () over the full range of the observed wavelengths. The similarity of the spectra supports the idea that the two components are lensed images of a single quasar.
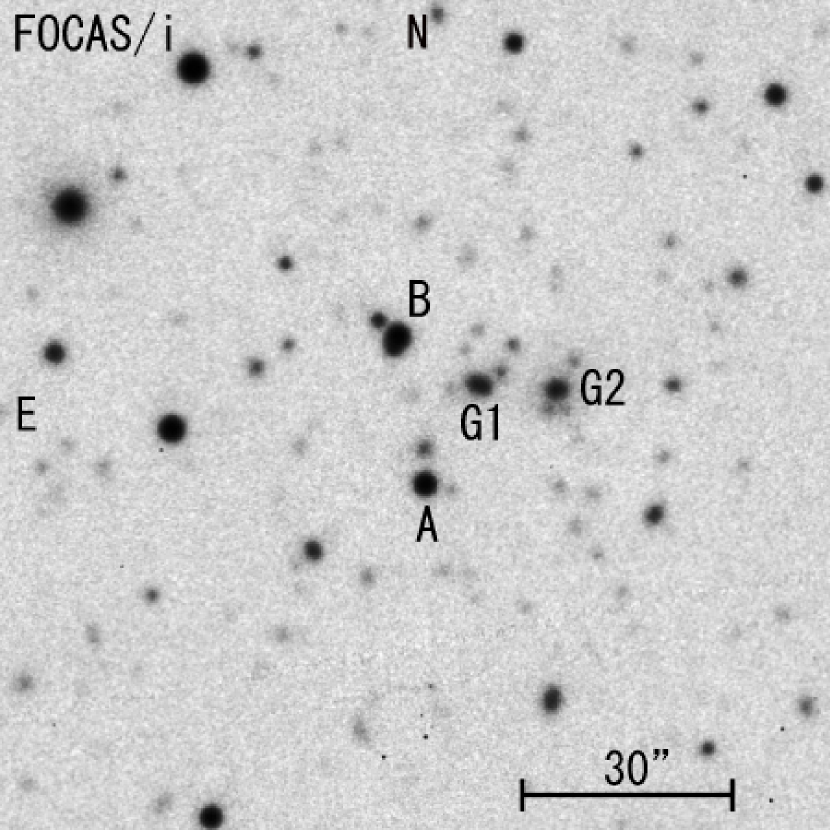
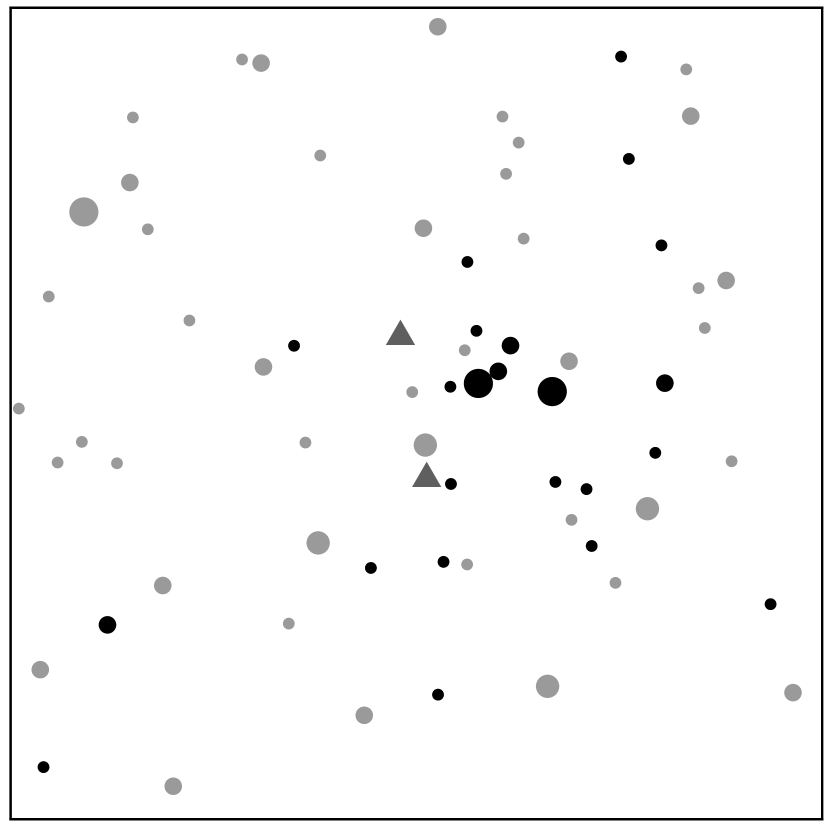
We also obtained 120 sec - and 120 sec -band images (18 seeing) with FOCAS. On-chip binning yielded images with a pixel scale of 0207 pixel-1. The -band image is shown in the middle panel of Figure 1. From the FOCAS images, we found that galaxy G1 is likely to be a superposition of two early-type galaxies; however, we treated them as a single object since the poor seeing prevents us from separating them. We used SExtractor (Bertin & Arnouts, 1996) for the photometry (MAG_AUTO) calibrated by the SDSS magnitudes of the nearby stars191919 We used the transformation formulae described in Table 7 of Smith et al. (2002) to calculate magnitudes of the nearby stars from the SDSS magnitudes.. All galaxies (classified by the combination of the SExtractor CLASS_STAR parameter and visual inspection) with are plotted as filled circles in the right panel of Figure 1. Among them, we selected galaxies with colors of as possible cluster members, because G1 and G2 have colors of 0.6 and 0.8, respectively. The color of 0.7 is consistent with the red-sequence color of a galaxy cluster at (e.g., Goto et al., 2003). The selected galaxies are plotted as dark filled circles in the right panel of Figure 1. As expected, clustering of galaxies near G1 and G2 is much more pronounced after the color cut, suggesting the existence of a cluster of galaxies at .
III. Discussion and Conclusion

An interesting thing about this lens system is that the quasar images and the light center of the lensing cluster appear not to be collinear (see Figure 1). Brightest cluster galaxies are sometimes significantly offset from the center of a cluster mass (e.g., Lin & Mohr, 2004), so the lack of collinearity does not necessarily argue against the lensing hypothesis. Nevertheless, it is of great interest to understand the impact of this offset for lens models. To explore this, we use standard mass modeling techniques as implemented in the public lensmodel software (Keeton, 2001). Since the small number of observational constraints limits detailed investigations of the mass distribution, we adopt the simplest model used for modeling studies, a singular isothermal ellipsoid (SIE). We fit the quasar positions and fluxes assuming a position error of and a flux error of 20%; we adopt errors larger than the actual measurement errors in order to account for perturbations from massive galaxies in the cluster. In addition we include a mild prior on the ellipticity, , to exclude models with a highly elongated cluster. With this model, we derive the allowed range for the center position of the lensing cluster potential, as shown in Figure 3. The offset of at least kpc between the preferred model positions and galaxies G1 and G2 suggests either that the actual mass distribution of the lensing cluster is more complex than this simple model or that there is a genuine offset that might be confirmed in X-ray observations.
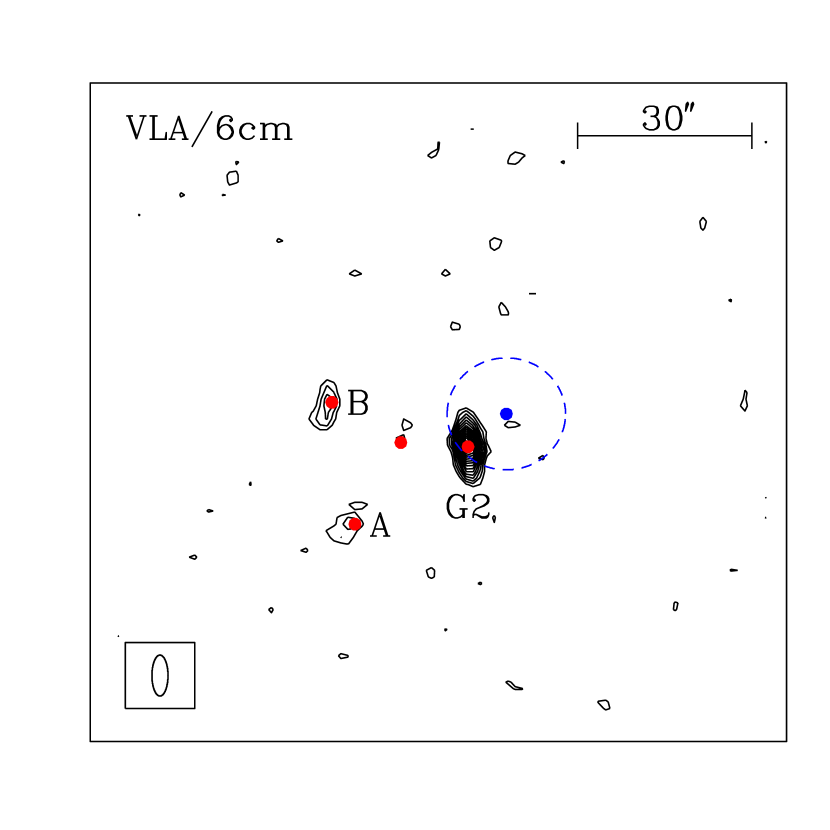
While the similarity of the optical spectra and the existence of the lensing galaxy cluster make the lensing interpretation solid, we can further test the lensing hypothesis using archival data at other wavelengths. In the FIRST radio survey (Becker et al., 1995), there are two radio sources in the field: Galaxy G2, with a peak flux of 4.20 mJy/beam, is the strongest source, component B, with a peak flux of 1.01 mJy/beam, is detected just at the flux limit, and component A is not detected. Although the difference could be explained by quasar variability combined with the time delay between the lensed images, it might argue a binary interpretation for the quasars. In order to clarify the interpretation of the FIRST radio data, we obtained a 1 hour 6 cm Very Large Array (VLA) radio map of the system on 23 September 2006. Figure 4 shows the primary beam corrected VLA 6 cm map; both quasar components have more than 5 detections (0.2370.045 mJy/beam for A and 0.3250.045 mJy/beam for B). There are some offsets (but within 5, see Table 1) between the SDSS positions and the VLA positions of the quasar components. However both components are extended in the VLA data and better quality data will be necessary to clarify the offsets. The radio loudnesses of the images, defined relative to the SDSS -band fluxes, are 1.8 and 2.5 for images A and B, respectively. The radio flux ratio (A/B) of 0.73 is mildly inconsistent with the optical flux ratio of 1.2, however, allowing for variability both between the epochs of the two observations and the multi-year time delay of the two images, finding two quasars with such similar radio loudnesses further supports the lensing hypothesis given the enormous range of radio loudnesses observed for quasars (Ivezić et al., 2002).
The system was also detected as 1RXS J102912.0+262338 by the ROSAT All-Sky Survey (Voges et al., 1999) with a count rate of counts s-1. This corresponds to an 0.1-2.4 keV flux of approximately ergs cm-2 s-1, and it is flagged as an extended source, albeit at low significance. The X-ray position could be consistent with the position of G2 given the uncertainties in the X-ray data (Figure 4). Assuming the X-ray signals arise from the lensing cluster (), the X-ray luminosity is approximately ergs s-1 (for a cosmological model with and ) and corresponds to a velocity dispersion of approximately km s-1 that is slightly larger than the velocity scale of km s-1 needed to produce the 225 image separation. Thus the X-ray luminosity is a little too high, suggesting that the AGN in galaxy G2 is an X-ray source as well as a radio source, even though it shows no signs of AGN activity in its broad band optical colors.
In summary, the best interpretation of the two quasar components in the SDSS J1029+2623 system is that a quasar at is doubly imaged by a cluster of galaxies at . The evidence for strong lensing comes from the remarkable similarity of the spectral shapes and the similar radio loudnesses of the two quasars, and the existence of the lensing cluster with the presence of an extended X-ray source which is capable of producing the observed image separation. However, simple mass models require a center of the cluster potential offset from the positions of the bright galaxies or the ROSAT X-ray emission. Such an offset with respect to the bright galaxies was also found for the SDSS1004+4112 system (Oguri et al., 2004), and the X-ray position may be dominated by the AGN in galaxy G2. Thus, further follow-up observations, such as deep and high-resolution X-ray imaging and optical spectroscopy of member galaxies are needed to identify the cluster potential center.
Acknowledgements.
This work was supported in part by Department of Energy contract DE-AC02-76SF00515. A portion of this work was also performed under the auspices of the U.S. Department of Energy, National Nuclear Security Administration by the University of California, Lawrence Livermore National Laboratory under contract No. W-7405-Eng-48. The National Radio Astronomy Observatory is a facility of the National Science Foundation operated under cooperative agreement by Associated Universities, Inc. This work made use of the Very Large Array at the NRAO, and we thank NRAO for a rapid response time award. Funding for the SDSS and SDSS-II has been provided by the Alfred P. Sloan Foundation, the Participating Institutions, the National Science Foundation, the U.S. Department of Energy, the National Aeronautics and Space Administration, the Japanese Monbukagakusho, the Max Planck Society, and the Higher Education Funding Council for England. The SDSS Web Site is http://www.sdss.org/. The SDSS is managed by the Astrophysical Research Consortium for the Participating Institutions. The Participating Institutions are the American Museum of Natural History, Astrophysical Institute Potsdam, University of Basel, Cambridge University, Case Western Reserve University, University of Chicago, Drexel University, Fermilab, the Institute for Advanced Study, the Japan Participation Group, Johns Hopkins University, the Joint Institute for Nuclear Astrophysics, the Kavli Institute for Particle Astrophysics and Cosmology, the Korean Scientist Group, the Chinese Academy of Sciences (LAMOST), Los Alamos National Laboratory, the Max-Planck-Institute for Astronomy (MPIA), the Max-Planck-Institute for Astrophysics (MPA), New Mexico State University, Ohio State University, University of Pittsburgh, University of Portsmouth, Princeton University, the United States Naval Observatory, and the University of Washington.References
- Abazajian et al. (2003) Abazajian, K., et al. 2003, AJ, 126, 2081
- Abazajian et al. (2004) Abazajian, K., et al. 2004, AJ, 128, 502
- Abazajian et al. (2005) Abazajian, K., et al. 2005, AJ, 129, 1755
- Adelman-McCarthy et al. (2006) Adelman-McCarthy, J. K., et al. 2006, ApJS, 162, 38
- Bartelmann et al. (2003) Bartelmann, M., Meneghetti, M., Perrotta, F., Baccigalupi, C., & Moscardini, L. 2003, A&A, 409, 449
- Becker et al. (1995) Becker, R. H., White, R. L., & Helfand, D. J. 1995, Astrophys. J. , 450, 559
- Bertin & Arnouts (1996) Bertin, E. & Arnouts, S. 1996, A&AS, 117, 393
- Blanton et al. (2003) Blanton, M. R., Lin, H., Lupton, R. H., Maley, F. M., Young, N., Zehavi, I., & Loveday, J. 2003, AJ, 125, 2276
- Csabai et al. (2003) Csabai, I., et al. 2003, AJ, 125, 580
- Fohlmeister et al. (2006) Fohlmeister, J., et al. 2006, Astrophys. J. , submitted (astro-ph/0607513)
- Fukugita et al. (1996) Fukugita, M., Ichikawa, T., Gunn, J. E., Doi, M., Shimasaku, K., & Schneider, D. P. 1996, AJ, 111, 1748
- Goto et al. (2003) Goto, T., et al. 2003, AJ, 123, 1807
- Gunn et al. (1998) Gunn, J. E., et al. 1998, AJ, 116, 3040
- Gunn et al. (2006) Gunn, J. E., et al. 2005, AJ, 131, 2332
- Hennawi et al. (2006) Hennawi, J. F., Dalal, N., & Bode, P. 2006, Astrophys. J. , in press (astro-ph/0506175)
- Hogg et al. (2001) Hogg, D. W., Finkbeiner, D. P., Schlegel, D. J., & Gunn, J. E. 2001, AJ, 122, 2129
- Inada et al. (2003) Inada, N., et al. 2003, Nature (London), 426, 810
- Ivezić et al. (2002) Ivezić, Ž., et al. 2002, AJ, 124, 2364
- Ivezić et al. (2004) Ivezić, Ž., et al. 2004, AN, 325, 583
- Kashikawa et al. (2002) Kashikawa, N., et al. 2002, PASJ, 54, 819
- Kawano & Oguri (2006) Kawano, Y., & Oguri, M. 2006, PASJ, 58, 271
- Keeton (2001) Keeton, C. R. 2001, preprint (astro-ph/0102340)
- Kochanek (2002) Kochanek, C. S. 2002, Astrophys. J. , 578, 25
- Kochanek (2006) Kochanek, C. S. 2006, in: Kochanek, C. S., Schneider, P., Wambsganss, J., Part 2 of Gravitational Lensing: Strong, Weak & Micro, Proceedings of the 33rd Saas-Fee Advanced Course, G. Meylan, P. Jetzer & P. North, (eds.), Springer-Verlag: Berlin, 91
- Lin & Mohr (2004) Lin, Y.-T., & Mohr, J. J. 2004, Astrophys. J. , 617, 879
- Lupton et al. (1999) Lupton, R. H., Gunn, J. E., & Szalay, A. S. 1999, AJ, 118, 1406
- Lupton et al. (2001) Lupton, R., Gunn, J. E., Ivezić, Z., Knapp, G. R., Kent, S., & Yasuda, N. 2001, in ASP Conf. Ser. 238, Astronomical Data Analysis Software and Systems X, ed. F. R. Harnden, Jr., F. A. Primini, and H. E. Payne (San Francisco: Astr. Soc. Pac.), p. 269
- Oguri et al. (2004) Oguri, M., et al. 2004, Astrophys. J. , 605, 78
- Oguri & Keeton (2004) Oguri, M., & Keeton, C. R. 2004, Astrophys. J. , 610, 663
- Oguri et al. (2006) Oguri, M., et al. 2006, AJ, 132, 999
- Pier et al. (2003) Pier, J. R., Munn, J. A., Hindsley, R. B., Hennessy, G. S., Kent, S. M., Lupton, R. H., & Ivezić, Ź. 2003, AJ, 125, 1559
- Richards et al. (2002) Richards, G. T., et al. 2002, AJ, 123, 2945
- Sharon et al. (2005) Sharon, K., et al. 2006, Astrophys. J. , 629, L73
- Smith et al. (2002) Smith, J. A., et al. 2002, AJ, 123, 2121
- Stoughton et al. (2002) Stoughton, C., et al. 2002, AJ, 123, 485
- Tucker et al. (2006) Tucker, D. L., et al. 2006, AN, in press (astro-ph/0608575)
- Voges et al. (1999) Voges, W., et al. 1999, A&A, 349, 389
- Wambsganss (2003) Wambsganss, J. 2003, Nature (London), 426, 781
- Williams & Saha (2004) Williams, L. L. R., & Saha, P. 2004, AJ, 128, 2631
- York et al. (2000) York, D. G., et al. 2000, AJ, 120, 1579
| Component | R.A.(SDSS) | Decl.(SDSS) | R.A.(VLA) | Decl.(VLA) | Redshift2020footnotemark: 20a | |||||
|---|---|---|---|---|---|---|---|---|---|---|
| A | 10:29:13.94 | +26:23:17.9 | 10:29:14.052121footnotemark: 21b | +26:23:17.42222footnotemark: 22b | 18.590.01 | 0.720.04 | 0.180.01 | 0.190.01 | 0.320.03 | 2.19660.0003 |
| B | 10:29:14.24 | +26:23:40.1 | 10:29:14.312323footnotemark: 23b | +26:23:39.3242424ab | 18.610.01 | 0.670.04 | 0.140.01 | 0.200.01 | 0.04 | 2.19690.0003 |
| G1 | 10:29:13.35 | +26:23:32.8 | 19.010.04 | 0.710.90 | 1.930.17 | 1.050.06 | 0.750.09 | 0.560.03 | ||
| G2 | 10:29:12.48 | +26:23:32.0 | 10:29:12.49 | +26:23:31.9 | 18.770.03 | 1.631.72 | 1.870.15 | 1.060.05 | 0.480.08 | 0.530.06 |
Spectroscopic redshifts (derived from Mg II emission lines in the FOCAS spectra) for A and B, and photometric redshifts for G1 and G2 (Csabai et al., 2003). 2424footnotetext: bVLA position errors for A and B are both about 05 per coordinate.
Note. — Data are from the SDSS except for the celestial coordinates in the VLA data and the spectroscopic redshifts. Magnitudes refer model magnitudes without Galactic extinction corrections, measured on 13 December 2004. All celestial coordinates are given in J2000.